

USD/ZAR ANALYSIS
- Advancing U.S. treasury yields continue to plague ZAR bulls
- NFP data todays focus
- USD/ZAR testing key resistance levels
- Potential for upside rectangle breakout
RAND FUNDAMENTAL BACKDROP
Emerging Market (EM) currencies have felt the pinch globally as the U.S. Dollar reminded currency markets of its power as the worlds reserve currency. The Rand was one of the worst hit by an uptick in U.S. bond yields this past week as South African linked commodity prices also took a tumble – iron ore, spot platinum and spot gold. Yesterday’s speech by Fed Chair Powell failed to put concerns over rising yields at ease which could be to the detriment of the Rand in the short to medium-term.
The chart below outlines the positive correlation between the U.S. treasury yields (yellow) and the USD/ZAR spot rate (blue), while the white line represents the MSCI Emerging Market Currency Index which highlights the recent EM decline.
USD/ZAR VS U.S. 10Y T-NOTE YIELD VS MSCI EM CURRENCY INDEX
Chart prepared by Warren Venketas, Refinitiv
ECONOMIC ANNOUNCEMENTS
Monthly NFP data is scheduled later today which will likely result in short-term volatility around USD crosses. Should actual data deviate significantly from estimates, USD/ZAR could see key breaks in price.
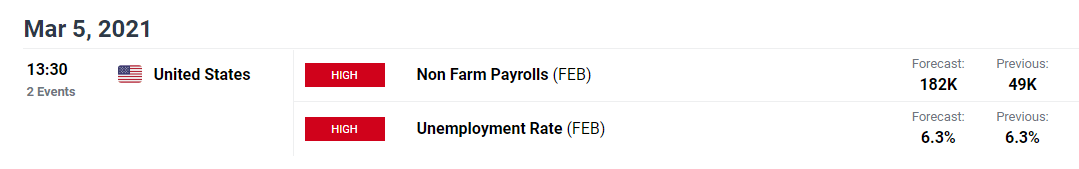
Source: DailyFX economic calendar

Recommended by Warren Venketas
Trading Forex News: The Strategy
TECHNICAL ANALYSIS
USD/ZAR WEEKLY CHART
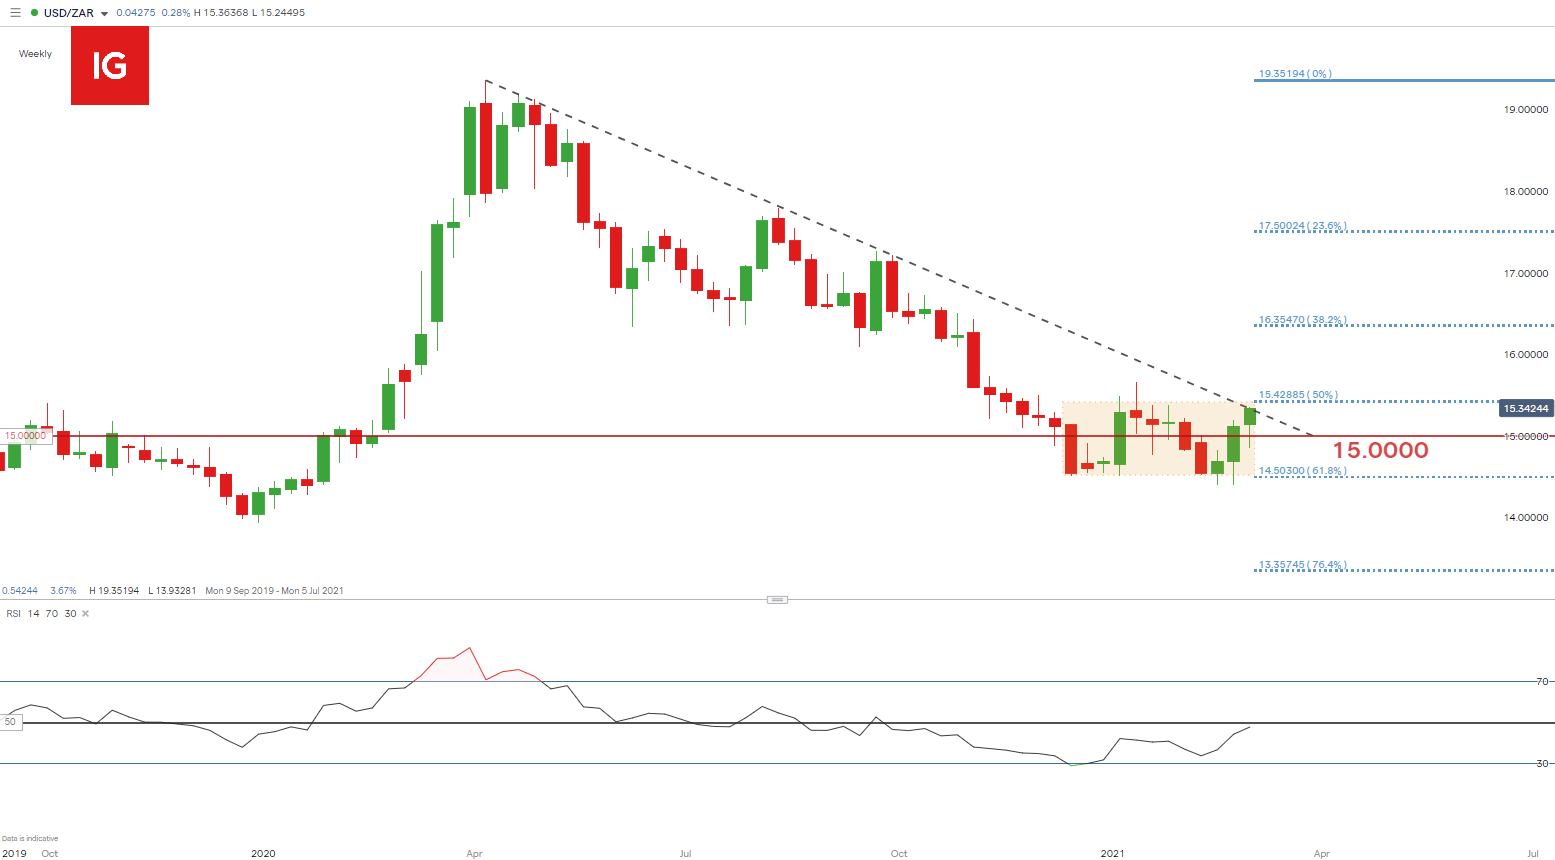
Chart prepared by Warren Venketas, IG
The existing rectangle consolidation pattern (yellow) on the weekly USD/ZAR chart is approaching topside resistance as well as the coinciding trendline (dashed black line). Rectangle resistance falls in line with the 50% Fibonacci retracement level (15.4289) which further emphasizes the significance of this resistance zone.
A break above may induce a longer-term trend reversal to the upside, while price rejection at resistance could see prices edge toward support and potentially a breakout below which would be consistent with a continuation of the preceding downtrend.
Discover the basic building blocks of Fibonacci and how it can be applied in Financial markets!
USD/ZAR DAILY CHART

Chart prepared by Warren Venketas, IG
The bull pennant (yellow) formation on the daily time frame has unfolded in an almost textbook fashion as prices surged beyond resistance yesterday. It is clear that the long-term downtrend (see weekly chart above) is a key area of confluence with the January swing high not too far away at 15.3801.
The Relative Strength Index (RSI) is now approaching the 70 level (overbought) which may suggest an end to the short-term push higher.
From the bearish perspective, a pullback lower would highlight the 15.0000 psychological level as initial support.
Starts in:
Live now:
Mar 16
( 17:03 GMT )

Keep up to date with price action setups!
Trading Price Action
USD/ZAR: KEY TECHNICAL POINTS TO CONSIDER
- Weekly: Rectangle resistance – 15.4289
- Daily: January swing high – 15.3801
- 15.0000 support
- Trendline resistance on both weekly and daily charts
- RSI advancing toward overbought territory
— Written by Warren Venketas for DailyFX.com
Contact and follow Warren on Twitter: @WVenketas
Be the first to comment