

Nuthawut Somsuk
“Buy & hold,” the now famous way to invest in the stock market, was promoted by “Jack” Bogle, the founder of Vanguard, who said “If you hold the stock market, you will grow with America.” A touching sentiment, but not a sound investment strategy.
We all agree that, if you hold the stock index long enough, you will come out ahead. But not in all stocks, and not in the short run. Does that make it a good way to invest? Not really. The risks are too high and the factors affecting prices are too complex.
To put it in perspective, let’s look at the Dow from 1920. I’ll use the Dow because it goes back much further than any of the other indices. You may want to ignore the 1929 crash, which is unlikely to happen again given the management of the Fed. It will still be shown on the chart. One never knows!
Chart 1 shows the price of the DOW from 1920 to 10/12/2022.
Data source: Yahoo Finance and CSI
Chart 1. The Dow from 1920 through 10/11/2022.
The problem with this chart is that we can’t see what happened before 2000 and the recent price swings look wildly volatile. So let’s separate the prices and look at the period before 1980.
Chart 2 now shows the 1929 Crash and a highly volatile period from the mid-1960s through 1979. It’s unlikely that any of us were trading then, which is probably good.
Data source: Yahoo Finance and CSI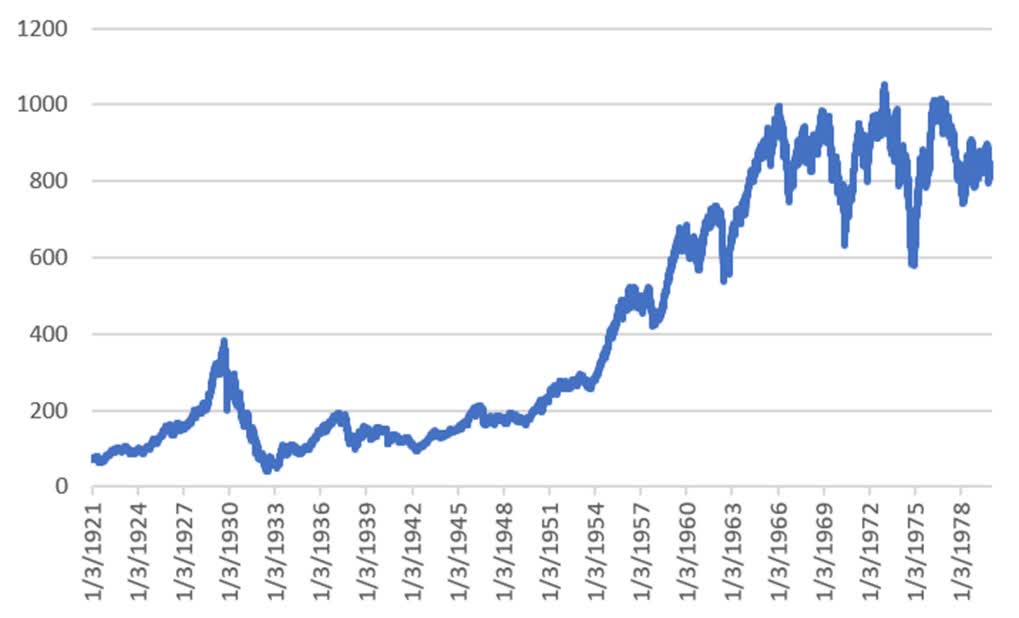
Chart 2. The Dow from 1920 to 1979.
To be complete, Table 1 shows the 10 largest drawdowns from 1920. It took 25 years to recover from the 1929 Crash. It took nearly eight years to recover from the Financial Crisis of 2008. It’s just a reminder that time spent during losing periods (“Draw”) is important.
Data source: Yahoo Finance and CSI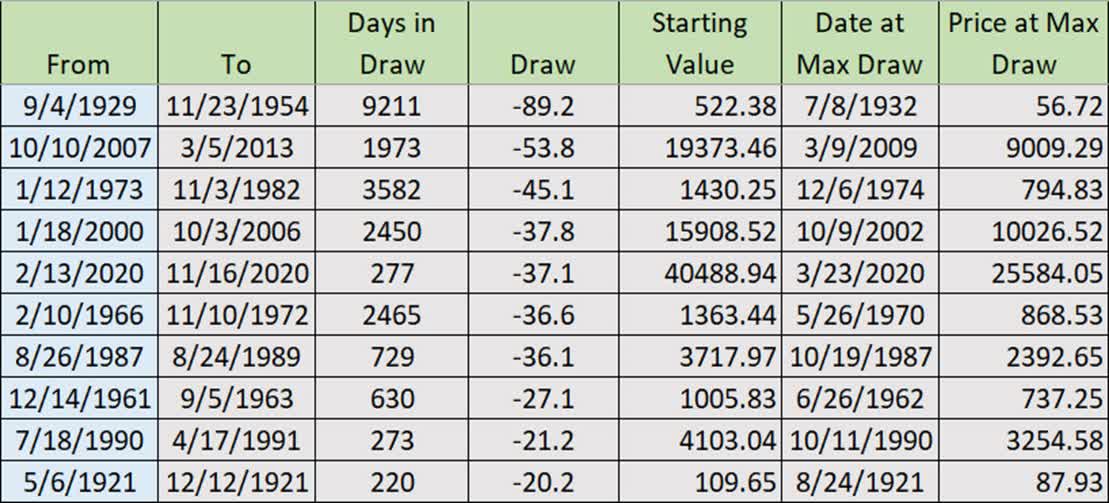
Table 1. The 10 largest drawdowns in the DOW from 1920.
Looking Back at Stock Market Returns
We can make any investment in the stock market look good if we select the right time period, especially if we start our investment at a low point, such as 2009. But we don’t know what will happen in the future. Probably not a 90% crash, but another 50% is not out of the question, and another eight years to recover is still possible.
Looking from 1920 to now, the DOW has had an annualized return of 6.09% with a volatility of 18.0%. “Volatility” is a way of measuring potential loss. 18% means that there is a good chance of losing 18% of your investment, and a small, but not unreasonable chance of losing 36%.
If we looked only from 2000 to now, the return is 4.24% with a risk of 18.9%. Essentially, you are taking (at least) three times the risk to get a 6% return. Surely, we can do better.
Simple Active Management is Better and More Profitable
There are good times to be in the market, and good times to be out. “Active management” does not mean trading every day, or even once a week. It just means having a plan and following it, not just buying stocks or ETFs and forgetting about them. After all, it’s your money and deserves some attention.
What are the choices for active management?
- Investing in a tactical fund, one that tries to beat the returns of the S&P
- Subscribing to an advisor’s newsletter and trading yourself.
- Following a trend method to get in or out of the market.
Tactical Funds
There are hundreds of equity and futures advisors, and hundreds of funds that would be happy to have you as a client. Some have been very successful, some not so good. The best ones have a long history of management, but none are without losses of at least 20%, probably 30%.
We used to think that Endowment Funds, such as Harvard, were intellectual towers. They knew more, had more talent, and certainly more money and resources. But in the 2008 Financial crisis it was reported that many of these ivory towers lost the same or more than the 50% market decline.
There is no such thing as outperforming the market with taking risks. I would rather take those risks myself than let others take them for me. And they charge for the privilege.
Newsletters
Newsletters can offer insightful advice. They highlight those stocks, metals, interest rates, and other markets that are in the news. Most of the advice is not specific and few publish the success of past advice. It will not be easy to buy and sell based on these reports. And once in the market, it is not clear that there would be an exit recommendation. It would require following each recommendation to completion, which would be a daunting task for a newsletter.
If you watch Mad Money with Jim Cramer, he recommends lots of stocks each day. His explanations seem convincing, but I don’t remember hearing a time period for a trade. And once covered, you have no idea when that stock will be discussed again. You’re on your own. It’s often the case with newsletters.
Finding the Trend
Now we come to the “trend,” a way of identifying the direction of prices. A moving average simply averages the prices of the past, say, 20 days. The concept is simple: if the moving average is rising, prices are going up; if it is falling, prices are going down. The moving average is intended to smooth out the price bumps and tell you the correct direction.
The other popular choice is the “breakout,” buying a new high and selling a new low. It can be very similar to the Dow Theory, which sells a 20% decline, then buys back a 20% increase. Instead, this method will buy when today’s price goes above the price for the past 80 days, the typical period for futures funds.
We are going to use the breakout method because it ignores small ups and downs in price. A new high or low is significant because it means that something fundamental has changed in the market.
Looking at Returns Over Different Time Periods
Let’s start with all the data from 1921 and compare a buy & hold investment with the results of an 80-day breakout. Chart 3 shows the cumulative returns. The 80-day breakout looks far better because of compounding. Small improvements over a long time add up.
Data source: Yahoo Finance and CSI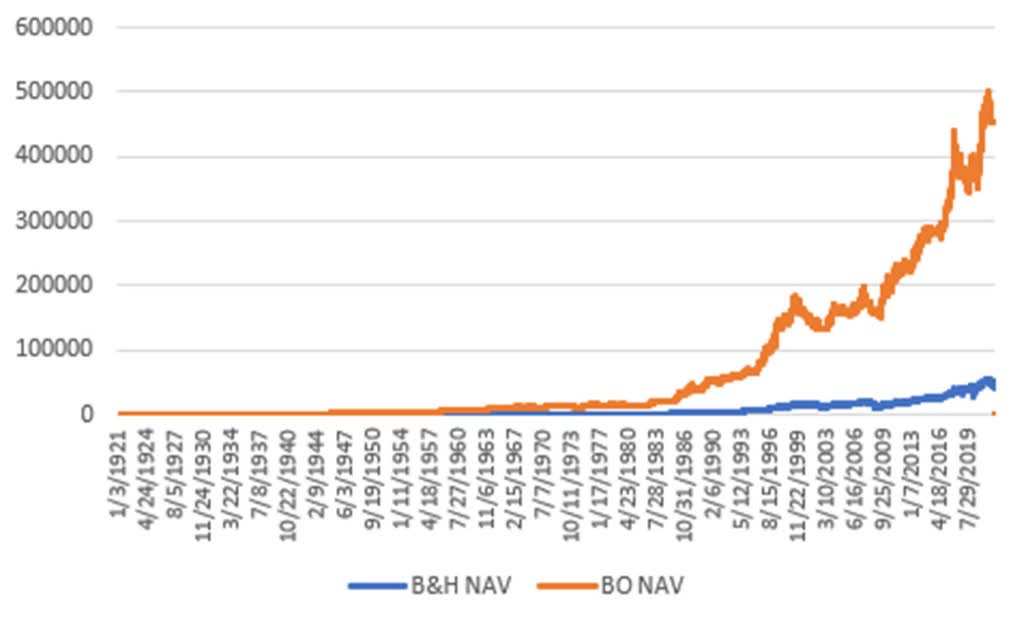
Chart 3. Comparing the returns of the Dow buy & hold with the returns of an 80-day breakout.
Now let’s look at how it would have done more recently. Chart 4 compares the returns starting in 2000. The breakout returns do not outperform buy & hold, but they are much better at controlling the risk. The short horizontal orange lines are when you would be out of the market. During those times you would get interest on your money, although that is not shown here.
Data source: Yahoo Finance and CSI
Chart 4. Comparing the returns of buy & hold with the returns of an 80-day breakout method from 2000.
Since 2010 we have had an incredible bull market, a trade war, and now extreme inflation. It is a difficult time to be in the market. Chart 5 shows that a simple systematic approach may not return as much as buy & hold but avoids nearly all of the risk. An experienced investor is always looking for the best return for the least risk. If the overall market continues to decline, the breakout returns may be higher than buy & hold. If the market rallies, the breakout method will go long. It has risk control, something that is missing from buy & hold.
Data source: Yahoo Finance and CSI
Chart 5. Comparing the returns of buy & hold with the returns of the 80-day breakout, from 2010.
Better Performance Over All Periods
To summarize, Table 2 compares the returns, risk, and shows the return to risk ratio for the three test periods. It is the ratio that is most important. Buy & hold consistently shows risk at about 18%. The breakout method shows much smaller risk with returns sometimes slightly lower. With a systematic approach you are getting the same returns with half the risk.
Data source: Yahoo Finance and CSI
Table 2. Returns, risk, and a return-to-risk ratio for buy & hold and the 80-day breakout.
The purpose of using a systematic approach is to control risk, to avoid those large losses that occur from time to time. By doing that, we can start investing with more money when the market turns up again. It’s a small effort for a big benefit.
Be the first to comment