


(This article was published on Aug. 13th. All data herein is from that date.)
Macro Picture
Stocks rallied hard again this week with the S&P 500 up another 3.26% and now up 12.08% over the last month. The YTD losses are down to single digits now at -9.35%. Recall that JPMorgan had a note out in April/May suggesting that they thought the S&P could finish flat this year. At the time it seemed preposterous. Now, not so much.
The big driver was the latest CPI report, which showed a stalling of price increases in the month-over-month period and a reduction of the yoy figure from +9.1% to +8.5%. This helped the market believe that a peak in inflation is in and that a Fed pivot is more a probability later this year or early next.
The probability of a 0.75% increase in the Fed Funds rate in September also fell from 80% to 40% with the market now banking on a 0.50% increase.
Interest rates jumped on the week with the 10-year yield rising to 2.85% from below 2.70% ten days ago. The Volatility Index or VIX fell below 20 for the first time since early April.
The Nasdaq has rallied just over 23% since the low on June 16th. Michael Burry of ‘The Big Short’ fame tweeted this out:
twitter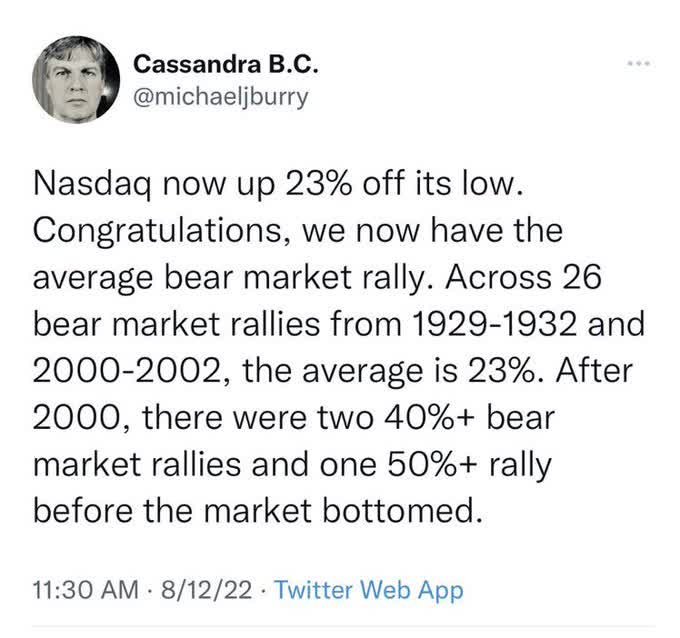
Inflation falling from +9.1% to +8.5% on headline was driven almost entirely by oil dropping. It has since rallied a bit though is still down -4% on the trailing month.
Energy costs, driven primarily by oil, explains most of the variation in the change in month-over-month (“m/m”) CPI. Though oil/gas is only 9% of the CPI index weight, it is an extremely volatile component. This is why we often look at “Core” numbers that exclude energy as well as food, the second most volatile asset class.
In other words, m/m CPI prints are all about oil.
BofA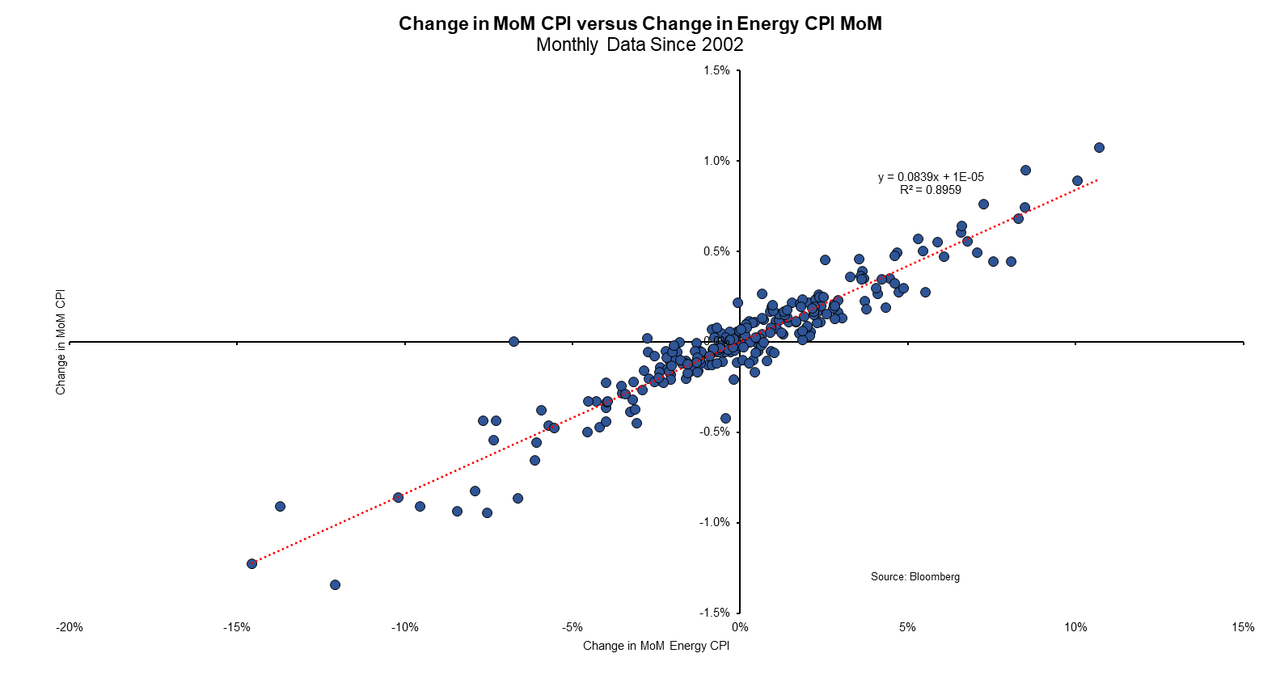
Despite the rally, recession indicators continue to sound the alarm. For one, we had leading indicators accelerating to the downside.
HendersonJanus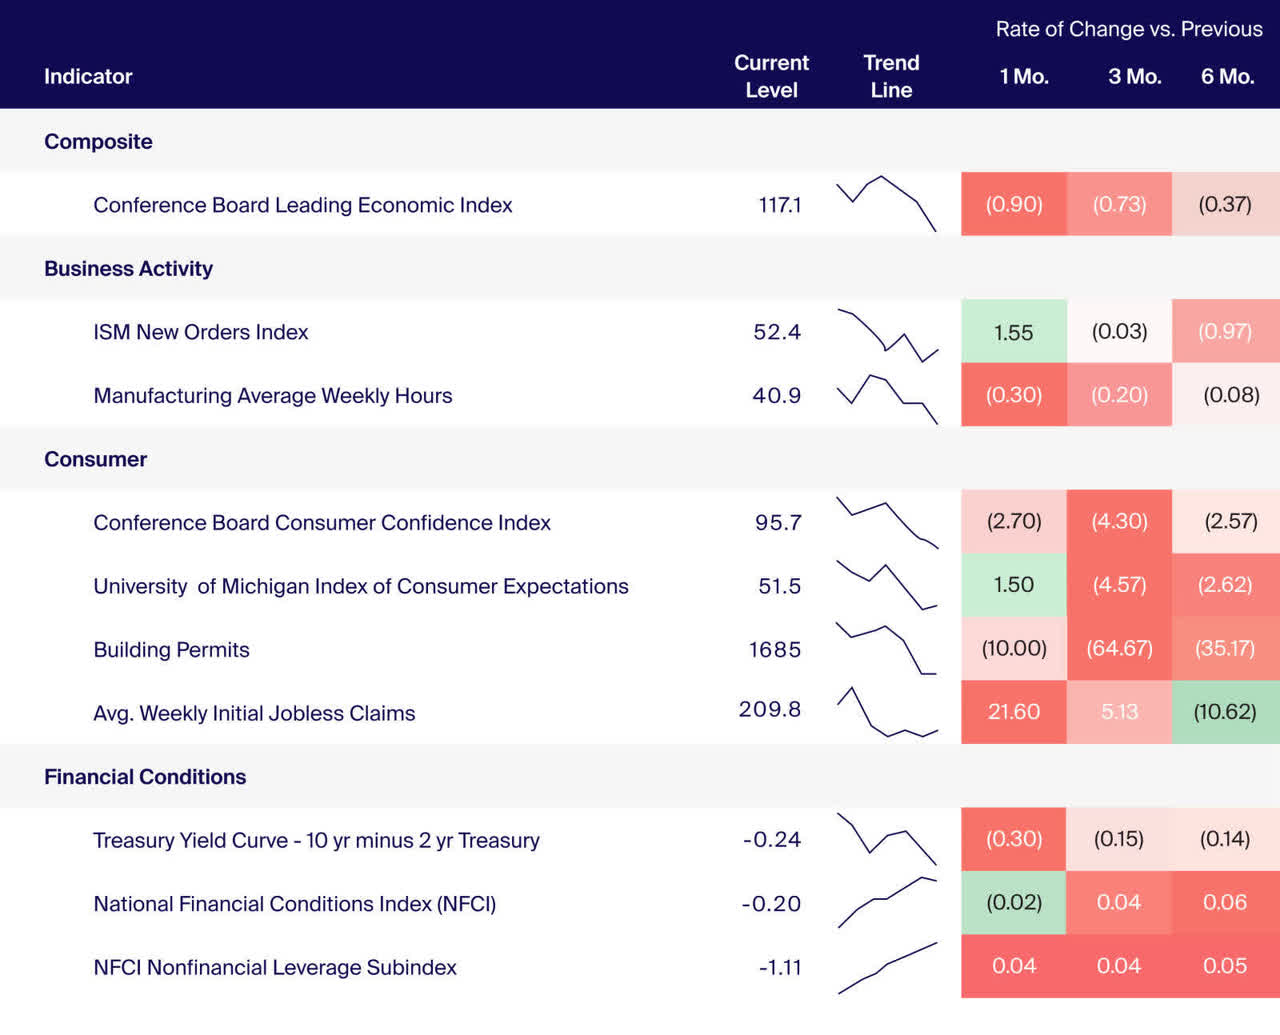
The Conference Board Leading Economic Index, a composite of ten components spanning labor, real estate, the stock market, interest rate spread, and consumer sentiment, anticipates turning points in the business cycle at around seven months and has historically dropped ahead of recessions and risen before expansions. While still near its all-time high, June saw the fourth consecutive month-on-month decrease in the index-the indicator’s last such occurrence were the months preceding the Global Financial Crisis – suggesting a meaningful trend in increasing the likelihood of weaker economic activity in the near term.
We also had the Anatomy of a Recession dashboard from Clearbridge (Franklin Templeton) turn yellow in July. That was due to the retail sales number going red (from yellow in June and green in May), commodities go red (from yellow in June and May), and the yield curve going yellow (from green in June and May).
Clearbridge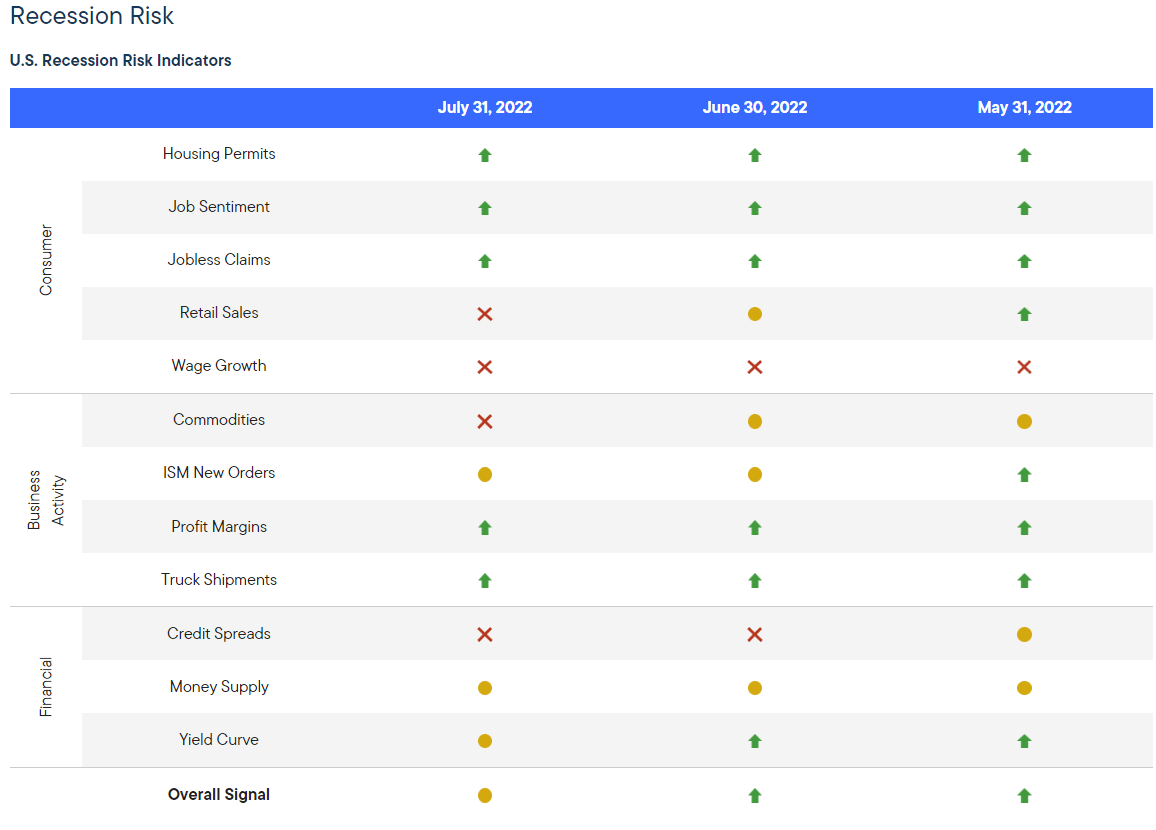
What will be the next shoe to drop? My guess is the labor market, as jobless claims could start rising materially as we get into the fourth quarter. Credit card debt is rising materially at the moment and car loans that are past due are also rising at a very fast pace. This indicates trouble by the consumer in paying their bills.
To me, this has all the hallmarks of a strong bear market rally that could start petering out as early as the next couple of weeks.
MacroAlf had a great chart that I saw from a hedge fund buddy of mine as well as plotting the S&P 500 with real yields. As many have been commenting, the markets are being driven by the Fed and real yields.
Real yields are simply the inflation rate subtracted out of a bond’s nominal yield. But with the 10-yr yield (which is what he uses) we can just use the US 10-yr TIPs which is at 37 bps.
Macrocompass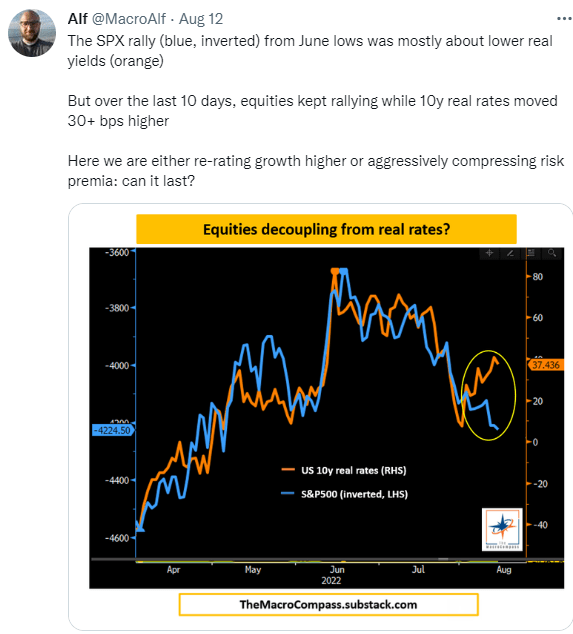
He shows the decoupling of the two variables in the last month or so. The question is, of course, how that rectifies itself. Does the S&P fall back or do real yields fall – or some combination of both?
I do think this fall will be a weaker period. As I noted this week, I think it’s time to do some tax-loss harvesting and rotate into areas of the market with higher quality. We have a discussion on that below.
It does appear that there has been a significant amount of short covering during this rally. That has been especially the case as of late. It makes intuitive sense as many have been waiting for the momentum in inflation to turn before going long and with that CPI number (and the expectation of it for the last several weeks), investors have been covering shorts.
LPL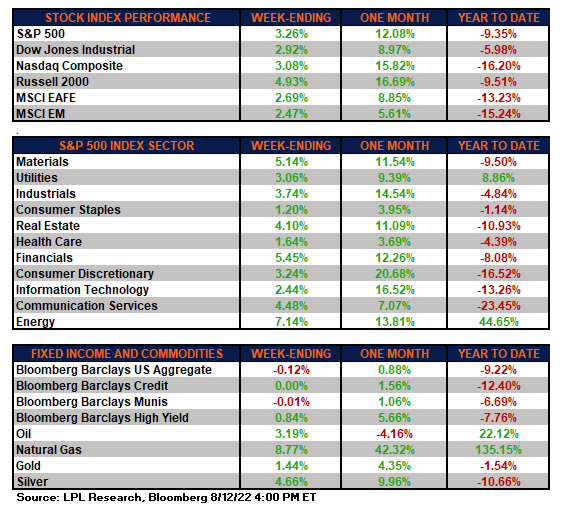
CEF Market Review
Alpha Gen Capital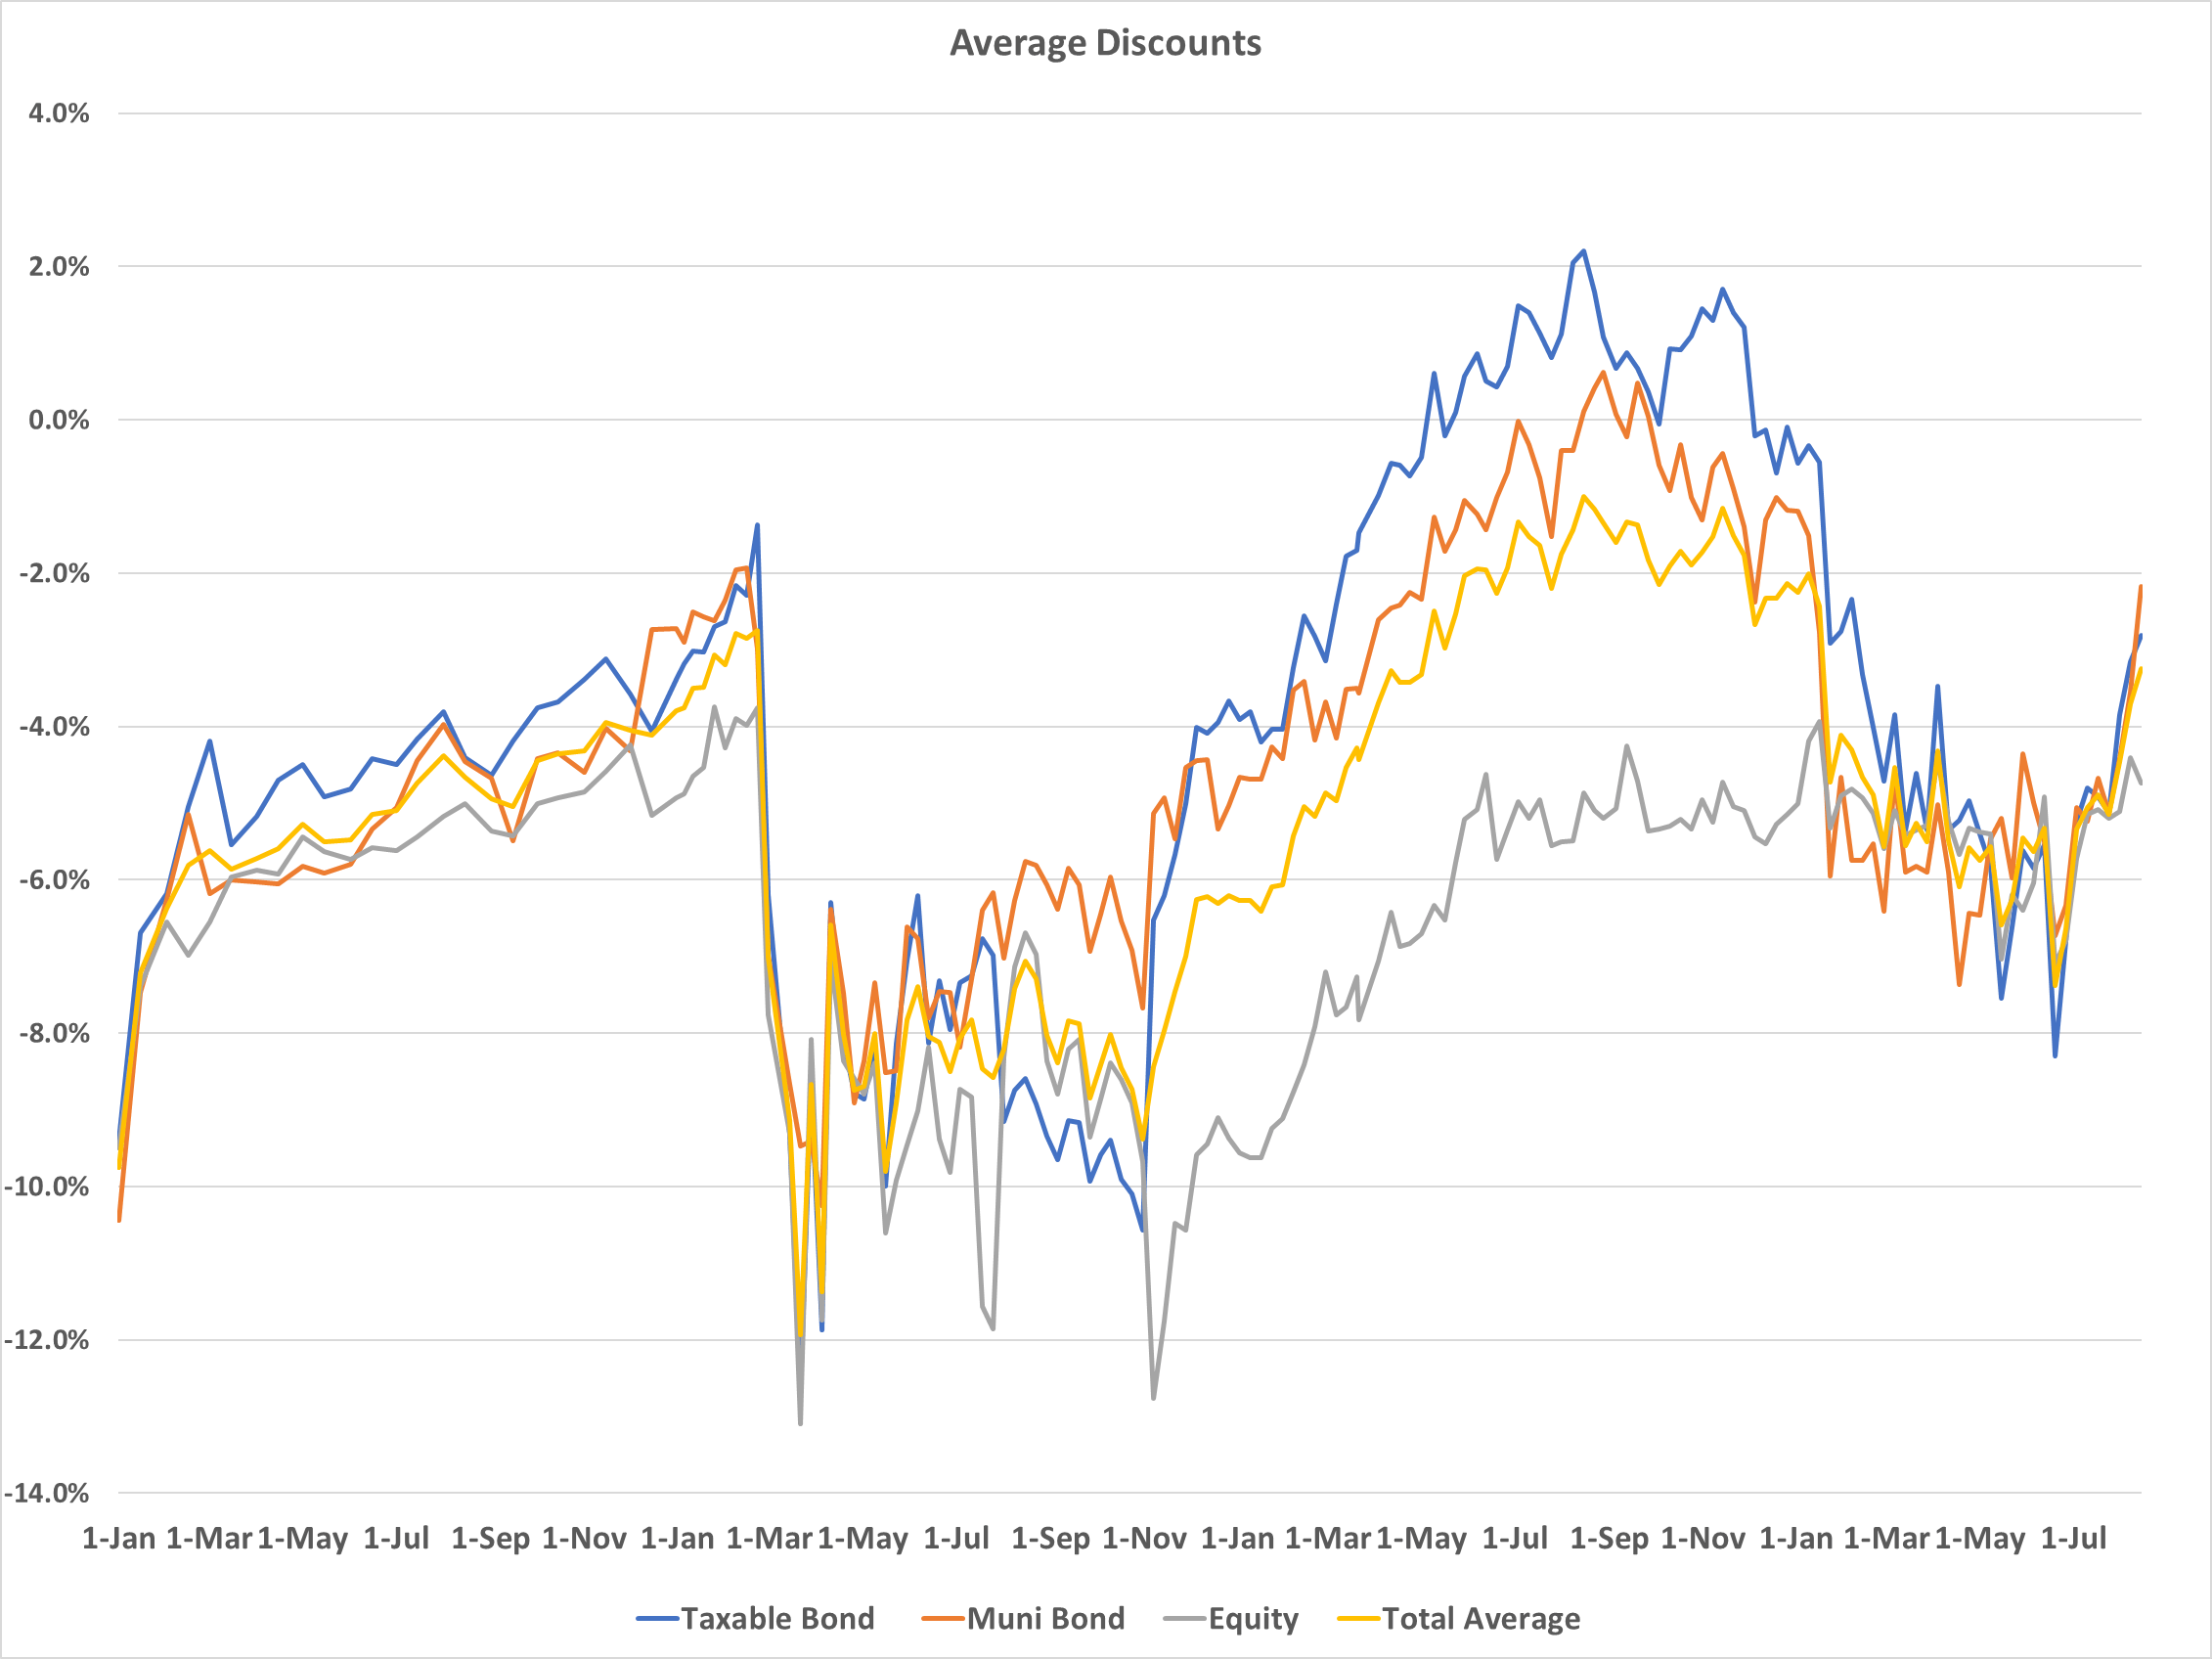
Check out the moves in discounts in the last couple of weeks. Taxable discounts have gone from -5.2% to -2.8% in short order. Muni CEF discounts have done even better going from -5.2% to -2.1%. Those are strong, bullish moves. With these moves, the taxable CEF market is now down single-digits at -9.5%, total return.
Using a few multisector Core funds as an example, you can see that YTD total return losses are coming back materially. PIMCO Dynamic Income Fund (PDI), for example, is now down just -8% YTD when at one point it was down -17.2%. The road back has been quick with it taking just 45 days to recover those losses.
ycharts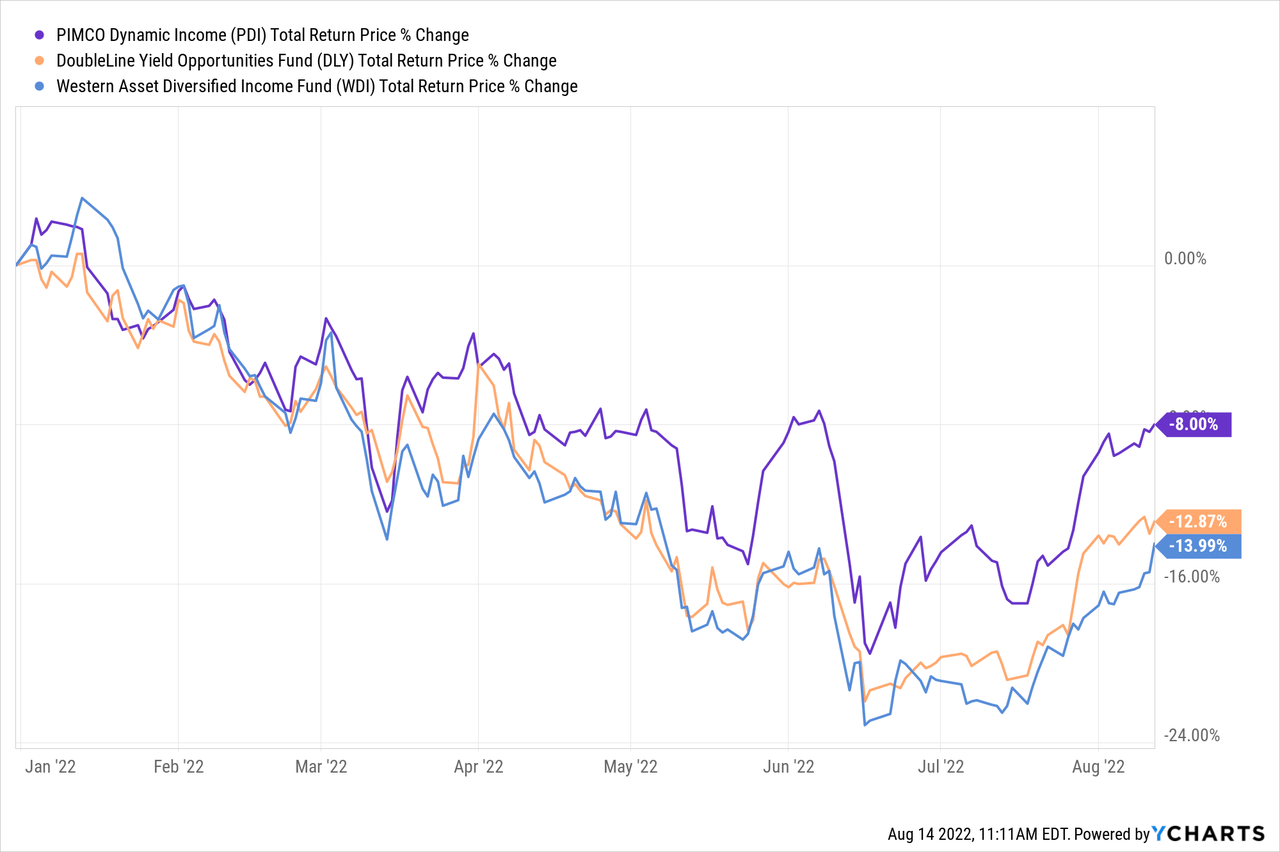
The other two funds, DoubleLine Yield Opportunities (DLY) and Western Asset Diversified Income (WDI) but have larger YTD price losses.
Some of that has been a significant amount of discount tightening (or premium build) in PDI. You can see if we move to NAV total returns, the losses are more in line with that of each other. Meaning that while the price returns look good, NAV returns shows that we have a long way to go.
ycharts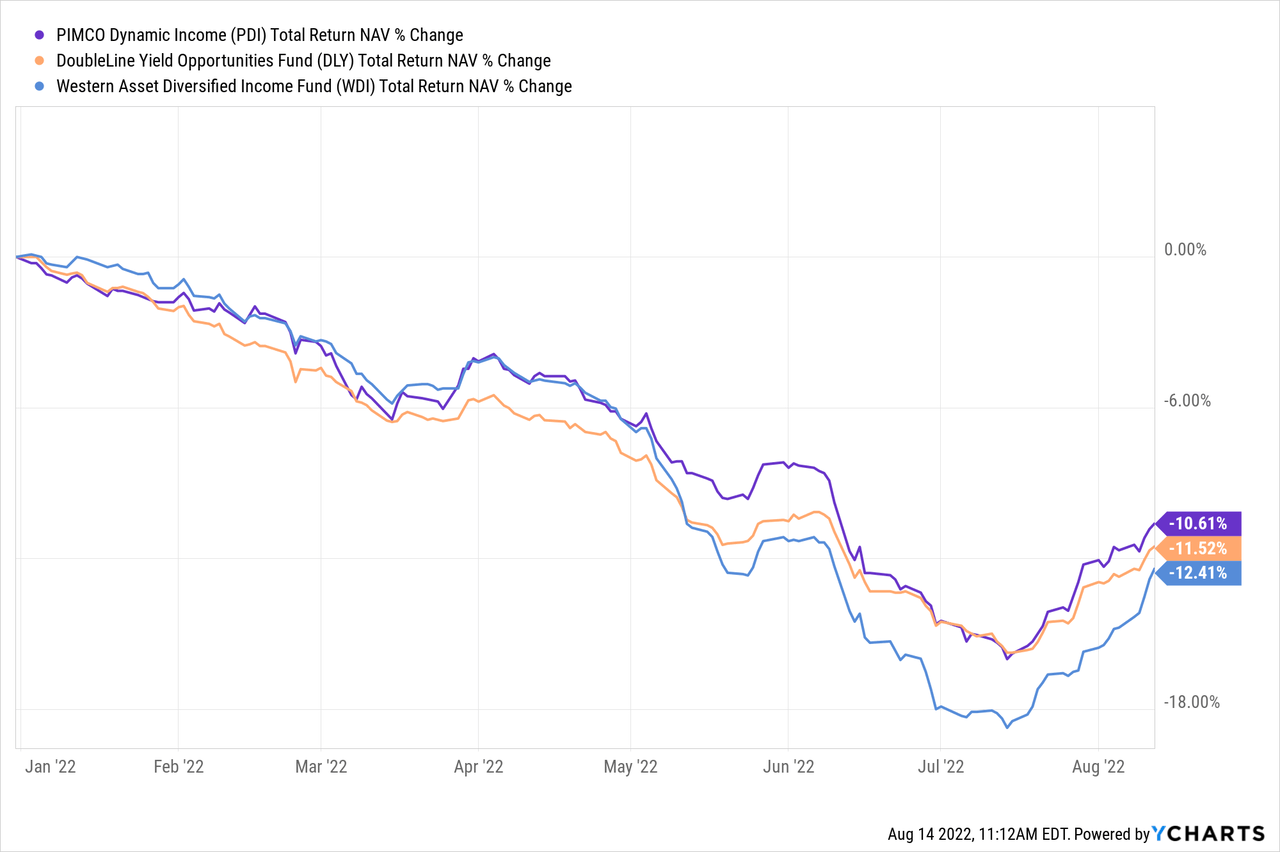
And price returns of funds like PDI are incorporating a ton of optimism that may or may not materialize given the recessionary data that is coming in.
In other words, the CEF marketplace as a whole looks very expensive.
Now you may say, but the discounts on the RiverNorth CEF Discount Stats page don’t look all that expensive. Muni CEF discounts are at 42%, meaning that 42% of the time going back to 1996, discounts have been tighter. That number for taxable bond CEFs is 44%.
While discounts are not in the top 10% of valuations like they were last summer or pre-Covid, they are indeed rich. That is compounded by the fact that the macro outlook is far more precarious than at those times.
The reason we are saying they are rich is based on the fact that short-term rates are rising. This lowers the net investment (“NII”) yield to the CEF investor.
What does that mean?
If a CEF portfolio has a portfolio yield of 5%, which gets leveraged up by 30% to 6.5% at which point you take out expenses and fees like borrowing costs, those costs will eat into that net yield. For example, if your management fee is 0.5% and leverage cost 0.5%, then the net yield is 5.5%. But if leverage costs balloon out to 2.0%, as they have in recent months, then the net yield is only 4.0%.
The fund may still pay you 5.5% or more, but it isn’t earning it. Coverage ratios are by and large falling fairly rapidly. On January 1 of this year, the average taxable bond CEF coverage ratio was 95.2%. On April 1, that had fallen to 92.9%. By August 1st, that is down to 88.6%. And that is after a few funds have cut.
In the muni space, the decline in coverage is much the same while at the same time about 75% of all muni CEFs have cut their distribution. That means that drop in coverage of the distribution has been significant.
As we discussed, the drop in coverage has mainly come from a rise in borrowing costs of funds to provide that leverage.
All that said is that net portfolio yields are not as attractive as they were given the higher interest costs.
Moving back to reviewing the CEF market, muni CEFs had the worst performing NAVs on the week as rates moved higher and money came out of the sector. Tax-free national muni funds lost 0.8%. Preferreds and mortgages were also down on the week, but much less so.
The top NAV performers were MLPs and natural resources, as oil rebounded. Their NAVs were up over 7% on the week.
Looking at Core Funds, you can see a lot of movement in a week. BNY Mellon Muni Bond Infra (DMB) saw another spike in price this week (presumably on another services’ recommendation) to a premium of nearly 15%. That’s a bit crazy and we would sell.
Alpha Gen Capital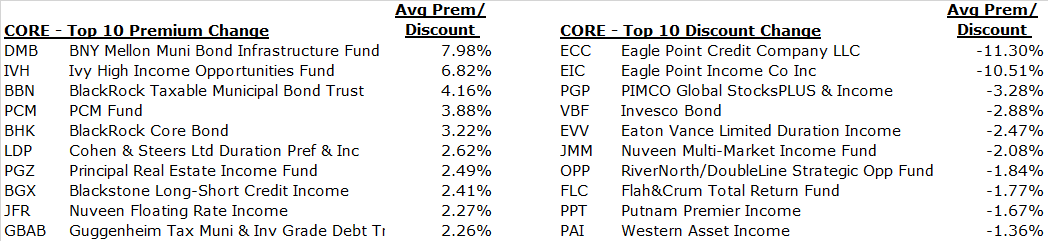
The Eagle Point funds saw a big drop in their premiums from the monthly NAV posting. For instance, ECCs NAV went from $10.08 on 6/30 to $10.84 on 7/31, or an increase of 7.5%. That lowered the premium nicely as indicated on the table above.
I would point out Invesco Bond Fund (VBF), which is an unleveraged core bond fund with average coupon of 4.38% and discounted bond price. This is a great substitute for a traditional open-end core bond fund (like PGIM Total Return, Guggenheim Total Return, or Fidelity Total Bond among many more). That is because you get a better portfolio yield thanks to the capital being closed (no internal cash flows within the fund) and the discount. That discount is now over -5% which has traditionally been a good entry point.
RiverNorth/DoubleLine Strategic Opp (OPP) lost about -2% of its premium thanks to the rights offering that they announced. This is something done almost annually to replenish their assets. The fund massively over-distributes which means that the part of the distribution that is not earned has to come from the NAV, cannibalizing that down. Eventually, it will need to be replenished or their fee revenue will fall too much.
As we referenced in our Morning Note, this is not something to sell about. We think the shares will trade around a -2% discount for the time being and then recover back to a +2% premium.
We also saw a couple more floating rate funds raise their distribution. We noted that Ares Dynamic Credit Allocation (ARDC) increased the distribution by 5% last week. That helps to rally the hares a bit but I still think it is a decent value here.
We also had Eagle Point Income Co. (EIC) raise their distribution by 12%. This is the second large increase in the last year with the boost last October amounting to 33%.
These two funds, along with Western Asset Diversified Income (WDI), which raised by 4.2%, have large floating rate loan portfolios. As the Fed boost short-term rates, these funds earn more offsetting the impact that we discussed above where borrowing costs increase reducing the net portfolio yield.
This is why we have focused on that area all year – though been cognizant of the risks of these entering a recession. The CEF Report, posted last week, lays out our case for holding a portfolio of investment grade, preferreds, and loans in the taxable space, along with munis to provide a high-quality ‘hedge’ against the potential for market volatility and weakness into year-end.
Funds we like here in taxables:
- Western Asset Div Inc (WDI), discount -9.1%, yield 9.8%
- Ares Dynamic Credit Allocation (ARDC), discount 8.5%, yield 8.7%
- Cohen & Steers Tax-Advantaged Preferred Securities & Income (PTA), discount -7.9%, yield 7.8%
- Invesco Bond Fund (VBF), discount -5.4%, yield 4.4%
- XAI Octagon FR & Alt Inc (XFLT), premium +4.1%, yield 12.12%
Commentary
I took the opportunity to start to trim some gains I’ve made in my small cap and tech stock gains. I noted a few months ago about going long small caps in a big way. I emphasized it more recently in the last couple of monthly letters as well. I discussed even using a 2x leveraged ETF which I would rarely ever do let alone recommend on this service. But there was a very compelling opportunity.
I used the ProShares Ultra SmallCap 600 (SAA) which mimics the S&P 600 Small Cap index but attempts to achieve 2X the daily change in value of that index.
In the last month alone, SAA is up nearly 30%. Yes, you read that correctly.
ycharts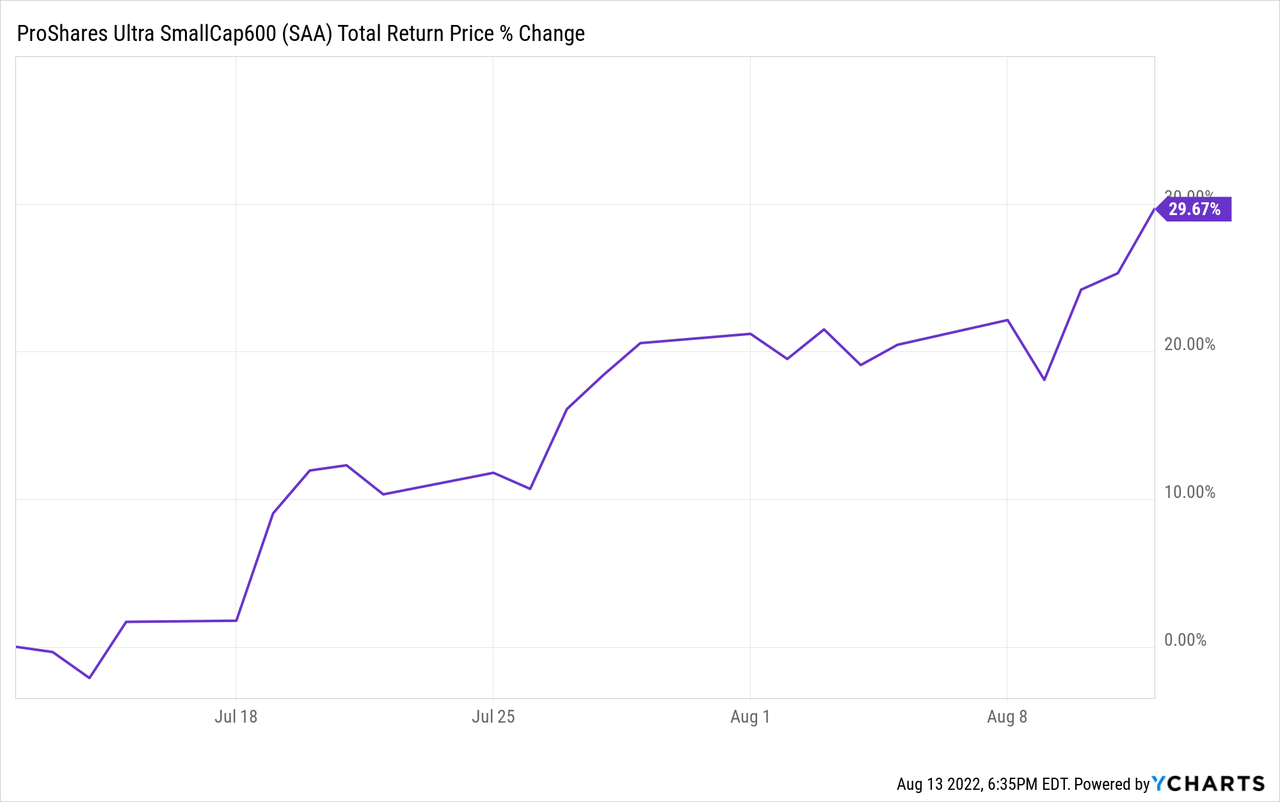
I took a chunk of those gains off the table (about one-third of my position) and rotated into short-term debt investments.
We also discussed the iShares iBoxx $ Investment Grade Corporate Bond Index (LQD), which at the time was yielding just over 4.0%. Today, that yield has increased to nearly 4.7%. At the same time, the price return of the ETF has been strong as well. We first mentioned it in our Morning Note | May 18, 2022 where we wrote:
I would continue to be positioned for more downside here and, if you need income, stay in higher quality like investment grade. The iShares iBoxx Investment Grade Corporate Bond ETF (LQD) is now yielding close to 4% (taxable). This is unleveraged and has no discount risk if you want to keep the risks lower compared to a closed-end fund.
And then again in our Weekly Commentary | May 22, 2022 where we discussed going higher quality because they were down more than high yield bonds were at the time:
The iShares iBoxx Investment Grade Corporate Bond ETF (LQD) was one of the tools I mentioned as the SEC yield is now over 4.3%. That is because investment grade spreads have widened out but more directly, because interest rates have moved sharply higher. IG bonds are a high quality, high-duration asset so they are more affected by interest rate changes rather than the credit environment (though both can affect them).
I didn’t think the risk taken in lower quality was worth it if you could get a similar ‘value’ in LQD, an investment grade bond ETF. Why go junky if you don’t have to?
Since then, the two markets are up with high yield slightly outperforming thanks to spreads coming in strongly. But if we see a reversal in the risk markets and people move defensive again, with spreads going back out towards 6.0%, then LQD will significantly outperform.
We think it could be time to start thinking about taking some gains and reducing risk once more. While we have been positioned defensively for some time, we have been mostly invested. Instead of reinvesting CEF coupons, I’ll likely be taking most as cash and stockpiling.
I have also reduced some of my equity risk (as I noted above) and, if we continue to see markets move up, will further reduce it as we get into September.
I just want to be VERY CLEAR. I’m never going to reduce equity exposure to zero. In fact, it won’t ever get below my minimum of 25% (maximum is 50%). In addition to that, I have an income bucket that does have, from time to time, income-oriented equity positions like higher-yielding REITs, dividend stocks, and other assets that don’t fit in the equity/growth bucket, and are clearly not bonds.
This is a tactical decision for me to reduce my risk going into the last quarter of the year. We’ve made back most of what we have lost this year – helped significantly by the SAA ETF position discussed earlier. I’ll continue to hold those and participate in further gains as they occur but will be dialing back the risk as early as starting next week.
In CEFs, that means entering the occasional ‘dream sell’ limit orders to see if I can get lifted. That doesn’t mean I won’t reinvest proceeds if those limits get hit or won’t buy anything without a corresponding sell. I will just be very cognizant of my overall risk exposure, especially within the taxable bond CEF space given the valuations in that space.
CEF News and Corporate Actions
Distribution Increase
Tortoise Energy Independence (NDP): Distribution increase of 16.7% to $0.56 per quarter.
Destra Multi-Alternative (DMA): Distribution increase of 2.1% to $0.0572
Distribution Decrease
Aberdeen Australia Equity (IAF): Distribution decrease of 13.3% to $0.13
India Fund (IFN): Distribution decreased of 13.2% to $0.46
Aberdeen Japan Equity (JEQ): Distribution decreased by 8.3% to $0.11.
Tender Offer
Tortoise Funds – TYG, NTG, TTP, NDP, and TPZ: The funds’ board approved a 5% tender offer as part of their discount management program. The tender will be done at 98% of NAV, or a -2% discount.
-
- The first measurement period for 2022 ended on July 31, 2022 and it has been determined that a tender offer will be executed in each fund. The tender offers are expected to commence on or around October 3, 2022. The Funds will issue a press release announcing the tender offers on the day the tenders commence. The Funds’ portfolio managers, officers and Board of Directors will not tender their shares. The second conditional tender offer measurement period is from August 1, 2022 through July 31, 2023.
Statistics
Sectors:
Alpha Gen Capital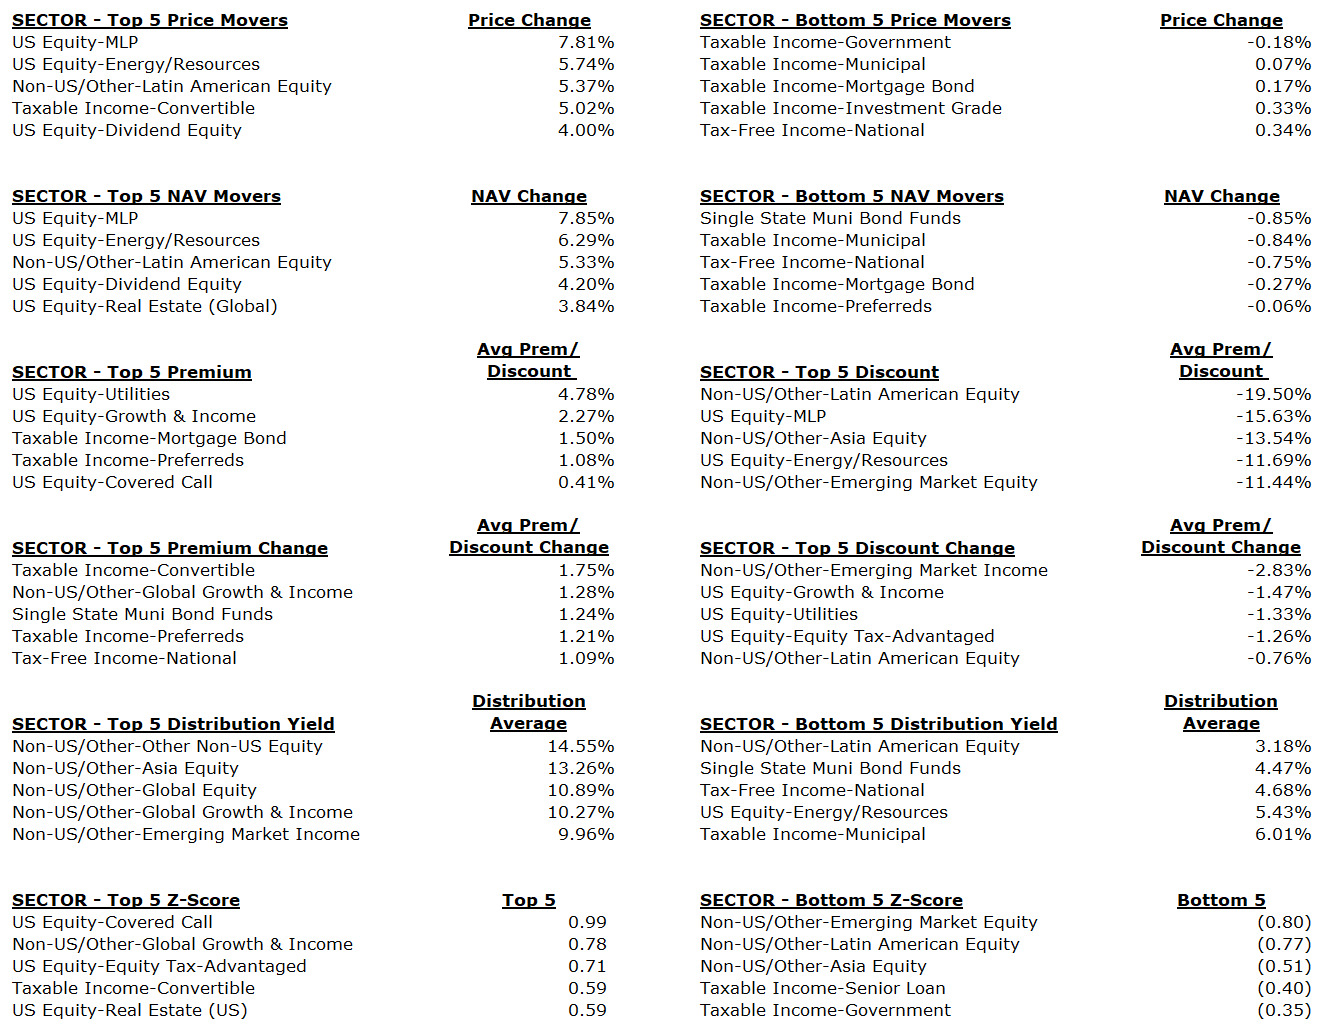
Core:
Alpha Gen Capital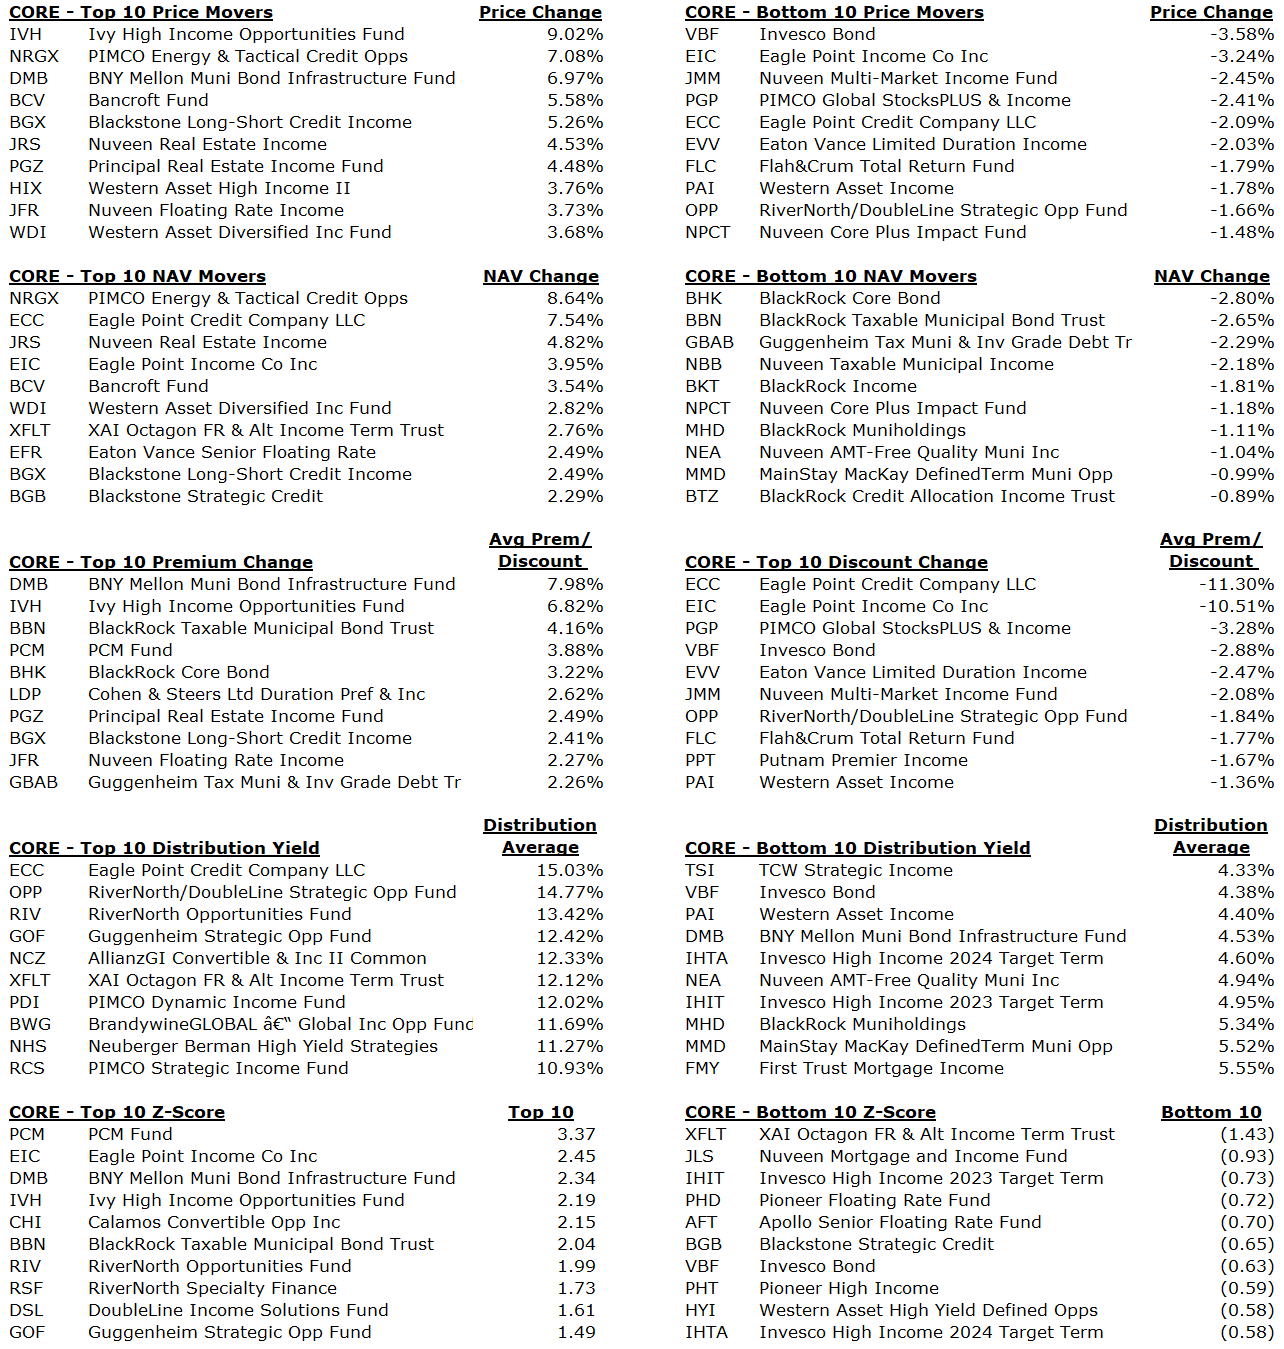
All CEFs:
Alpha Gen Capital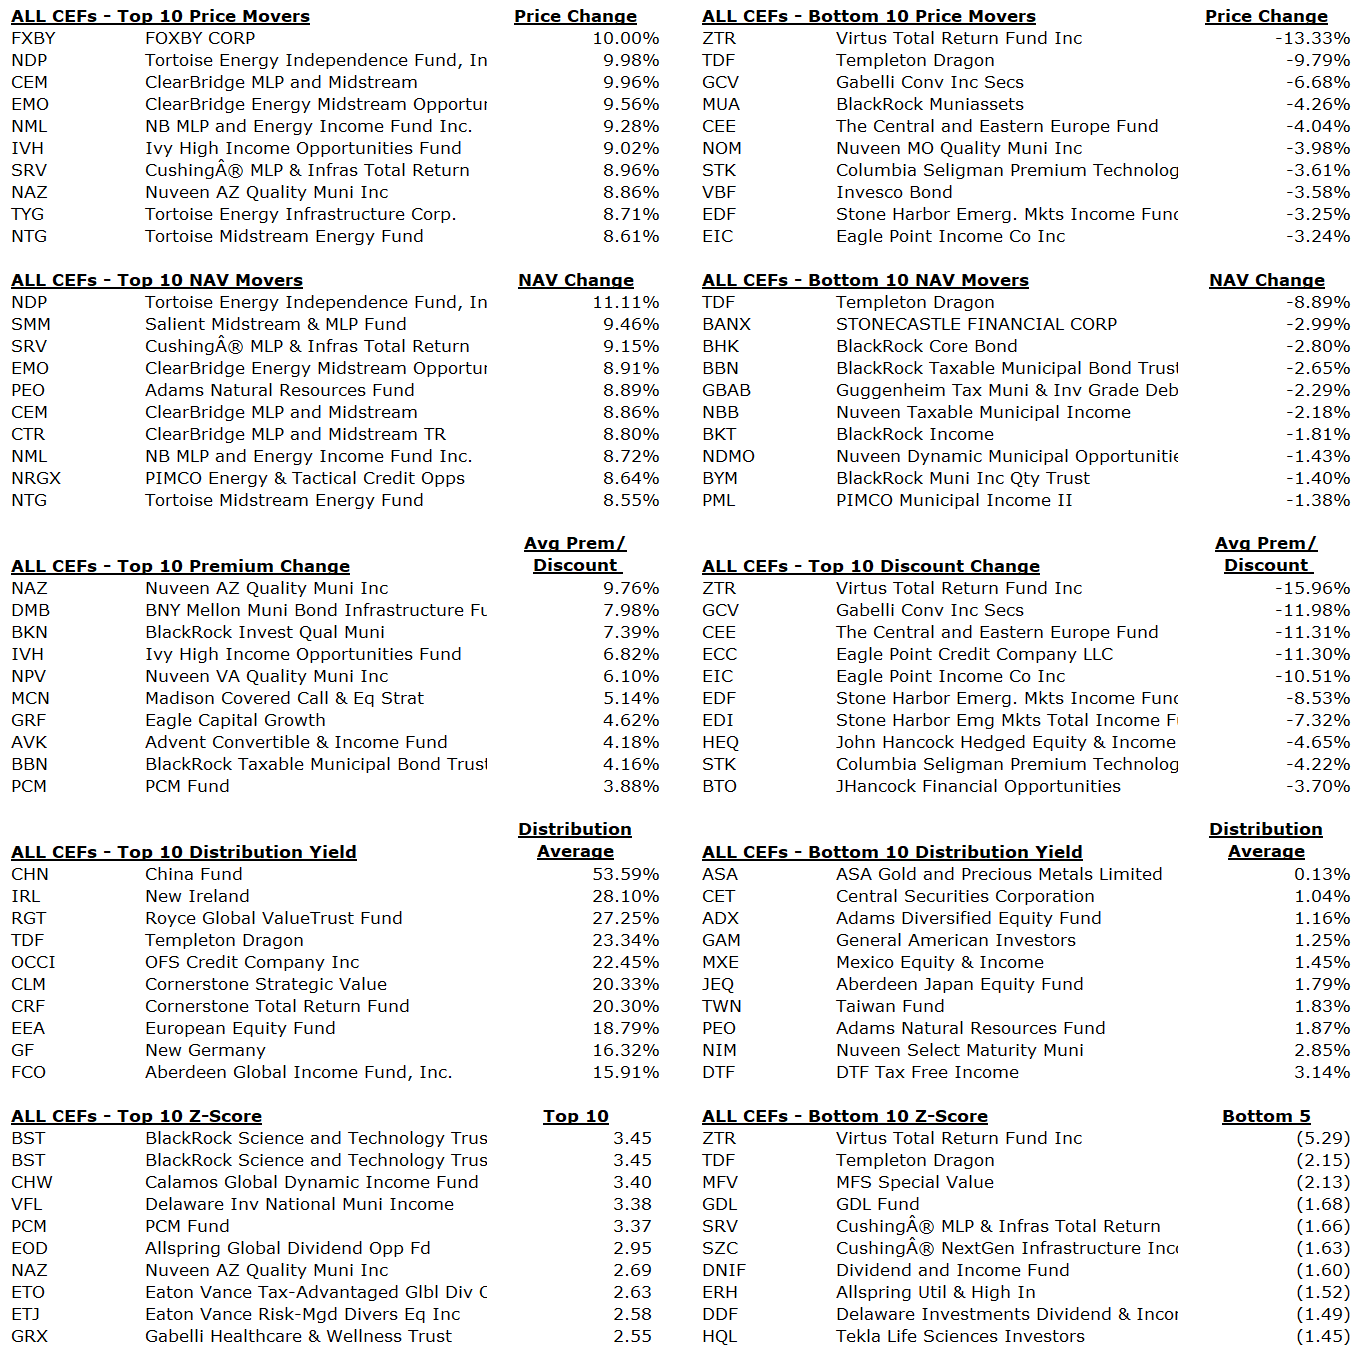
—————–
Be the first to comment