

piranka
The iShares Exponential Technologies ETF (NASDAQ:XT) offers targeted exposure to the leading technology themes that are transforming the global economy, with a nicely diversified portfolio of 195 U.S. and international stocks in the current version. XT comes with a modest expense ratio of 46 bps.
Today, I would like to take a closer look at the vehicle’s investment strategy, past performance, as well as its likely drivers, and current factor exposure to arrive at a balanced conclusion of whether the current price is comfortable enough to initiate the coverage with a Buy rating.
XT investment strategy
In my view, XT would not appeal to maximalist growth investors who are on the lookout for top-notch stories. Instead, it is more of an option for those seeking breadth and depth of exposure. This secures adequate diversification, and, hence, lower downsides in the market scenarios similar to the one that has played out this year.
XT is managed passively, with the Morningstar Exponential Technologies Index lying at the crux of its strategy. The Morningstar Global Markets Index is the selection universe, which means investors should be prepared for FX risks stemming from exposure to both developed and emerging markets.
First and foremost, potential constituents must meet certain liquidity requirements. Those that passed the liquidity and market-cap test proceed to step two.
The Morningstar analysts perform an in-depth analysis assessing whether a stock has exposure to the nine themes, namely big data & analytics, cloud computing, energy transition, fintech innovation, healthcare innovation, hyperconnectivity, nanotechnology, next gen transportation, and robotics.
Parameters considered are net income and revenues; specifically, it is analyzed whether exposure to a certain theme will engender substantial net income growth, and what % of revenues in five years a candidate will generate thanks to exposure to the specific theme. More details on the methodology can be found on the index provider’s website in the respective documents.
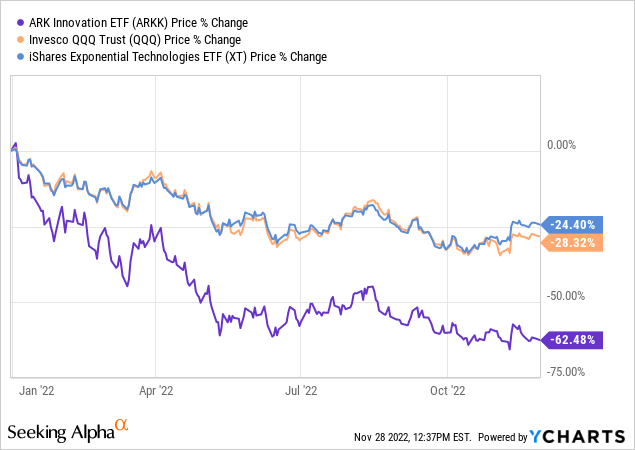
Only 200 stocks can qualify. Constituents are weighted equally. No, this does not immediately tilt the portfolio strongly towards the value factor, yet the schema still offers a layer of safety that has likely protected XT against a much steeper decline this year. At least, it has outperformed the embattled ARK Innovation ETF (ARKK), and grossly, also managing to slightly outpace the Invesco QQQ ETF (QQQ).
Also, looking at a valuation of the U.S. portion of the portfolio, I noticed a slightly surprising issue. There are reasons to consider this to be the consequence of the smart-beta ingredient. More on that is below in the note.
As of November 25, there were 195 stocks in the XT portfolio. Thanks to the weighting schema of the index, XT has just 10.1% allocated to the ten major holdings, which is a tailwind for its Risk profile. Besides, tracking errors are below the medians, which is worth appreciating.
The key investment at this point is CF Industries Holdings (CF), a $21.1 billion company with a 1.2% weight in the fund. Adequately priced and grossly profitable, by the materials sector standards. CF is a fertilizers & agricultural chemicals company that looks a bit alien in an exponential tech portfolio, yet only for those investors who are unaware of its vast hydrogen operations, which likely allowed it to qualify for inclusion together with other energy transition players like First Solar (FSLR), XT’s second-largest position with a ~1.15% weight. The difference here is that CF fits into the Hydrogen sub-theme, while FSLR represents Renewable Energy.
FX risks are worth addressing separately. U.S. stocks account for just ~62% of the fund, with the rest of the portfolio directly exposed to the repercussions of the strengthening USD. In fact, the greenback’s rally supercharged by the Fed’s actions has already taken its toll on XT via its yen, pound sterling, euro, etc. denominated investments. At this point, I do not have a strong Long USD/Short every other major currency thesis, yet the risk is still not the one to ignore, especially in case inflation surprises to the upside again.
As I said above, equal weighting is supportive of cheaper valuation and a larger margin of safety overall. Analyzing the U.S. portion of the portfolio, I found out that about 7% of the holdings have a B- Valuation grade or better, a poor result, yet somewhat surprising for a growth tech play. Meanwhile, close to 45% are relatively overvalued (a D+ grade and worse). For context, this also means that the median Enterprise Value/Sales in the group is at 5x, not a level I would call totally comfortable, especially since the median forward revenue growth in the group (negative rates included) is only at 12.3%.
Besides, the fund’s website shows a P/E of 21.4x as of writing this article. This is above IVV’s 19.4x, which might hint XT investors are paying only a slight premium for growth, yet please keep in mind that lower P/E is partly the consequence of the stronger USD and weaker Japanese yen, British pound sterling, euro, Indian rupee, Chilean peso, etc.
In the meantime, it is worth noting that XT’s quality characteristics are passable, with 92 names (51% of the net assets) in the selected group boasting a B- Quant Profitability grade and better); only 3% have weak margins and inadequate capital efficiency.
Performance
2022 has been nothing short of painful for “disruptive,” “exponential,” and other overhyped, overpriced growth themes carrying solid expectations premia (hence, a room for multiples to contract, and fast), with XT being no exception, yet after a fashion.
As I said above, the equal-weight schema has somewhat immunized it against the headwinds, so its decline appeared to be way less dismal compared to other plays from the segment, like ARKK and the Goldman Sachs Future Tech Leaders Equity ETF (GTEK); its price return is also better compared to the SPDR S&P Kensho New Economies Composite ETF (KOMP) and ALPS Disruptive Technologies ETF (DTEC).
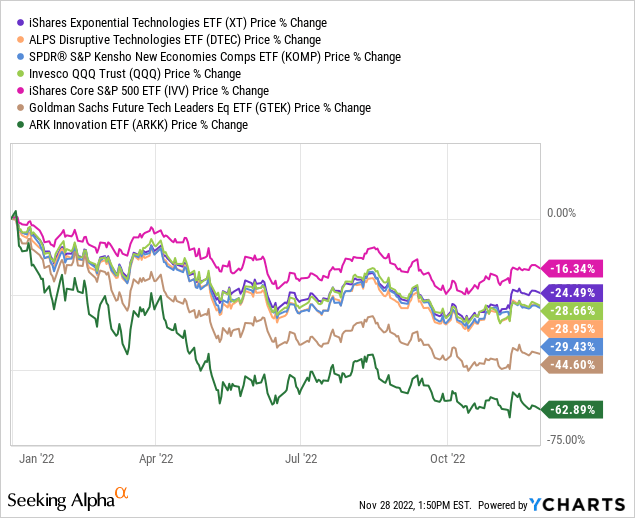
Of course, the iShares Core S&P 500 ETF (IVV) has fared far better as its exposure to pure value has been keeping it afloat (comparatively).
Overall, the returns data since XT’s inception (April 2015 – October 2022) is mixed. It failed to outperform IVV and QQQ but delivered a slightly better CAGR compared to the embattled ARKK (which had a 152.8% return in 2020). Its standard deviation below QQQ’s is also an advantage. Again, this is the likely consequence of equal weighting.
| Portfolio | XT | QQQ | IVV | ARKK |
| Initial Balance | $ 10,000 | $ 10,000 | $ 10,000 | $ 10,000 |
| Final Balance | $20,357 | $27,953 | $21,544 | $20,201 |
| CAGR | 9.83% | 14.52% | 10.65% | 9.72% |
| Stdev | 16.88% | 18.97% | 15.91% | 33.84% |
| Best Year | 35.09% | 48.40% | 31.25% | 152.82% |
| Worst Year | -28.45% | -29.79% | -17.75% | -59.53% |
| Max. Drawdown | -32.25% | -32.49% | -23.93% | -72.32% |
| Sharpe Ratio | 0.59 | 0.76 | 0.66 | 0.42 |
| Sortino Ratio | 0.86 | 1.22 | 1 | 0.65 |
| Market Correlation | 0.96 | 0.92 | 1 | 0.76 |
Final thoughts
XT is a smart-beta exponential tech fund with a comparatively significant trading history (about 7.5 years) being amongst the longest in the thematic technology ETFs league.
Longer-term, I am positive about the themes XT aggregates, yet tactically, there is a lot to be desired.
The facts and observations discussed above are insufficient for a Buy rating, yet there are also not enough reasons to short the fund. The key argument not to bet against exponential tech via XT is its only moderate overvaluation together with quality being adequate enough.
Please keep in mind that the FX risks are somewhat lower now, yet we cannot ignore the possibility of the yen, euro, pound sterling, etc. experiencing volatility, with the potential to retest 2022 lows.
Be the first to comment