

PonyWang
The SPDR S&P Semiconductor ETF (NYSEARCA:XSD) is an exchange-traded fund managed by State Street Global Advisors; part of their SPDR family of funds, enabling investors to get direct exposure to the S&P Semiconductor Select Industry Index. This index represents XSD’s benchmark, whose performance it seeks to replicate by investing in the index’s constituents.
I previously covered XSD in an article published on June 28, 2022, in which I was generally bullish on the basis of valuation. Since then, according to Seeking Alpha data as of the time of writing, XSD has out-performed the S&P 500 index (6.86% positive, vs. 3.94%). I thought XSD was undervalued given that even a hit to earnings (not in consensus estimates) would produce a reasonably good IRR in the region of 8-12% per annum region.
XSD had assets under management of $1.086 billion as of September 8, 2022, and that follows positive net fund flows over the past year of about $265 million (see below).
ETFDB.com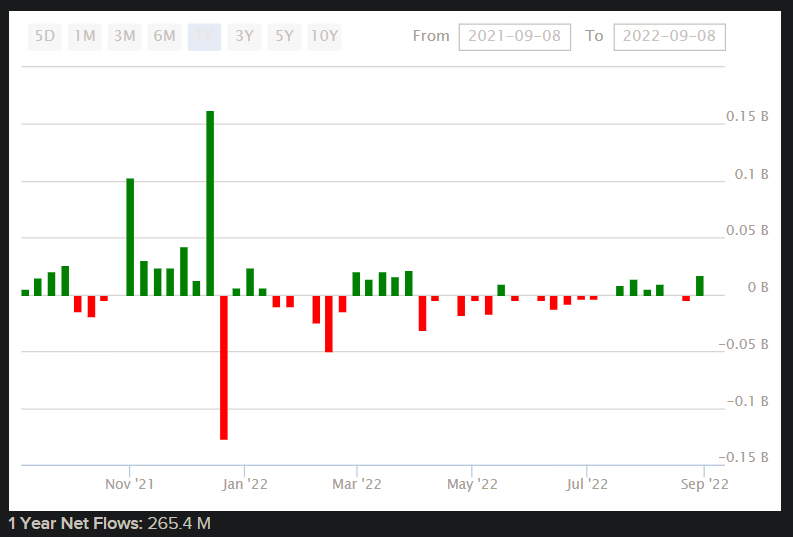
Semiconductors have become increasingly important across the global economy, particularly for durable consumer goods (including cars and computers). The more sophisticated technology has become, the more in-demand semiconductors have become.
Some of the most critical global semiconductor companies are not based in the United States, with one such example being TSMC (TSM) based in Taiwan. XSD’s benchmark index from S&P Dow Jones Indices, referenced earlier, is exposed only to the United States. So, XSD misses out several key international players in this industry, another being Samsung (OTCPK:SSNLF).
XSD is basically a macro play on the United States’ semiconductors industry. Like any other ETF, you can fairly quickly gauge valuation, but it is worth reviewing periodically given that share prices move and thus the composition of the portfolio (not to mention consensus earnings) can move too. Markets can also move in ways that can produce signals. To begin with, let’s look at the present valuation; my preference is to use the benchmark index’s most recent factsheet (i.e., from S&P, in this case). S&P’s numbers are good because they are generally not (favorably) adjusted for interest, taxes, and other items.
The most recent factsheet indicates trailing and forward price/earnings ratios of 24.17x and 19.13x, respectively (as of August 31, 2022), with a price/book ratio of 3.77x. That suggests a forward return on equity of 19.7%. We can also see an indicative dividend yield of 0.64%, which would suggest a distribution rate of profits of circa 15%. Assuming no buybacks on a forward basis, and a return on equity that trails off to about 15%, we would arrive at a three- to five-year average earnings growth rate of 12.7-15.6%. That compares to Morningstar‘s current consensus estimate of 12.18%.
On this basis, and assuming a risk-free rate of about 4% (actually higher than the current U.S. 10-year or indeed 20-year yield), I arrive at an implied IRR (on total earnings power) of just under 14%, with a large equity risk premium of 9.94%, in spite of historical beta (for XSD) of 1.38x. Adjusted for beta, the ERP of almost 10% becomes about 7.2%, which is still much higher than a fair value range of 4.2-5.5% for U.S. equities.
Author’s Calculations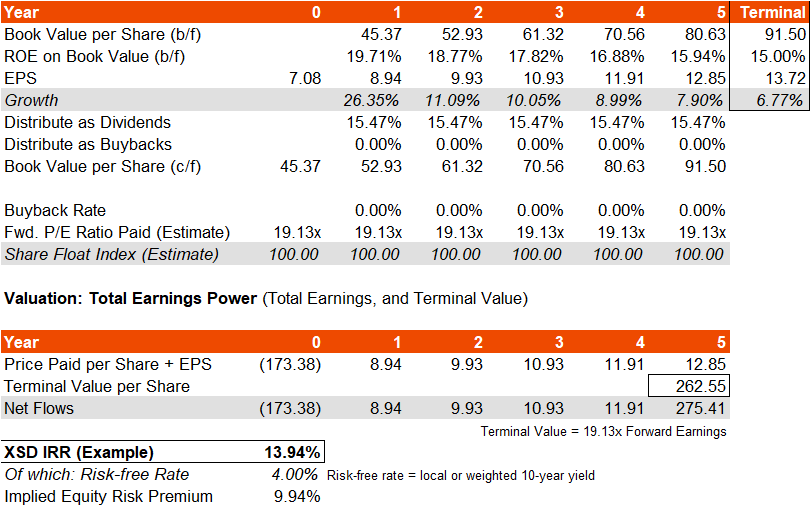
I used a very similar ROE basis (to 15%) in my previous analysis. Previously I found a headline IRR of over 16%. The price of XSD shares has risen since then, hence the IRR is lower. Nevertheless, an IRR of circa 14% per year for five years is still extremely good.
The forward price/earnings ratio is also kept constant in my analysis. Before assuming under-valuation, it is worth de-constructing this ratio in case we could expect to see a drop-off in the forward earnings multiple (even if gradually over five years). In my analysis I used a risk-free rate of 4% just to be conservative, in case we see higher U.S. yields in the near term. However, the current U.S. 10-year yield is actually 3.32% at the time of writing. Assuming a 5.5% equity risk premium, and a 3.32% risk-free rate, plus 1.38x beta for XSD (increasing our ERP), I arrive at a maximum discount rate of 10.91%.
If we then assume long-term earnings growth at the rate of at least 3.45% (the current U.S. 30-year yield; long-term yields are generally thought to correlate strongly with long-term nominal GDP growth rates), that results in a growth-adjusted discount rate of 7.46%. Dividing 1 over this figure provides an indicative forward price/earnings ratio of 13.40x.
Interestingly in my previous analysis, the forward price/earnings ratio was 22.06x (the prevailing earnings multiple), and now it is 19.13x. So, the market has already repriced XSD lower on the basis of forecasted earnings power. This does not seem to have happened due to a rising equity risk premium, since my analysis would suggest that if anything the ERP has tightened (in line with the rising XSD share price, which makes sense). Changing XSD portfolio composition together with changing consensus earnings assumptions (from S&P data) can result in a lower forward price/earnings multiple, in spite of a rising XSD share price, perhaps making XSD look deceptively cheaper.
However, over the longer run, it is possible that my (even cheaper) indicative multiple of 13.40x could arrive. The point is, as earnings growth among XSD’s portfolio beats the broader economy, there is likely to be less future out-performance potential (companies cannot out-perform forever ad infinitum, by definition, or they would one day take over the entire economy). As XSD’s portfolio’s earnings growth rate matures further over time, the forward price/earnings multiple should move toward a more mature multiple.
It is improbable that XSD will mature fully within five years (less than one typical economic cycle), given the technological sophistication of (and demand for) the broader semiconductors industry. But a multiple of 16-17x could certainly prevail over the next few years, which would leave XSD with a lower IRR (keeping my other assumptions constant) of 10.50-11.65%. This would create a beta-adjusted ERP much closer to what we might consider fair.
However that is another point: the beta for the fund would also likely fall over time. Therefore, higher-than-average returns are still likely for XSD shareholders over the next few years, based on the fund’s higher-than-average earnings growth and likely forward compression in long-term volatility. Shareholders should essentially be able to capture the higher underlying equity risk premium as the industry matures. However, do not expect the earnings multiple to hold forever; I would expect a gradual and continued re-rating downward on forward earnings.
As a long-term hold, XSD seems like a good, safe bet as part of a larger diversified portfolio. I would place XSD between the broader S&P 500 U.S. equity index and technology stocks; XSD’s portfolio probably will not scale like tech stock portfolios that can grow quickly without large capital expenditures. Returns on equity are therefore likely to moderate across the portfolio companies, and therefore long-term returns may under-cut pure-play tech funds like Invesco QQQ Trust Series 1 (QQQ) as an example.
Also, in the current (mostly risk-off) environment, it is possible that XSD will decline further. XSD suffers like the rest of the market from higher energy and commodities prices; while those that correlate positively with economic growth, they are currently driving stagflationary (supply-side) pressures, which are tougher on manufacturing companies than say, software companies. Having said that, should inflationary pressures ease off, XSD has the potential to beat even funds like QQQ (in the short term).
Be the first to comment