

pinglabel/iStock via Getty Images
Introduction
On February 11, I wrote an article titled “Why Climate Change Makes XME A Strong Buy.” The article covered the SPDR S&P Metals and Mining ETF (NYSEARCA:XME), based on accelerating demand for metals used in renewable technologies and related. It also covered supply problems in a market that desperately needs higher supply. In the weeks after my article, the ETF soared almost 40% in a rally that beat my most optimistic estimates.
Now, the price is back to where it was back then as the ongoing market rout has caused investors to worry about the demand side of the supply versus demand debate. In this article, I’m going to explain why I’m still bullish based on the supply side of commodities. If anything, the bull case is getting stronger as miners – just like their oil & gas peers – are unwilling/unable to boost production. It’s a toxic mix in an already inflationary environment. Historically speaking, this benefits commodities.
Barchart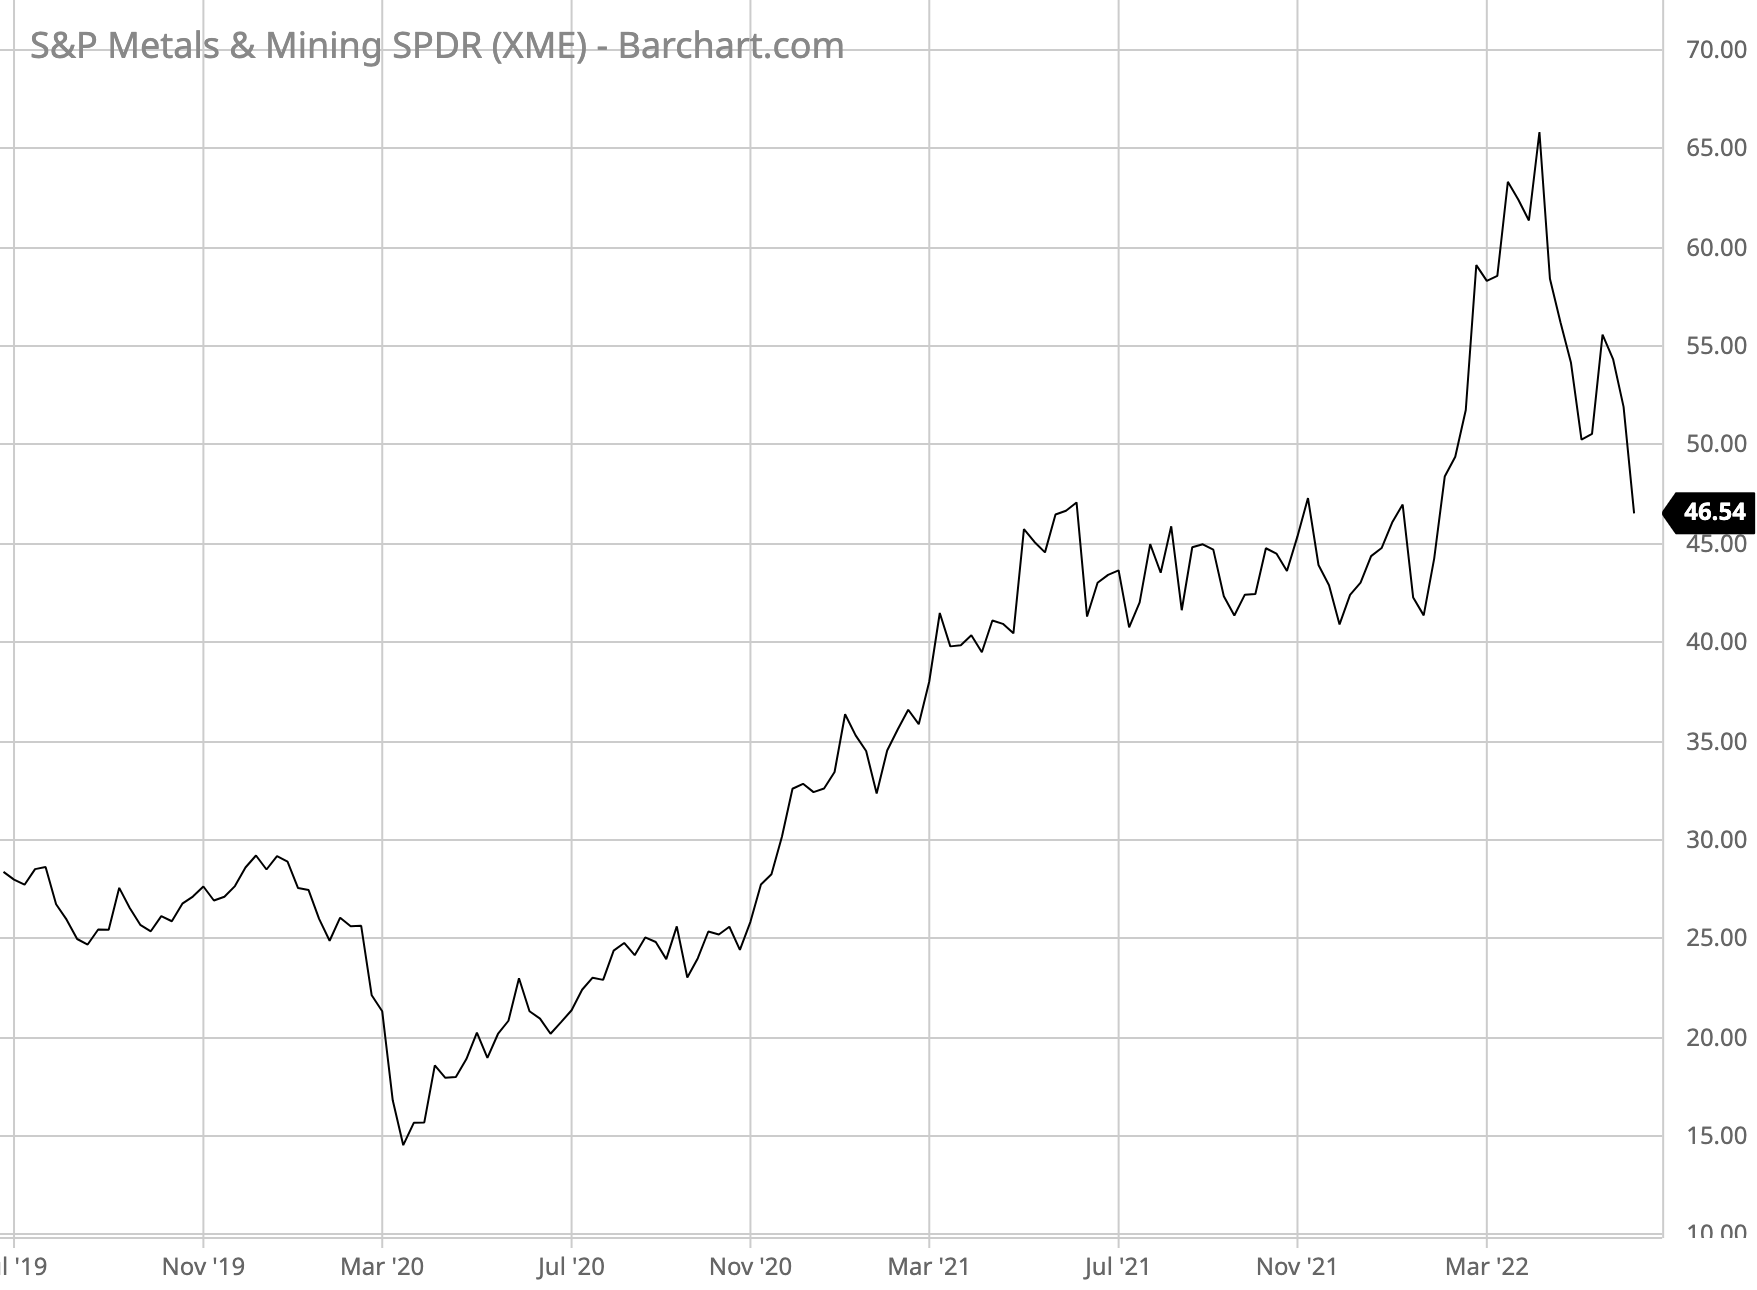
So, let’s look at the details.
It’s All About Supply
The situation in the mining space is similar to the one in the oil and gas industry. I discussed both oil and gas in separate articles this month, that I think readers interested in the commodity supply side will enjoy:
- Article 1: Oil – using Exxon Mobil (XOM) as an example.
- Article 2: Natural gas – comparing supply to demand.
Thanks to Mining.com, I have a chart that combines all resources.
Mining.com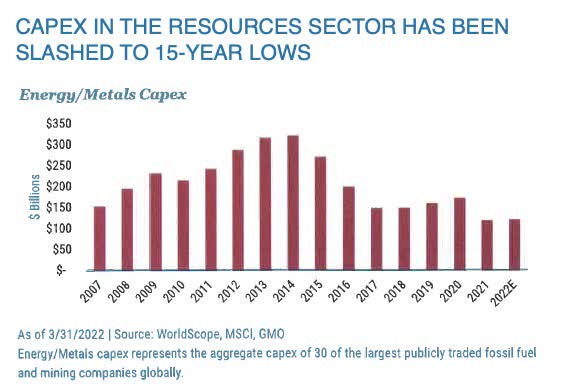
Combining capital expenditure plans from large companies in oil and metals mining, we see a 15-year low despite a 40% rise in global commodity consumption during that period.
According to the website (emphasis added):
Underinvestment in supply in recent years will impact production for at least the next decade. Over most of the last decade, commodity prices have been falling or low. Commodity producers, reacting to low prices and criticism that they had overinvested during the China-driven commodity supercycle, slashed capex significantly.
Moreover, the report blames pressure from ESG/sustainability circles and divestment campaigns that also look to starve oil companies of capital.
When COVID hit, companies further cut CapEx as the chart above shows to deal with uncertainty.
And, to make things worse, mining has become more capital intensive as it is harder to get quality commodities. This is making the supply issue even worse.
Based on this context, the Wall Street Journal ran an interesting headline the other day:
Wall Street Journal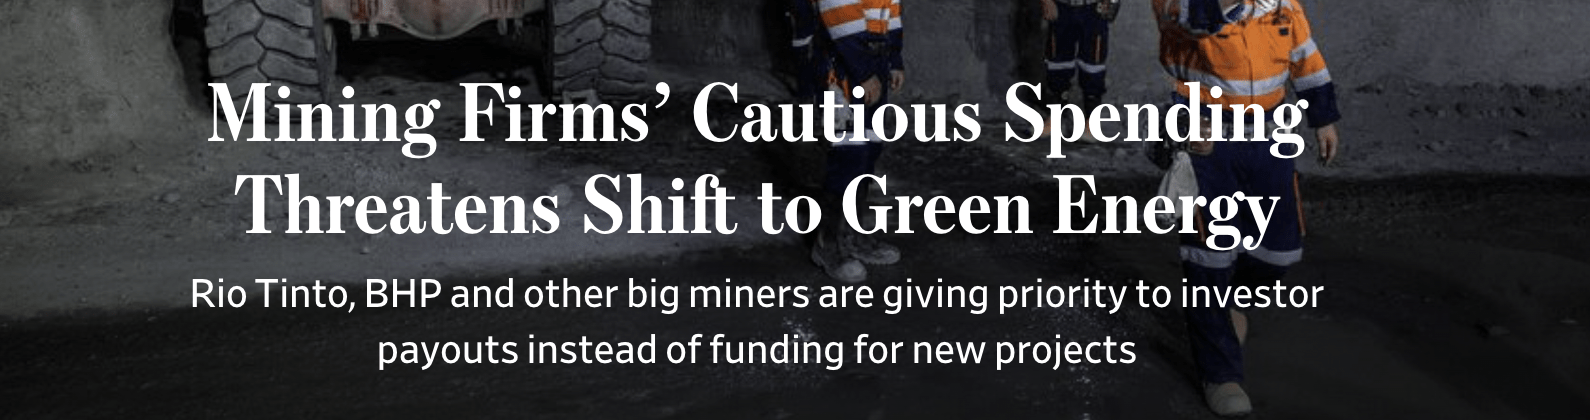
The paper reports that:
Producers have taken some steps to increase the supply of specialty materials such as lithium and cobalt that are crucial ingredients in batteries, but not enough to fill expected shortages.
Despite seeing some of their highest profits in a decade, many mining executives are cautious because of rising costs for fuel and equipment, higher interest rates and challenges developing deposits in emerging markets that are seeking a greater share of industry earnings.
Wall Street Journal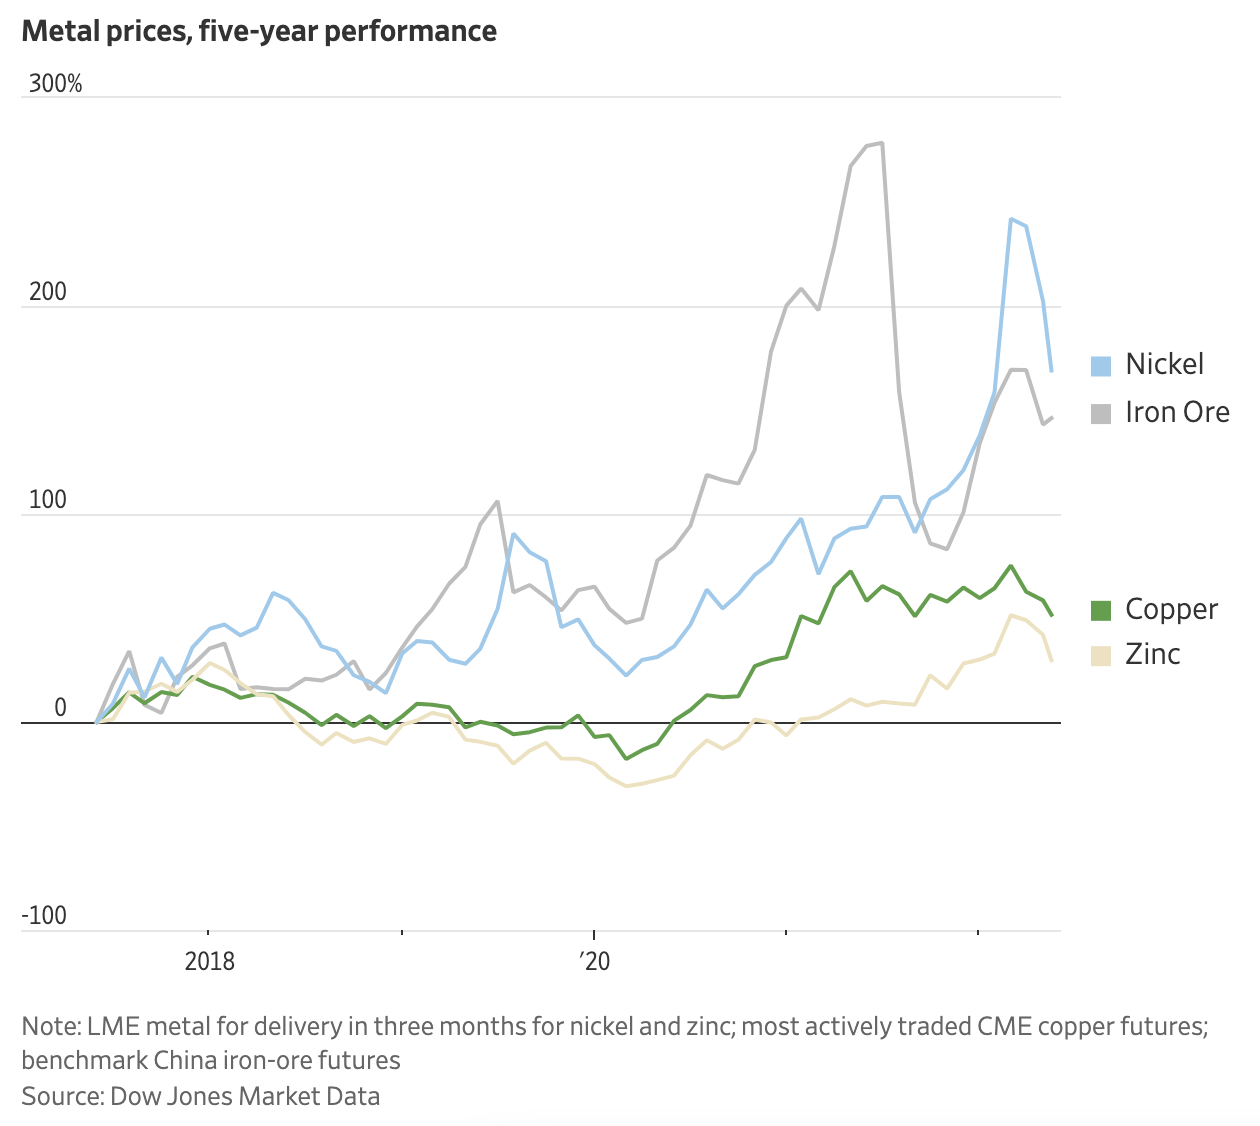
Moreover, I want to add another quote (from the same WSJ article) from a copper producer’s point of view:
“Things are just piling up that are adding to the supply constraints,” Richard Adkerson, chief executive of copper miner Freeport-McMoRan Inc., said on the company’s most recent earnings call. Much of Freeport’s spending is for a copper and gold mine in Indonesia, but the company recently projected that capital expenditures would fall in 2023. Freeport recently started a more aggressive buyback and dividend program.
The following chart goes well with it. And to be honest, seeing the visualization of what supply and demand could look like in a net-zero scenario is mind-blowing.
Wall Street Journal
Kitco News reports that the mining industry needs to spend $81 billion annually to 2030 just to avoid shortages to achieve net-zero. These estimates do not include any estimates of rising demand from consumers – and one can imagine what a rising middle-class in emerging markets means for metals demand.
According to Kitco:
“The UN estimates the adaption costs at $140-300BN pa by 2030 in developing countries alone. Based on the mining CAPEX required to achieve Net Zero, although this may simplify it a bit, the return on that investment could be somewhere between +94-317%,” the authors of the report said.
With that said, XME is a great way to trade commodities.
The XME ETF Makes Sense
There are a lot of ways to benefit from this bull case. One of them is by buying an ETF that reduces individual stock risks and the need to pick potential winners.
The SPDR S&P Metals & Mining ETF is the largest mining ETF with $2.4 billion in assets under management.
According to SPDR, a State Street company:
- “The SPDR® S&P® Metals & Mining ETF seeks to provide investment results that, before fees and expenses, correspond generally to the total return performance of the S&P® Metals and Mining Select Industry® Index (the “Index”)
- Seeks to provide exposure to the metals & mining segment of the S&P TMI, which comprises the following sub-industries: Aluminum, Coal & Consumable Fuels, Copper, Diversified Metals & Mining, Gold, Precious Metals & Minerals, Silver, and Steel”
Established in 2006, the ETF has an expense ratio of 0.35. That’s reasonable. A lot of U.S.-based index funds have an expense ratio of 0.02% to 0.10%. European index funds often cost close to 0.2%-0.3%. Specialized or niche ETFs are more expensive. Additionally, this ETF is a distributing ETF, meaning it pays a dividend. Unfortunately, the yield is roughly 0.6%, which isn’t something that attracts dividend investors – and that’s not the point of this article.
With that said, the fund maintains an equal weight structure, meaning there are no heavyweights in the ETF that have a big influence on the price of the ETF. In total, this ETF has 33 holdings. All of them are listed in the United States.
Roughly 42% of total exposure is invested in steel stocks followed by coal, aluminum, gold, diversified materials, silver, and copper.
SPDR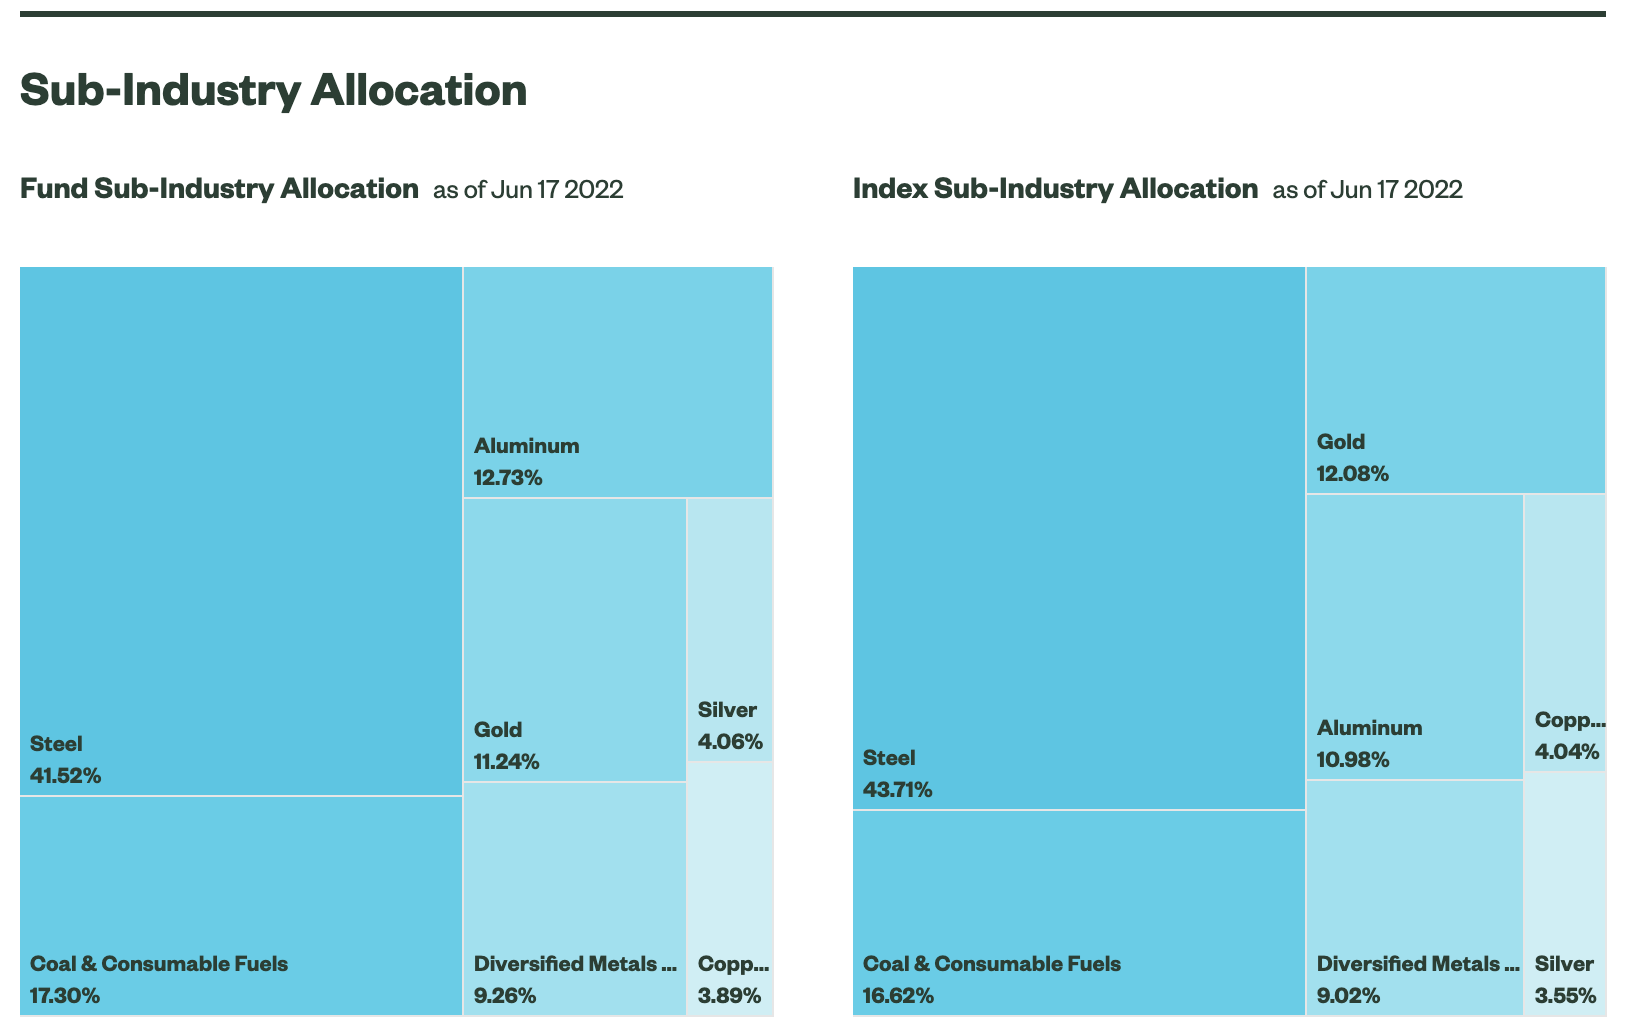
The fund’s top holdings can be seen below. If you want a full list of all 33 holdings, please use the download option on the SPDR website.
SPDR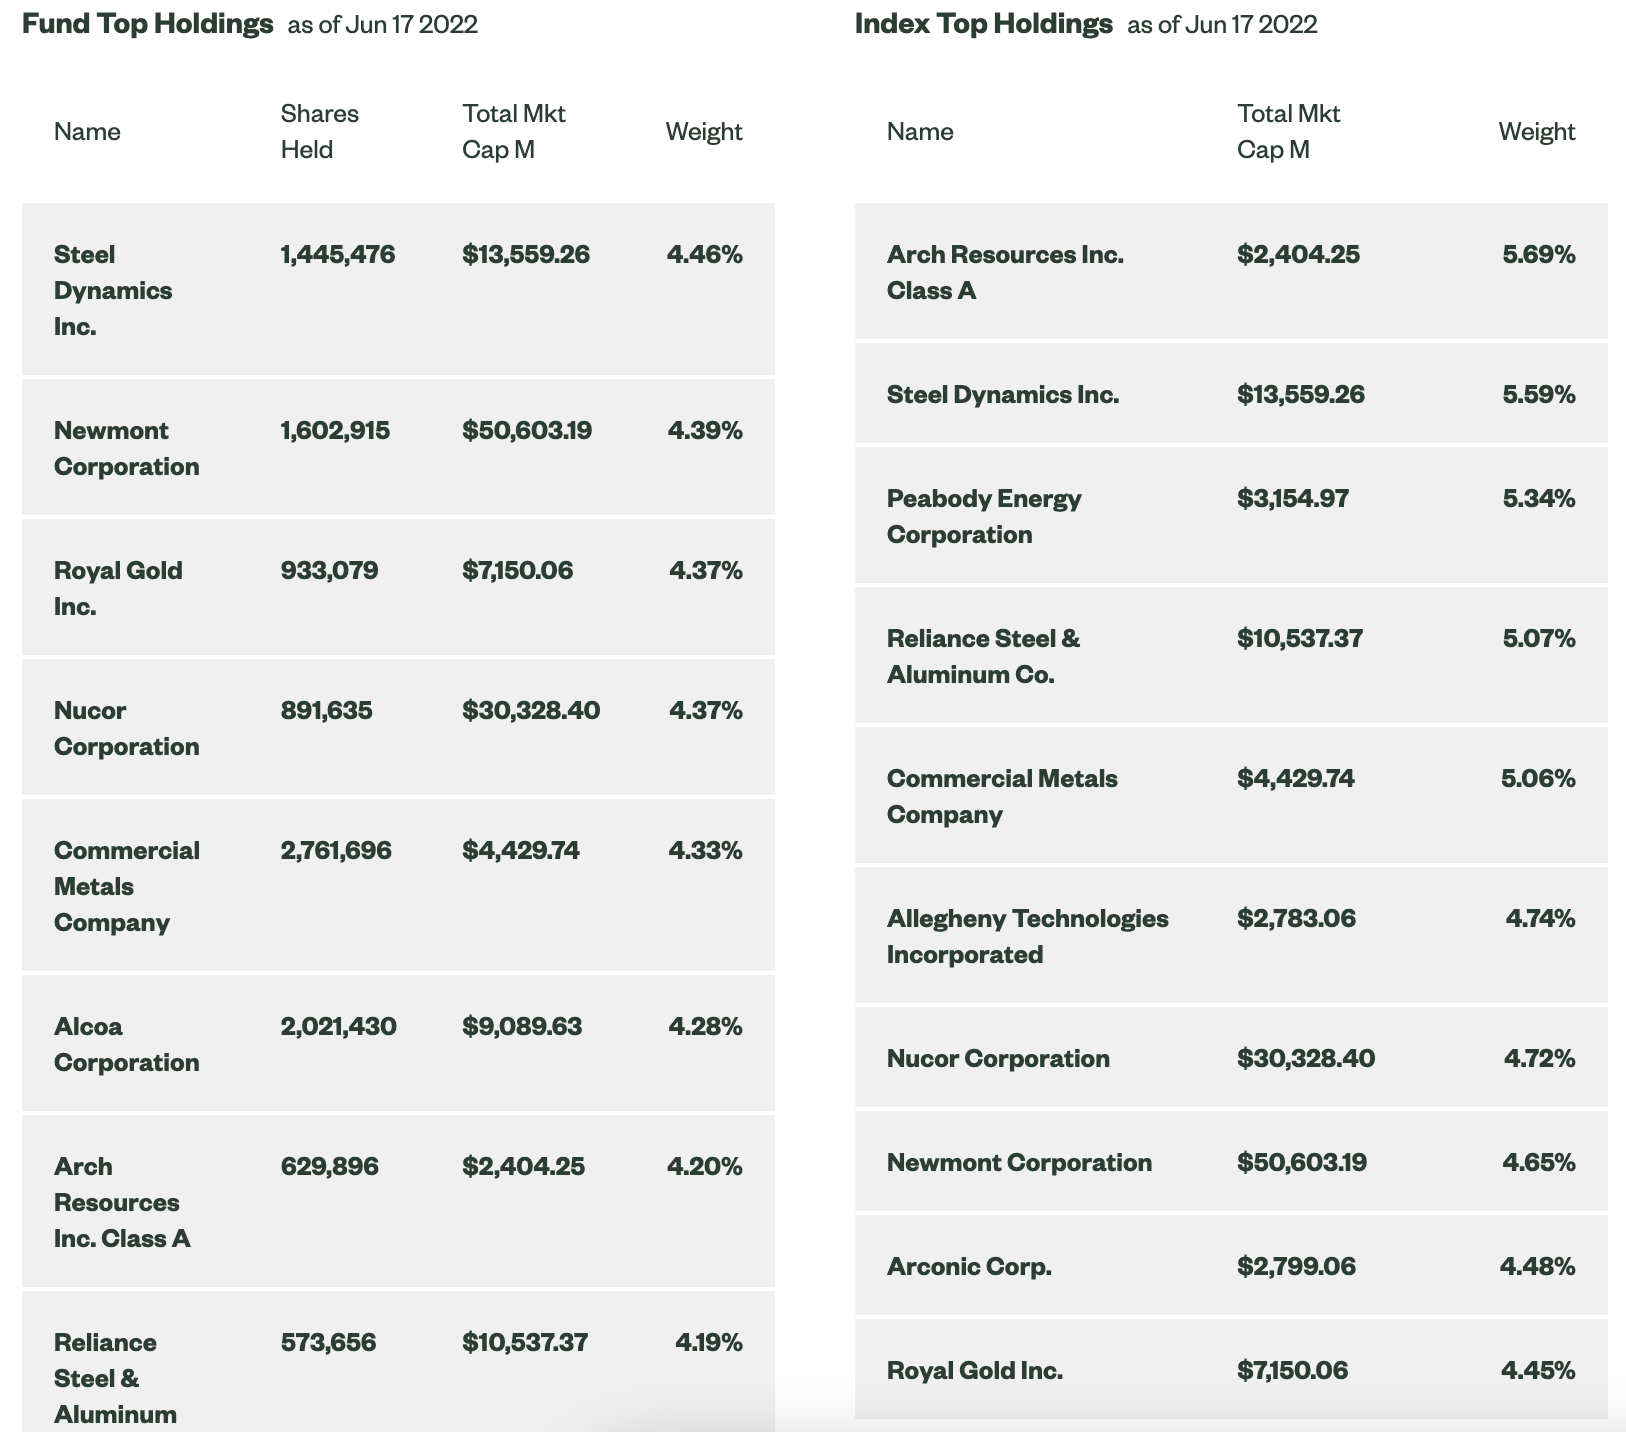
At this point, you’re probably thinking “why does XME hold so much steel”? I was a bit concerned about that as well in the past. However, that’s no dealbreaker. Steel stocks are highly correlated with the general commodity trade as higher commodities impact every aspect of the steel industry. Higher coal prices influence steel prices, higher inflation impacts margins, and the need to boost material production impacts most steel stocks as well.
To give you an example. The chart below compares XME to the price of copper (orange). It’s almost as if XME is a pure-copper play despite just 4% direct copper exposure.
TradingView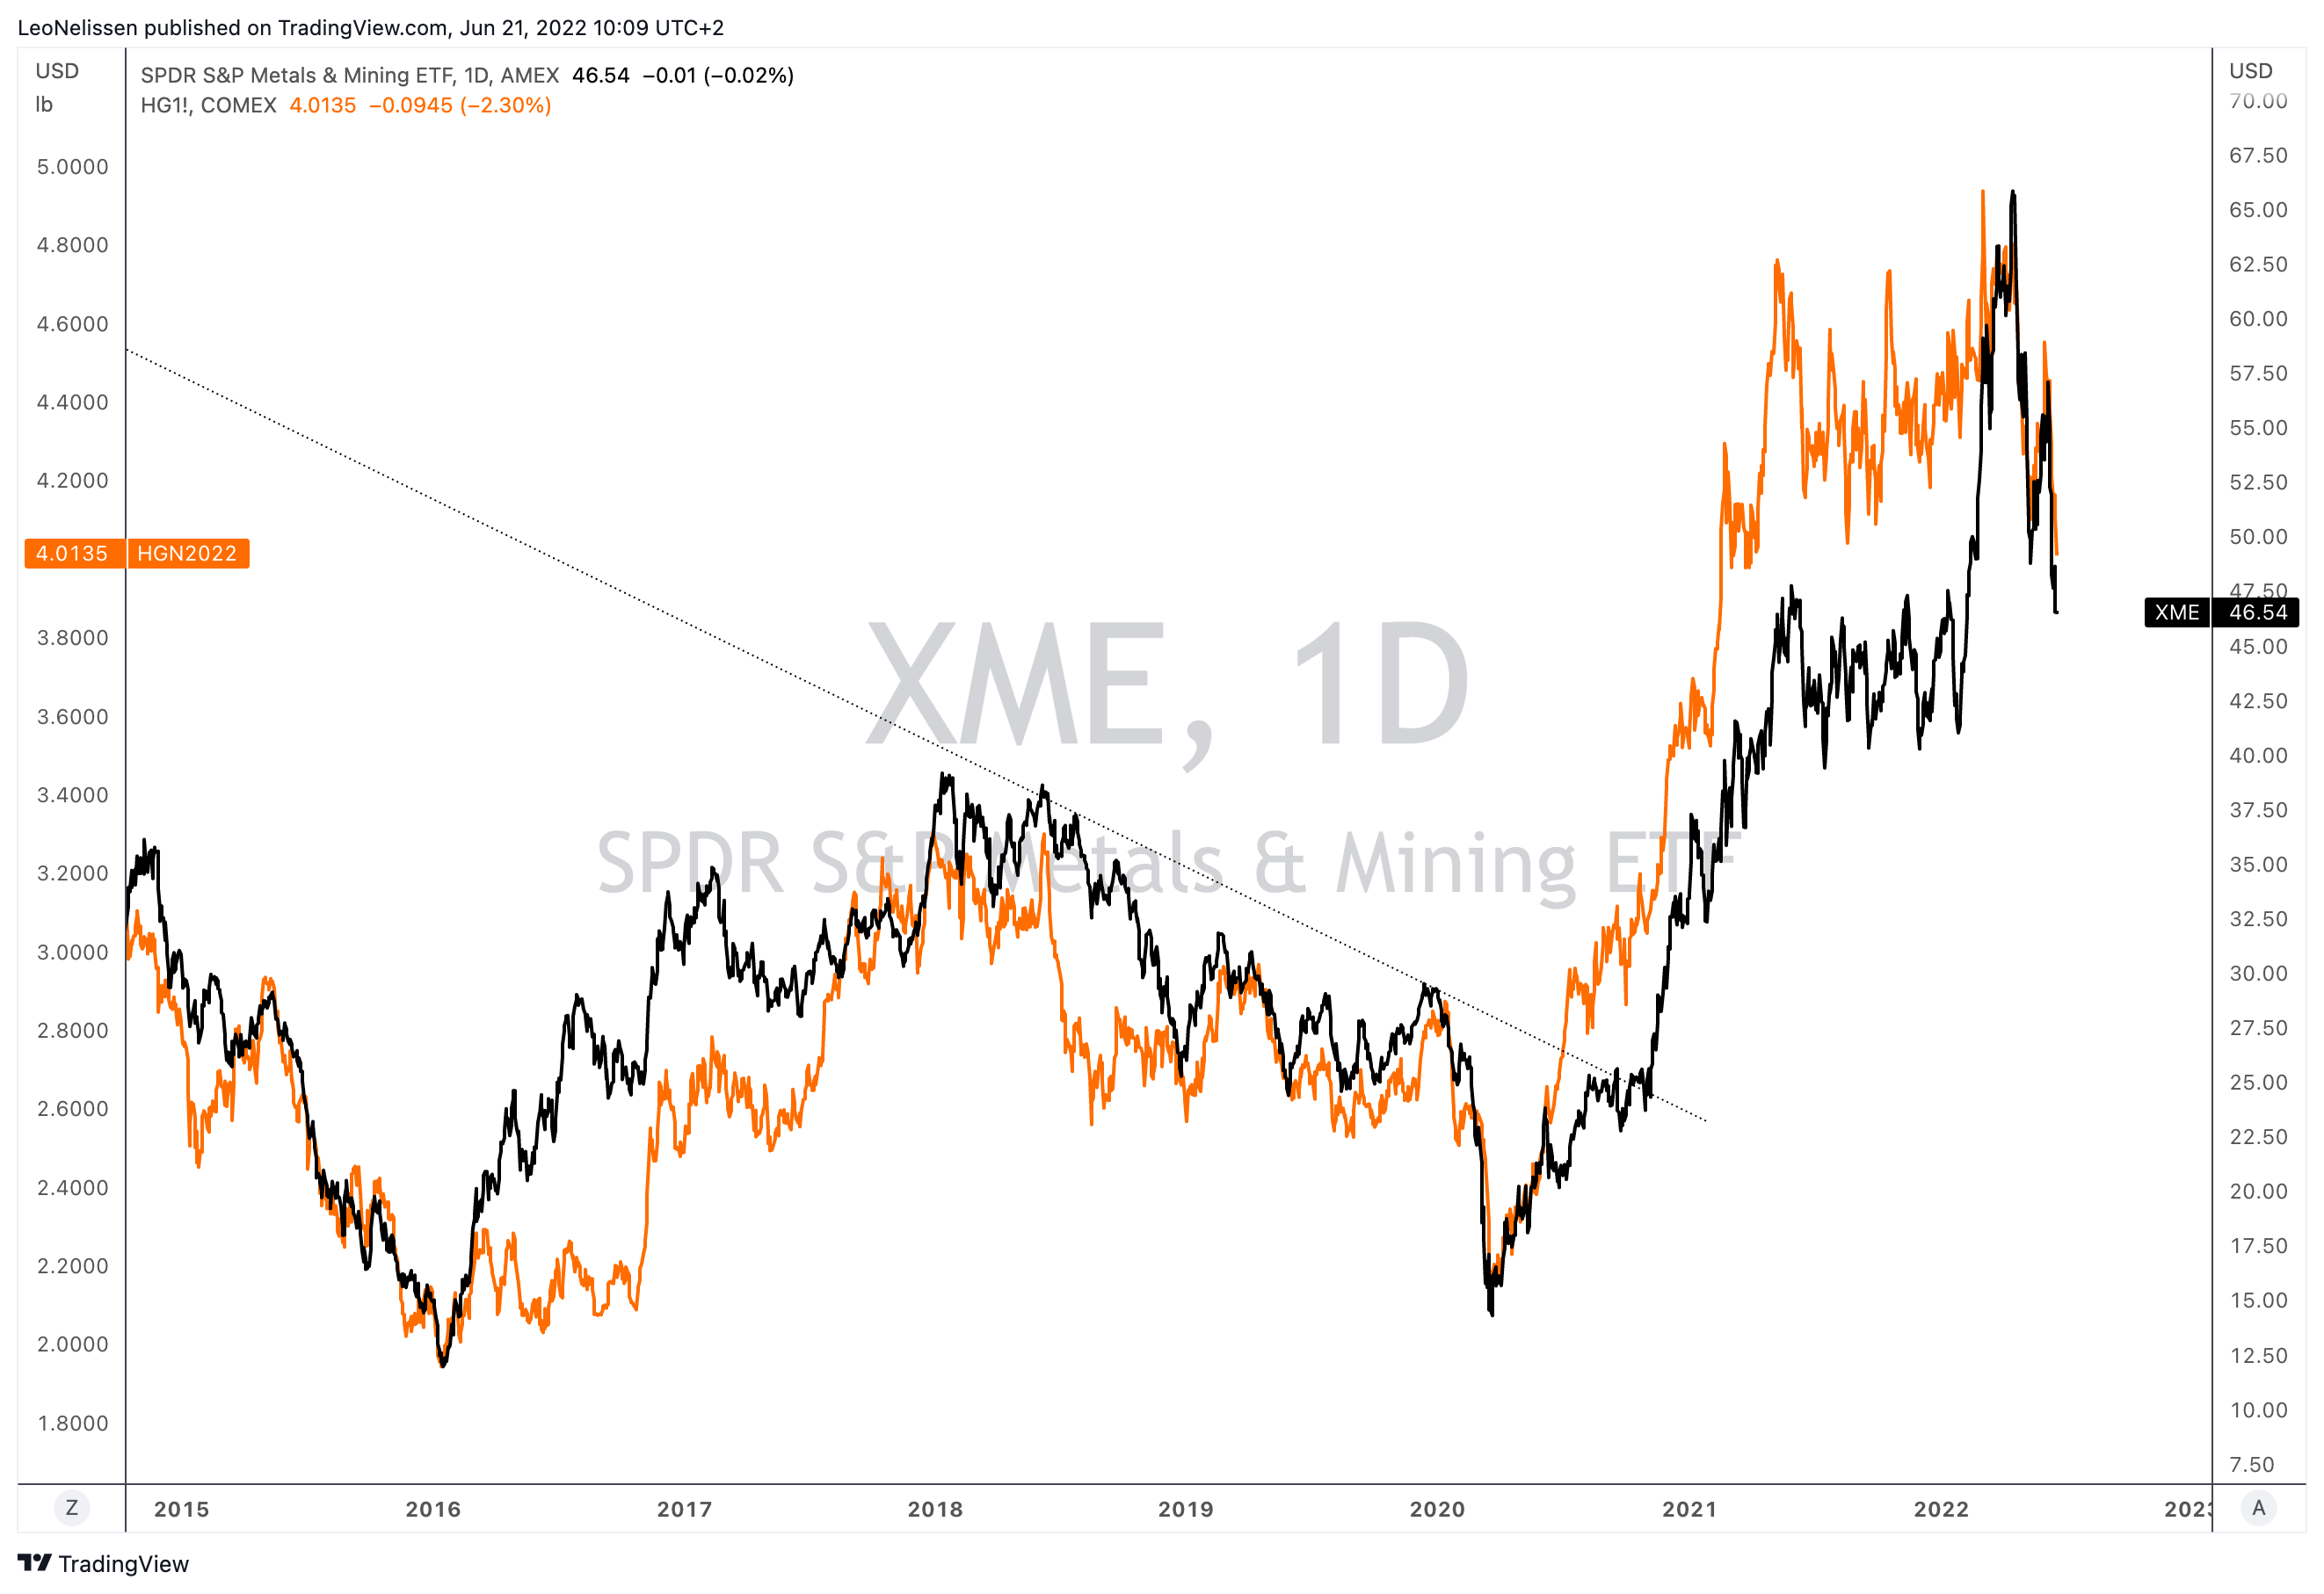
With that said, mining companies are still trading at subdued levels compared to “stocks,” using the S&P 500 as a benchmark. I expect the XME/S&P 500 ratio to creep up as inflationary periods tend to be very bullish for commodities.
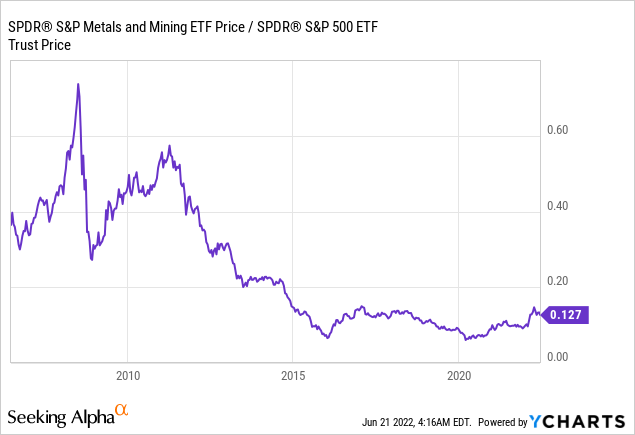
In my last XME article, I used the relative valuation of mining companies and stocks using Europe’s Stoxx 600 basic resources and Stoxx Europe as benchmarks. While I haven’t been able to find an updated version of the chart, I have updated the numbers. The relative P/E ratio is now 0.41, which means it’s even lower than the chart below after the recent stock market rout.
Bloomberg (via Intelligence Quarterly)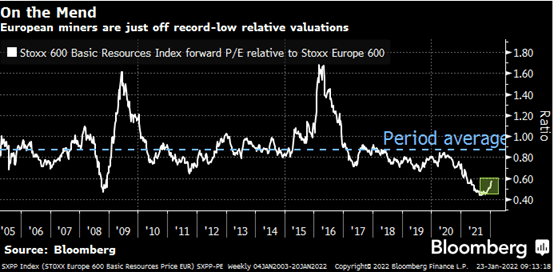
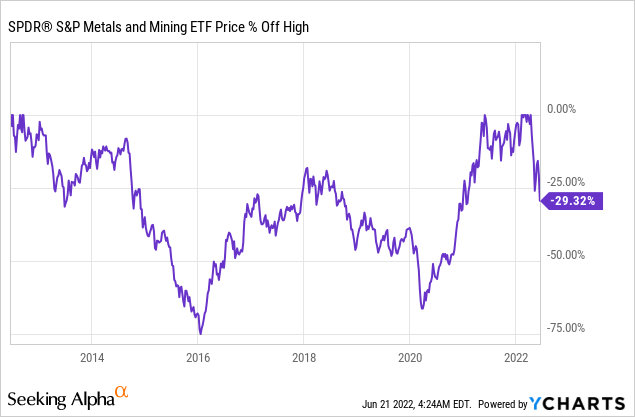
The ETF is now down 30% from its recent highs. In prior cycles, the stock bottomed at losses of (more or less) 75% and 60%. However, I don’t think this is the start of a new down cycle for the reasons given in this article. Moreover, the stock market has priced in a lot of potential economic weakness, which helps the bull case. While these tend to be famous last words, I believe that “this time is different.”
Takeaway
I’ve said it a few times this month, but this sell-off isn’t that much fun. Yet, it opens up new investment opportunities. One of these opportunities is buying mining stocks in a scenario where companies are seeing significant tailwinds for the first time in over a decade. Global commodity shortages are a huge risk as capital expenditures are lagging very far behind demand growth. This is made worse by the trend to “sustainability” technologies, which accelerates metals and rare earths demand.
Mining stocks are attractively valued and prone to maintain outperformance over the S&P 500.
The XME is a well-diversified ETF with a reasonable expense ratio offering investors exposure to the mining industry. Moreover, recent stock market weakness has pushed XME down 30% from its recent highs, adding to the attractiveness of an entry.
With that said, commodities and related trades are volatile. I’m not pushing anyone to buy commodity stocks. This article serves two purposes. The first one is presenting an ETF buying opportunity. The second is informing the public of important developments that impact all supply chains attached to commodity exploration and production.
These expected shortages are a huge factor when it comes to long-term inflation. Now, maybe more than “ever,” all eyes are on mining companies. It’s a tricky situation that will take a long time to be solved, favoring mining stocks.
(Dis)agree? Let me know in the comments!
Be the first to comment