

niphon
Thesis
The Tech ETF (NYSEARCA:XLK) and the Consumer Discretionary ETF (NYSEARCA:XLY) have finally staged their expected pullback from their respective highs. Therefore, investors waiting patiently for an opportunity to add exposure can consider assessing the current entry levels. We have often urged investors not to chase momentum surges, as seen in the price action of the XLK and XLY from their June recoveries. Unfortunately, investors joining the summer rally have been caught flatfooted, especially for the XLK, as it has given up most of its July and August gains.
Despite that, as discussed in our article, we remain highly confident that both ETFs have formed their long-term bottom in June. Furthermore, insider sells metrics for both ETFs are still at levels well below their 10Y lows. Therefore, even if investors were caught in the recent deep market pullback, we urge these investors to hold their positions resiliently and wait for the subsequent recovery.
Moreover, they can also capitalize on the recent retracement to add to their positions, as both ETFs are still close to their long-term bottom in June.
Accordingly, we reiterate our Buy rating on the XLK and rate the XLY as a Buy.
Was The Fed Really Responsible For The Recent Market Sell-off?
Some market participants and the media alluded to the impact of Fed Chair Powell’s direct and terse address at Jackson Hole in late August. It was arguably one of Powell’s most unambiguously hawkish commentaries in recent times, as he sent out a clear message that the Fed was far from done with its “unusually large” rate hikes.
As a result, what appeared to be relatively even odds of a 75 bps rate hike (pre-Jackson Hole) at the upcoming September FOMC meeting have been revised dramatically. As of September 6, the market shows a 74% probability of a 75 bps rate hike, as investors priced in Powell’s message.
Did the Fed crash the market, or was the extreme optimism already reflected in its price action pre-Jackson Hole? We alerted members of our service on August 16 that growth stocks were in dire need of a pullback, given their rapid surge from the bottom. We reiterated our concerns in our update on August 22 that the semiconductor ETF’s (SOXX) rapid spike from its June/July lows was unsustainable. We added:
Note that the SOXX made most of its recent recovery in July. While we are confident of its July bottom, we don’t prefer buying into such rapid surges. Coupled with overbought technicals, investors shouldn’t be surprised to see the SOXX fall further. (Ultimate Growth Investing August 22 Weekly Market Analysis)
ETFs 1M performance % (koyfin)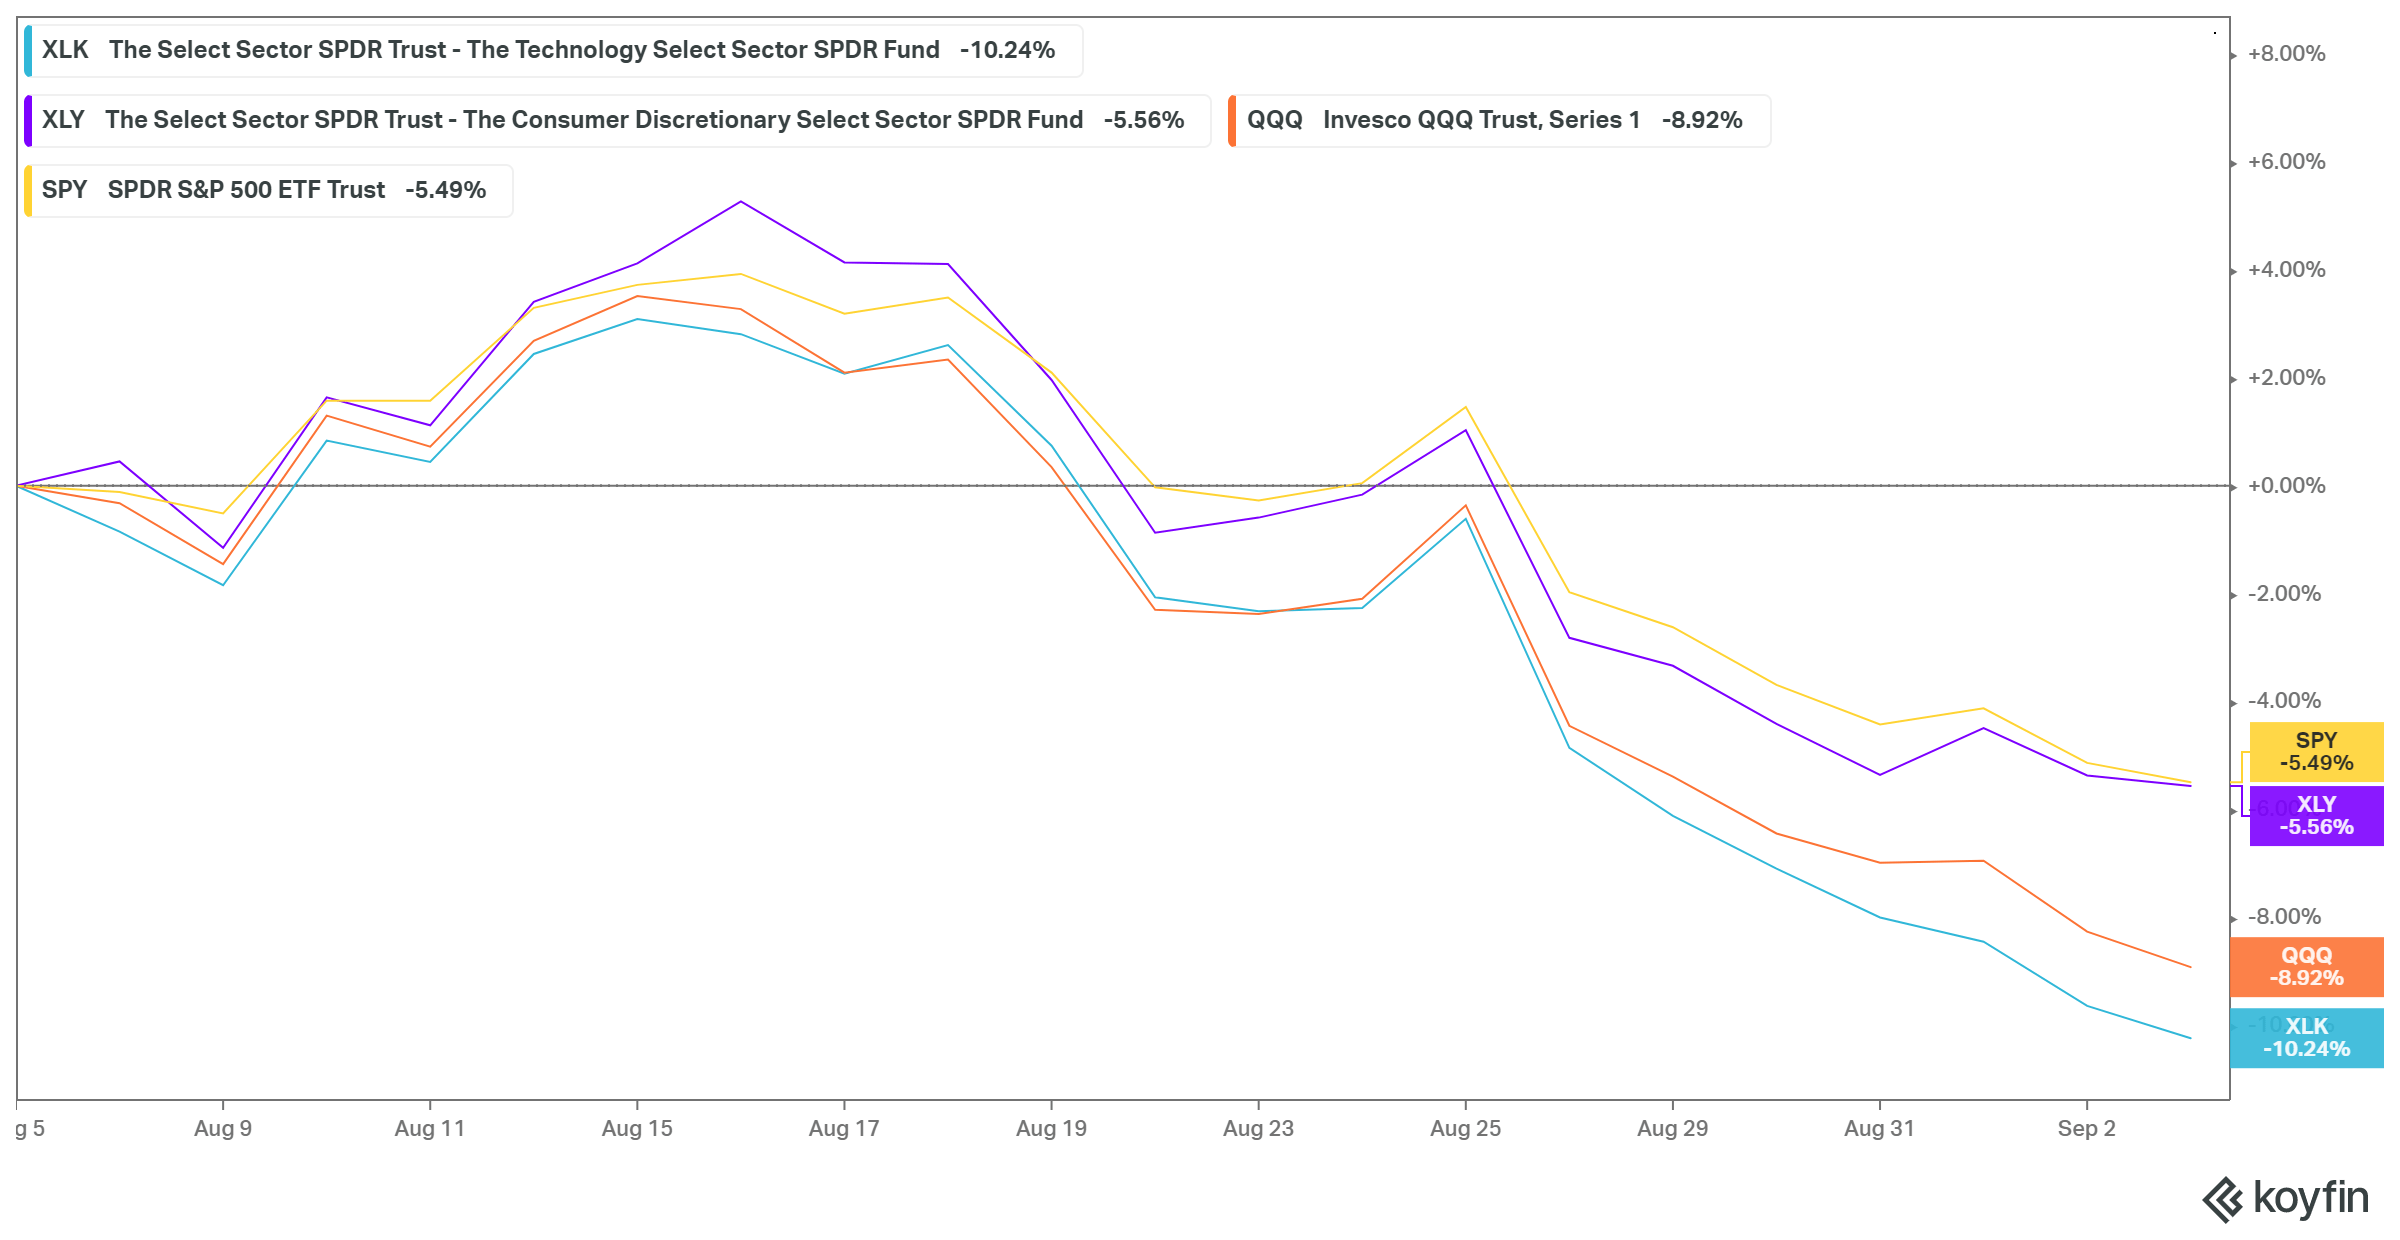
Consequently, the SOXX has also given up most of its recovery from July as it closes in on its lows. The selldown has also impacted the XLK, as it underperformed the broad market significantly over the past month, down 10.24%.
Therefore, while Powell’s address at Jackson Hole likely triggered the sell-off, the overbought technicals, breadth, and momentum indicators were already brewing since mid-August. Hence, we posit that the market was only waiting for a ripe opportunity to dissipate the gains. It drew investors rapidly into the summer rally, and Jackson Hole was the “perfect pretext.”
Don’t Fear As The Sell-off Shook Out Weak Hands
XLY price chart (monthly) (TradingView)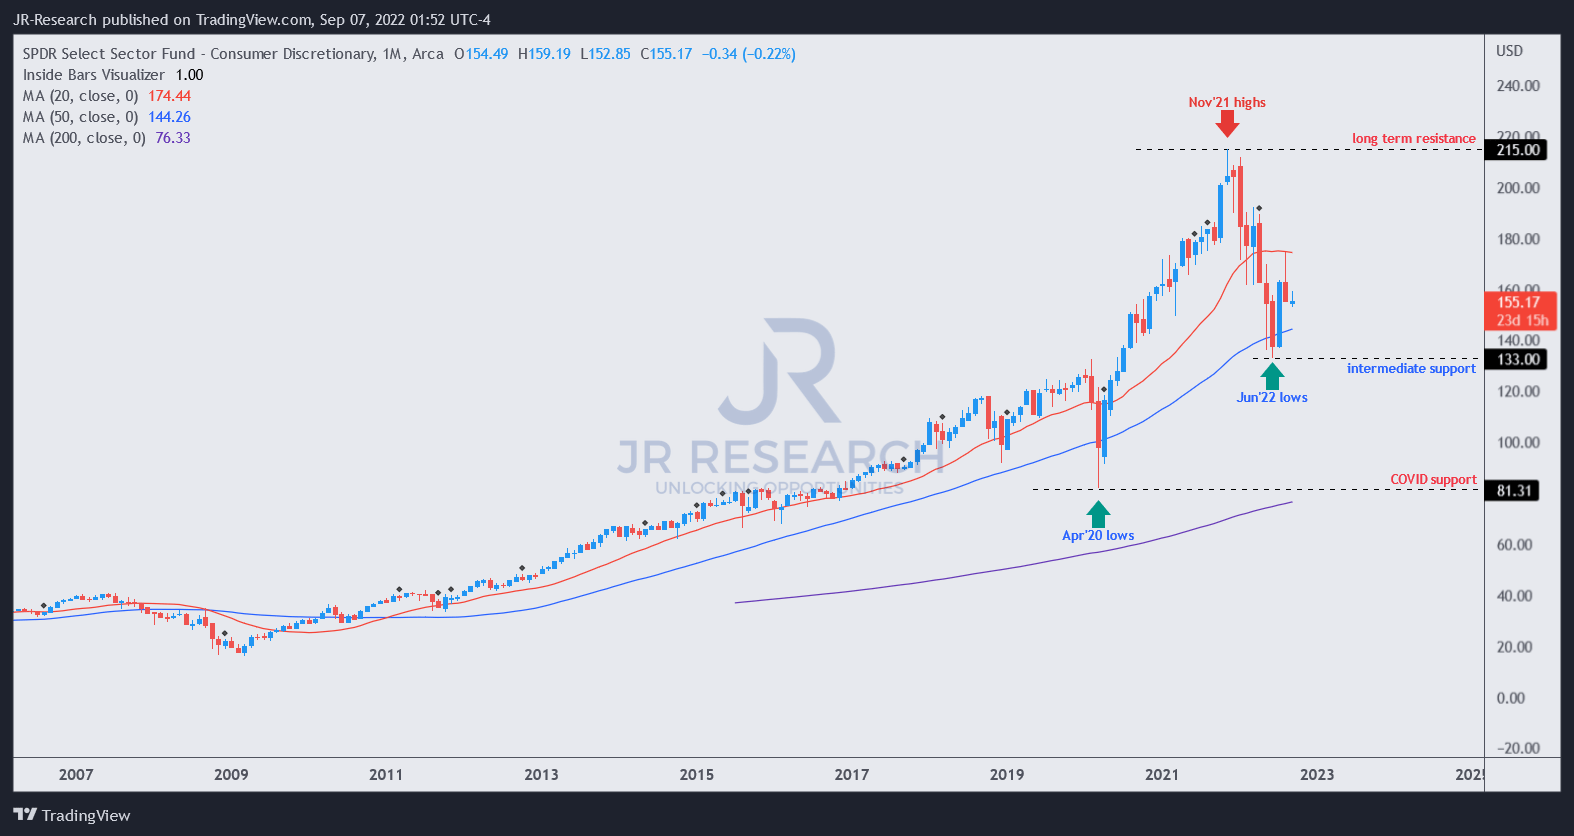
As seen above, the XLY remains robustly supported above its long-term bottom in June, despite the deep pullback in August. Moreover, the XLY has held up much better than its XLK counterpart, as e-commerce, auto, and retailers resisted the recent pullback much better. We also updated investors in a recent article that Amazon (AMZN) stock could be bottoming out after its pullback.
XLY price chart (weekly) (TradingView)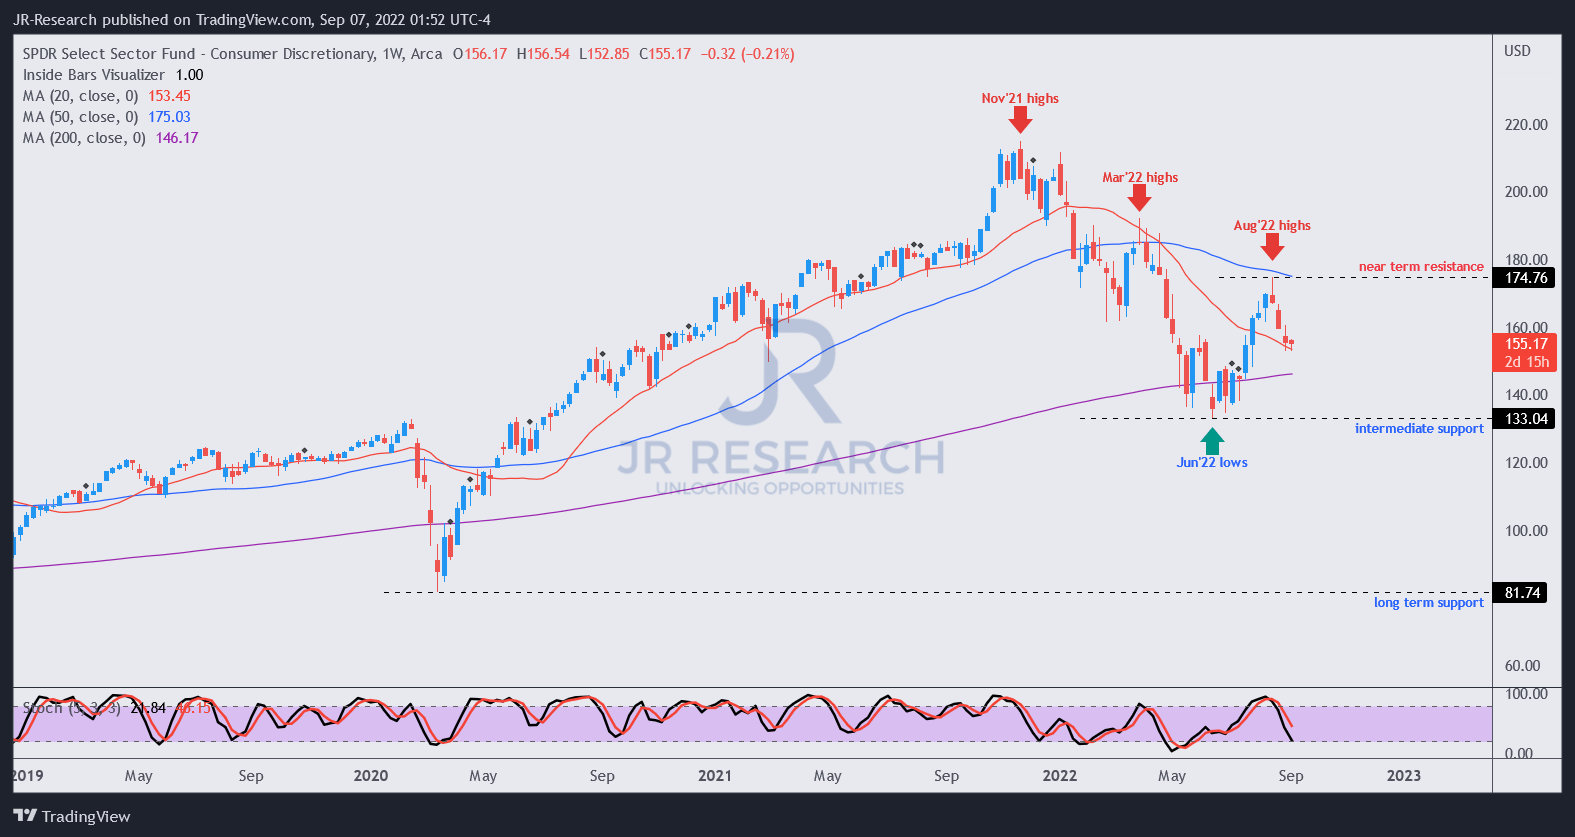
The XLY has attempted to form its bottoming process on its medium-term chart as its momentum indicator closes into oversold zones. Our analysis of XLY’s short-term breadth also indicates that it’s deeply oversold, corroborating the possibility of a consolidation phase.
Investors are urged to observe whether the XLY can base constructively as it attempts to regain control above its 20-week moving average (red line). If it could, we deduce it’s the preamble to a move to retake its 50-week moving average (blue line) moving forward and reestablish its medium-term bullish bias. Therefore, the price action on the XLY is highly constructive.
XLK price chart (monthly) (TradingView)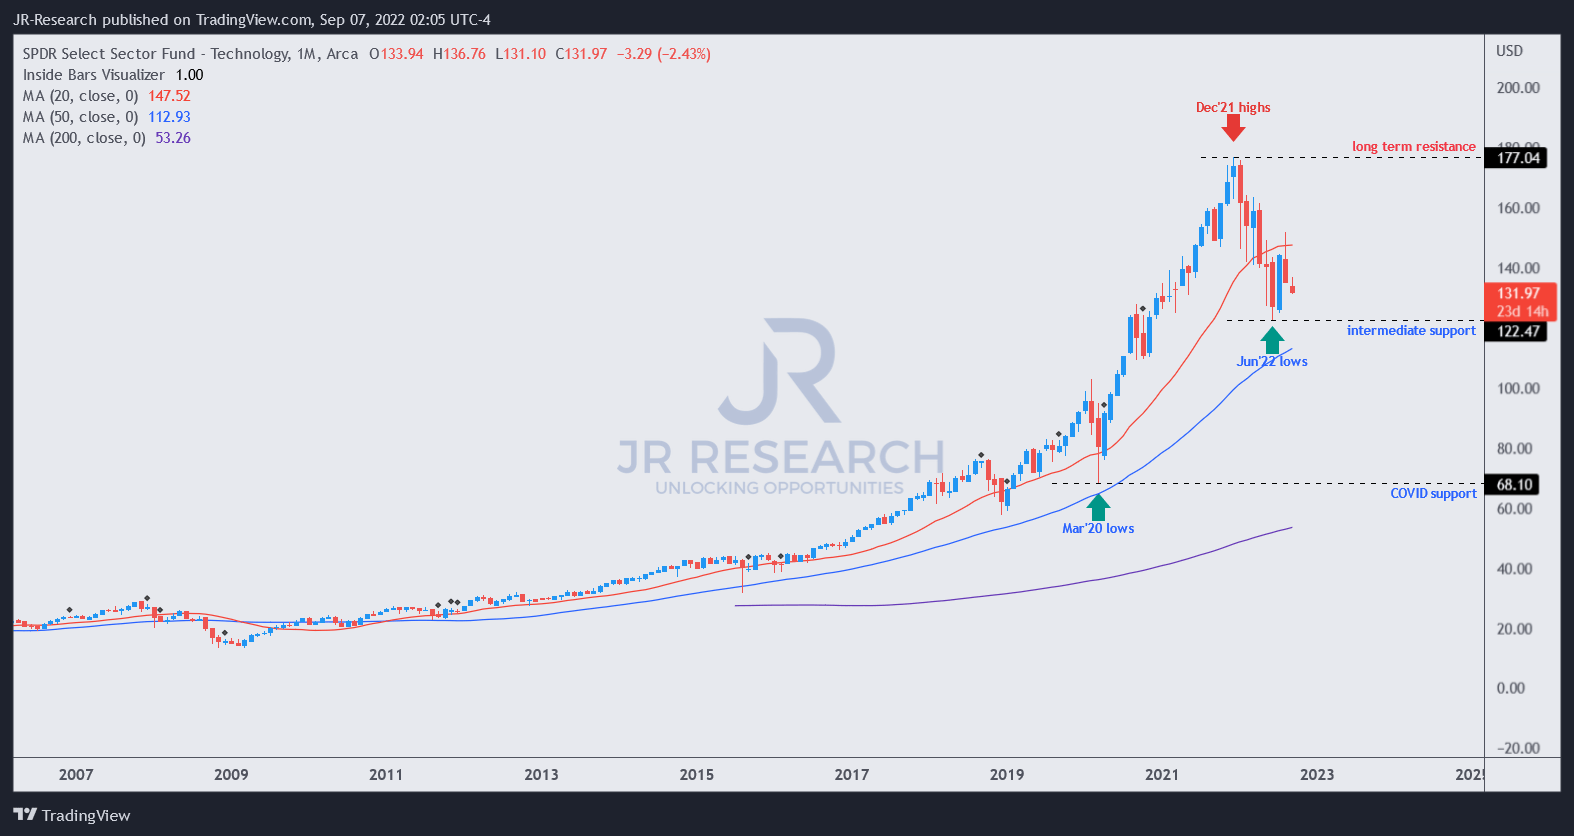
The XLK has undoubtedly suffered more significantly than the XLY, as most of its gains from July dissipated over the past four weeks. Therefore, bearish investors have reared their heads again, enunciating that the “bear market rally” was finally over.
However, we remain confident that the XLK’s June lows seem robust, and it has likely formed its long-term bottom. SaaS and semi stocks remain attractive as a whole, as their PEG ratios reversed their gains after the recent sell-off.
XLK price chart (weekly) (TradingView)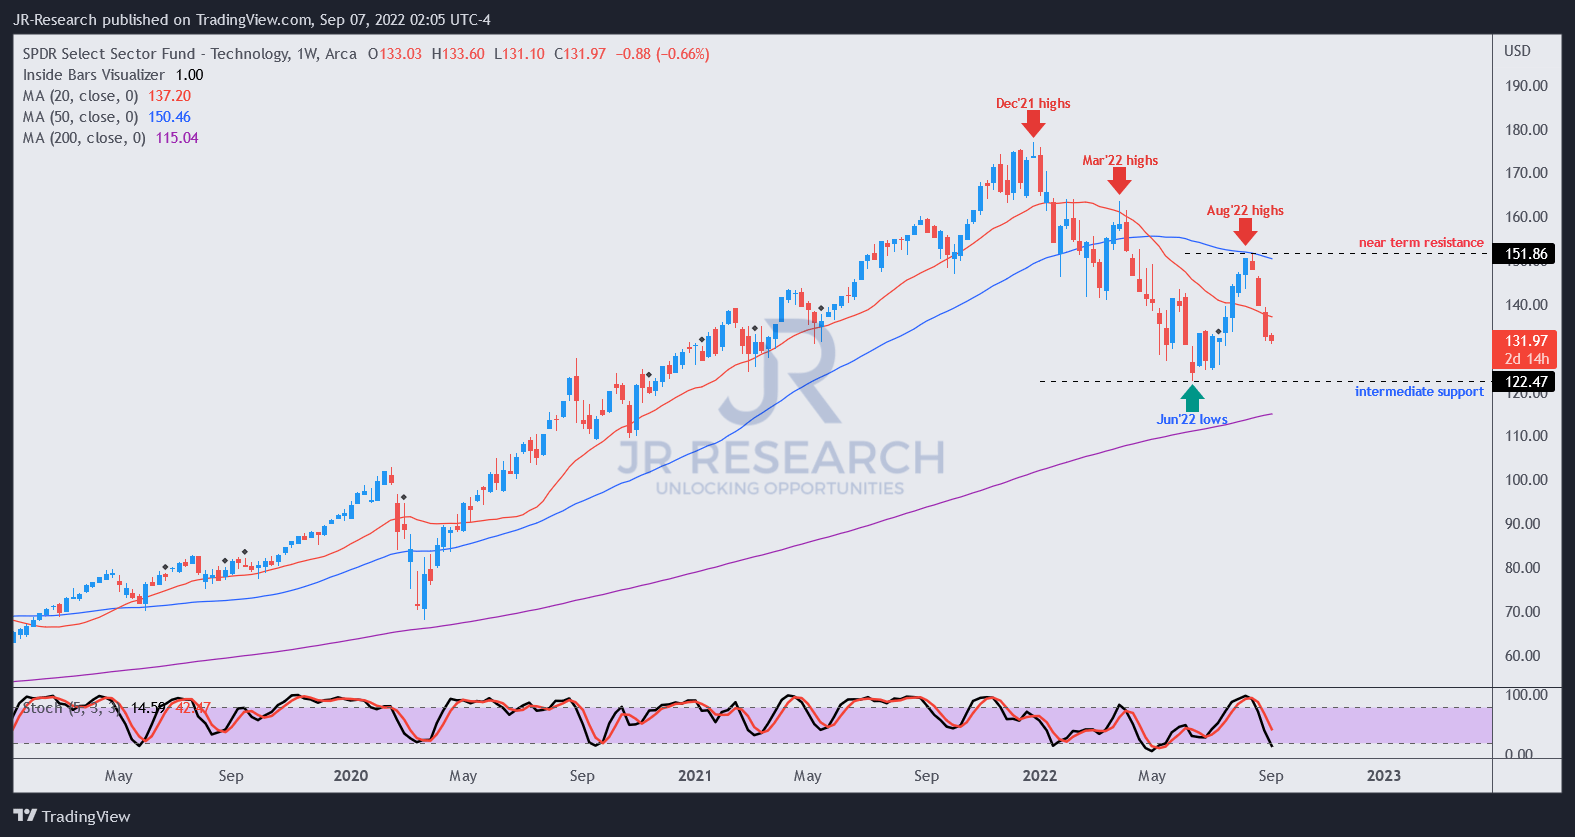
Astute investors should note that the price action over the past four weeks is emblematic of the rapid surge to form its August highs, but in a reverse fashion. Our past observations enlightened us that rapid surges and sell-downs are not sustainable. Instead, these are moves for the market to trap overly-optimistic buyers (rapid surges) or force weak hands to capitulate (rapid sell-off). Therefore, we posit that the XLK is primed to form a bottoming process as it seeks to retake its 20-week moving average.
Therefore, we are not unduly concerned with the deep retracement in the XLK. Instead, we see it as an opportunity, as the market de-risked the entry levels. Investors should note that the XLK’s momentum, short-term and medium-term breadth, has already entered into oversold zones.
Are The XLK And The XLY A Buy, Sell, Or Hold?
We reiterate our Buy rating on the XLK and rate the XLY as a Buy.
We surmise that the XLK and the XLY remain close to their long-term bottoms. Coupled with the meaningful pullback, the market has de-risked the entry levels for a less aggressive zone for investors to add exposure.
Be the first to comment