

The FTSE 100 has been coiling sideways in a triangular shape format since February 7th high at 7687 and it seems it’s ready for a breakout.
The key level is set out at 7578 that would require price to break for a thrust out of the triangle to the upside and an invalidation level set at 6998 to invalidate the triangle. If price breaks through the invalidation level, a new bias and count would be considered.
The above is the Elliott Wave count since March 2020 and it seems like the FTSE 100 is unfolding a clean impulse wave within this bullish sequence. The FTSE 100 is yet to complete wave 4 as a triangle.
According to the guidelines of the Elliott Wave Theory, wave 2 was a sharp correction as opposed to wave 4 is sideways, this is based on guidelines of alternation.
The FTSE 100 is trading above the 200-day moving average as well which gives us a solid confirmation that the trend is still bullish despite it trading sideways since February 2022.
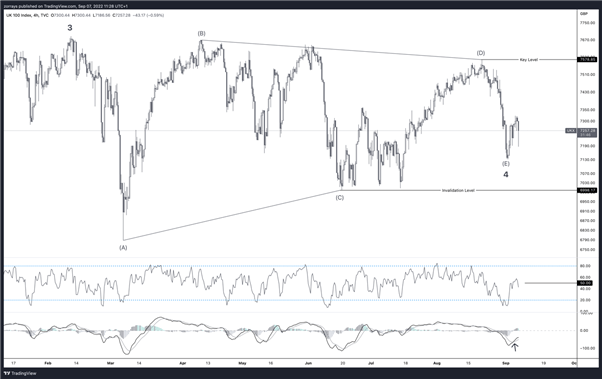
So, to clarify the overall trend is bullish. The pattern working with is a triangle pattern and the FTSE 100 completed wave (E). Let’s take a look at our momentum indicators. RSI has broken through 50 and there is still room to the upside should price continue to climb from here onwards. On the MACD indicator, there is a moving average crossover too which indicates that price is turning bullish.
Be the first to comment