

NicoElNino
Intro
We look to have at least a short-term bottom in the Industrial Select Sector SPDR Fund (NYSEARCA:XLI) considering the fund’s rally above its 10-day moving average on Thursday, the 13th of October. Furthermore, XLI was able to successfully test its late September lows this week, which also is an encouraging sign. These developments give extra weight to some of the long-term trends, long-term investors pay attention to.
For one, XLI has now paid a dividend to fund holders for the past 22 years straight. Furthermore, although the yield may not turn many heads (well under 2%), the annual payout has grown by over 17% over the past twelve months. Solid dividend growth rates stem from strong asset under management (AUM) growth over the past few years. Furthermore, the low expense ratio of 0.11%, the 70+ industrial holdings that bring strong diversification to the fund as well as the ETF’s strong liquidity (average 3-month daily share volume) are strengths that long-term investors like to see in their holdings.
However, given the setup we see presently in XLI, we see more opportunity in selling volatility rather than going long shares of the fund at this stage.
Volatility – Vega
If we look at a volatility chart of XLI, we see implied volatility of 28.9% and historical volatility of 24.9%. Whereas implied volatility is a read on how XLI will trade going forward, historical volatility is a factual calculation that demonstrates how the fund has traded in the past. Suffice it to say, option sellers have an edge when implied volatility (the volatility which is expected) comes in higher than historical volatility. (The fund’s volatility, which already has been). By selling options when they are overvalued, option sellers essentially wait for a contraction in IV, which then enables those sold options to be bought back for cheaper prices. Furthermore, the higher the fund’s IV is above its average, the bigger the opportunity, all things remaining equal. Suffice it to say, vega is the first way we intend to get paid on this trade.
XLI: Implied Volatility V Historic (Interactive Brokers)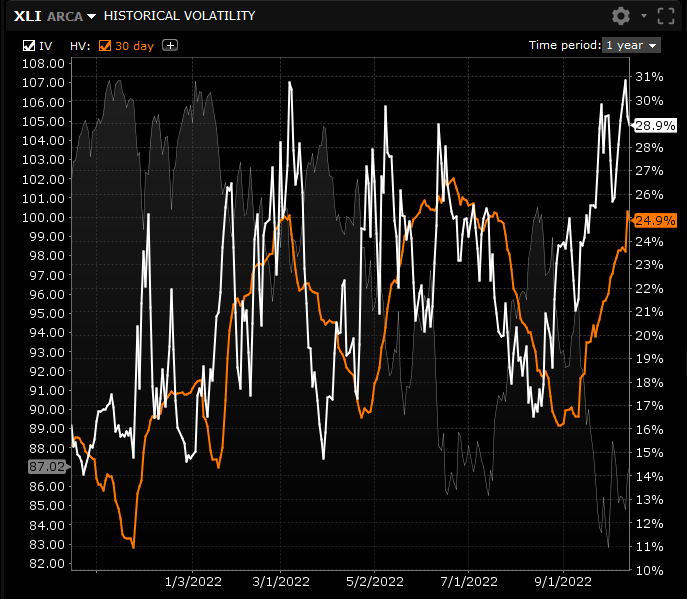
Time Decay – Theta
Since our setup in XLI is the sale of an iron condor in the November cycle, theta or time decay will work for us in this play. Since we usually place our trades with a one or two-month horizon, theta is a key metric in our trading, as options lose value faster the closer they get to expiration. Theta is denoted as a negative number where our spread will lose x amount of dollars every day from time decay, all things remaining equal. The closer we let the trade get to expiration, the faster the theta will be. What we want is for the options below to have no intrinsic value at expiration. This means they would be worthless, which means the initial credit would be to keep. Despite the fact that there is $265 of risk per iron condor, our maximum risk would never be realized as we would not let hold the options until expiration.
XLI November Iron Condor (Interactive Brokers)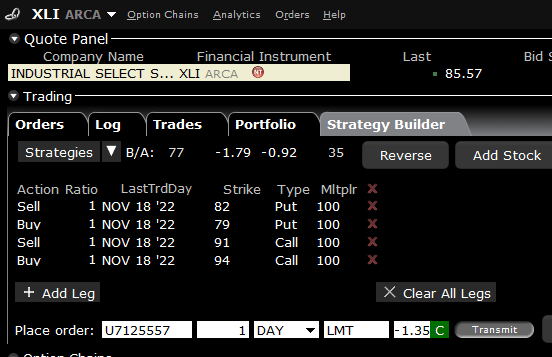
Technicals
As we can see from the trading range on the technical chart below, this is where we want shares to trade over the next 3 to 4 weeks, so indeed theta and vega can work in our favor as much as possible. The sustained pattern of lower lows in XLI as well as the 200-day moving average of $94.77 provide significant upside resistance which should stop any potential violent rallies in the short term. With respect to the downside, it is crucial that the recent lows in the fund hold. If they do not, we may swiftly close this play, as almost certainly lower lows would be ahead for the fund. Nevertheless, considering how oversold the fund is at present and the associated crossover of the MACD indicator, we would expect to see some type of short-term bounce here.
XLI Potential Short-Term Trading Range (StockCharts.com)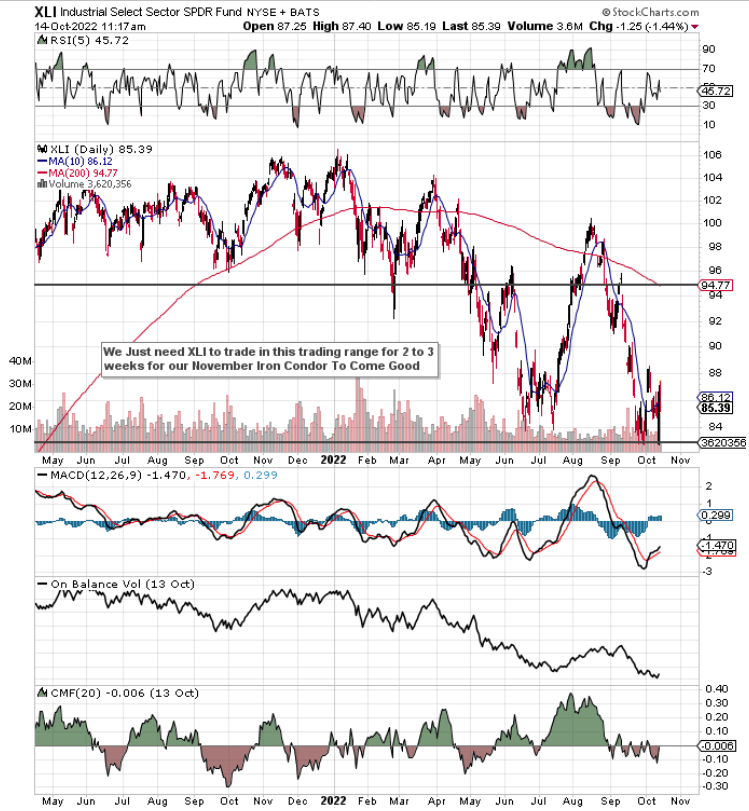
Conclusion
Although XLI looks like it has bottomed, elevated volatility has us more interested in a volatility play instead of a swing play to the upside. We believe the ETF will remain rangebound now for the foreseeable future. We look forward to continued coverage.
Be the first to comment