

MicroStockHub/iStock via Getty Images
Collateralized Loan Obligations have been an enigma to many in the market. While the complexities of their structure and payouts have befuddled many, the more pressing confusion has come from their actual returns. How much can you make in this area? Historically, the answer has been “slightly more than high yield bonds”. Of course, with high yield bonds now yielding a lot more, it is time to revisit this space. XAI Octagon Floating Rate & Alternative Income Term Trust (NYSE:XFLT) is a closed end fund which we covered first in April 2022. Back then, much to dismay of yield chasers, we threw out our forecast for the total return.
The yield on NAV is over 11%. Of course, here we are not investing in an index but in the fund. The leverage should, in theory, add a few extra points of returns, but with that fee structure, we are doubtful you can get much mileage over the index returns, maybe 1-2% annually. Hence, we would rate the common shares a hold or at neutral currently.
Source: 10.3% Yield But Mediocre Total Returns
It definitely hurts when our forecasts turn out to be optimistic.
Seeking Alpha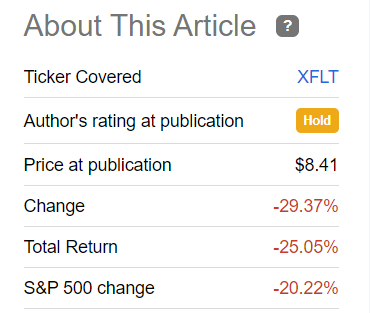
We examine how we got here and where we think we are going next.
Fund Structure
XFLT invests in an actively managed portfolio of floating-rate credit instruments and other structured credit investments. The bulk of these are made up of senior secured loans, CLO debt and CLO equity.
XFLT Website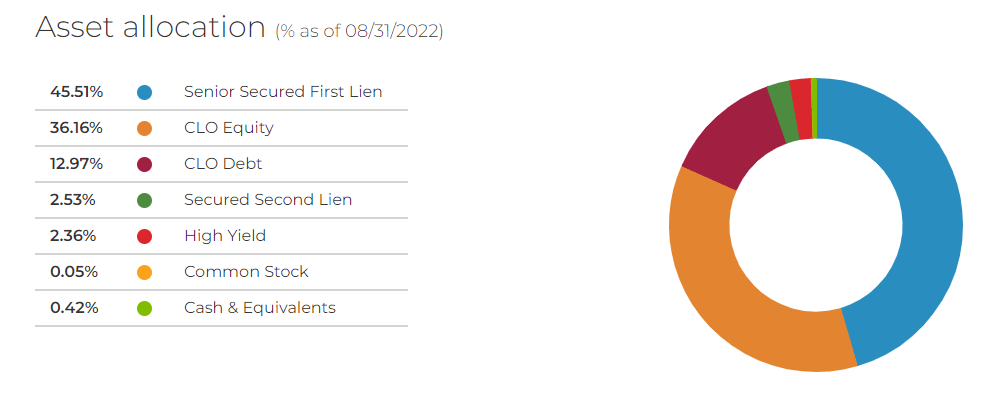
At a functional level, these tend to do better than junk bonds, but outcomes can vary based on which ones you pick, and of course, how things are priced. Since the April article, we can see that the Net Asset Value or NAV has closely followed the junk bond space.
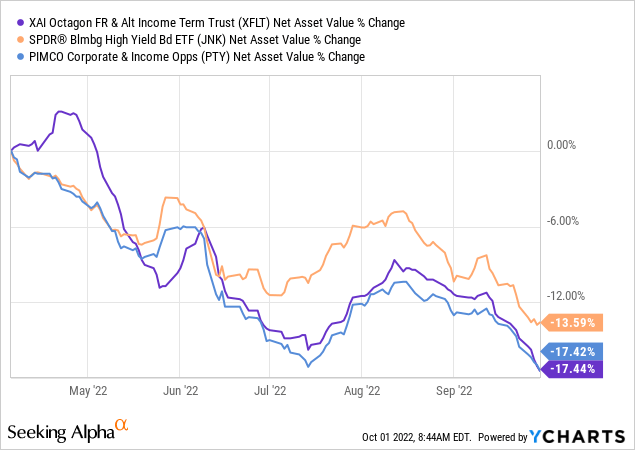
SPDR Bloomberg Barclays High Yield Bond ETF (JNK) has done a bit better from a NAV standpoint, but then XFLT pays a higher yield so total return on NAV is very similar after distributions are taken into account.
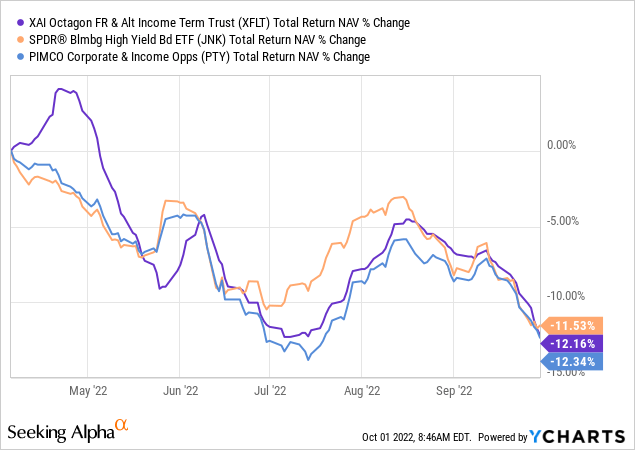
We have thrown in PIMCO Corporate & Income Opportunity Fund (PTY) the perpetual favorite of the crowd, just to show that there is no magic when the tide goes out. All of these get the same treatment when the printing presses are not running overtime to create returns.
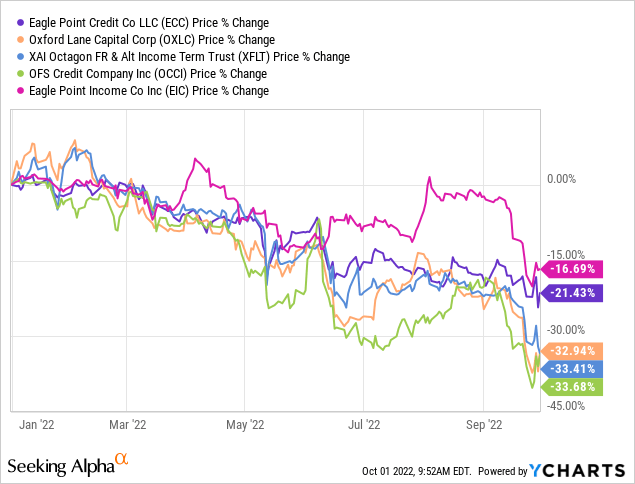
While those returns were poor, XFLT’s price returns were extraordinarily bad. A 30% loss in about 7 months, which is far above even the S&P 500 (SPY) losses, drives home a critical point.
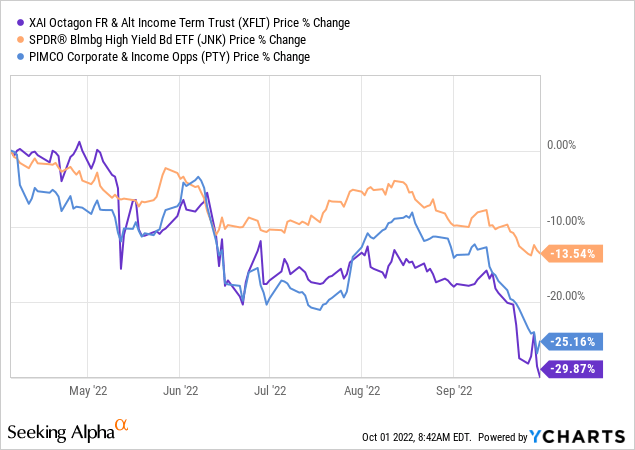
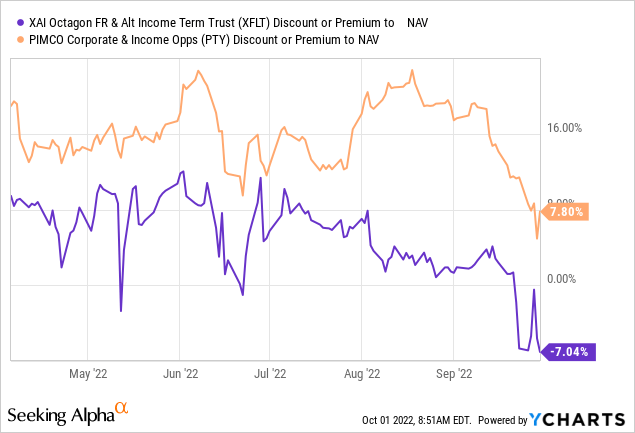
Never pay premiums above NAV for such mediocre setups.
XFLT’s swing from 8% premium to a 7% discount, created a really poor return over the last 7 months.
Outlook
All CLO funds we have looked at, tend to use the Leveraged Loan Index as their benchmark. XFLT is no different.
“Price” is based on the closing prices of XFLT on the NYSE at the end of trading on the last trading day of each period. “Benchmark” is the S&P/LSTA U.S. Leveraged Loan 100 Index, which is a market value-weighted index designed to measure the performance of the U.S. leveraged loan market.
Source: XFLT
We cite this upfront here just to make sure that we don’t get questions about why we did we not compare XFLT’s performance to some other exotic index. The said index delivered these returns.
S&P Global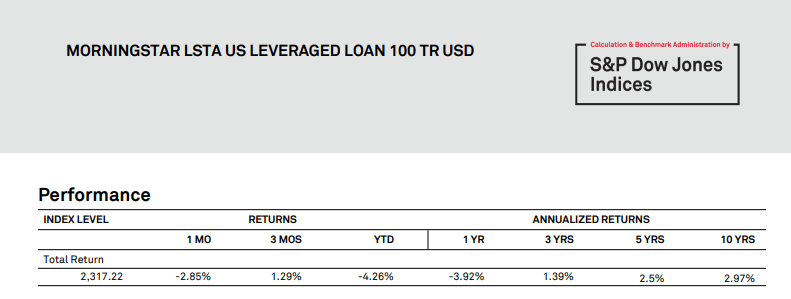
2.97% over the last decade should be a splash of cold water to any genius suggesting that CLO funds can deliver 15% annualized returns without breaking a sweat. In fact, the leveraged loan index broke above 10% total returns in only 3 years.
S&P Global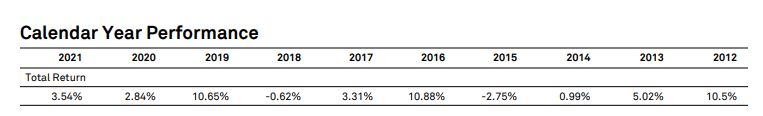
JNK’s returns are almost identical at 2.94% on price and 3.07% for NAV over the last decade.
JNK returns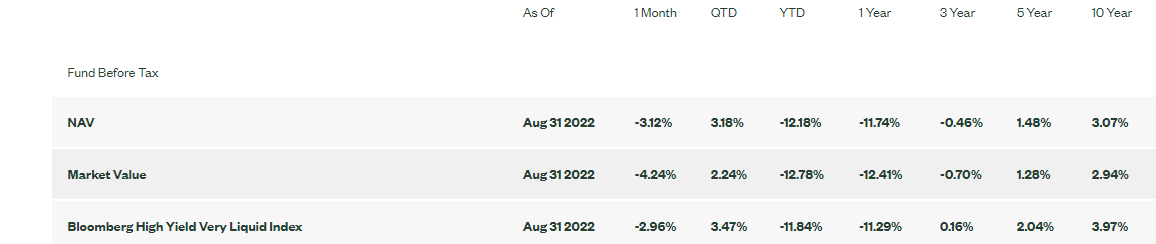
Today, arguably we are closer to the bottom of the cycle than the top though. CLO and junk bond pricing has improved.
XFLT Website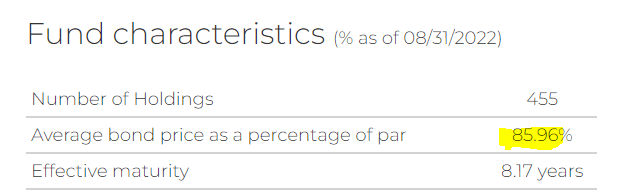
We are seeing similar pricing on JNK with yield to maturity and yield to worst hovering near 10%.
JNK Website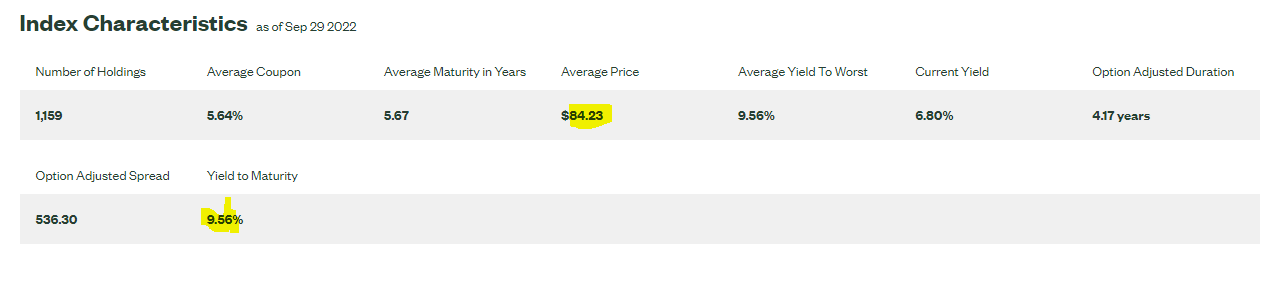
So, can we at least make 10% a year in total returns from this point on XFLT?
Verdict
Our answer there is still a “no”. With XFLT, we do have the better pricing in place, but we also have a management expense ratio that is on the high side.
XFLT Website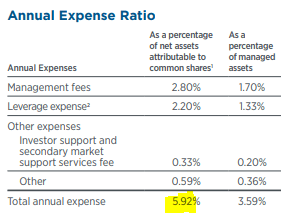
XFLT uses leverage via its preferred shares to compensate for this expense ratio.
XFLT Website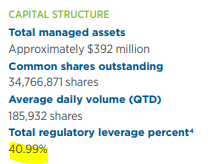
All CLO funds that we cover have leverage, so this is nothing special. What the risk here is that we get some funds breaching the maximum leverage allowed and starting a cascading fire sale in CLO space. That would require funds to either issue common equity below NAV or sell assets and buy back preferred shares on the market. This represents a huge risk over the next few months and one we would not take lightly. Moving beyond that, junk bonds and CLOs could deliver 6% annual returns from here, no question. Yes, yield to maturity is higher, but you will have loan losses and restructuring. You are not getting 9-10% to lend to Microsoft Inc. (MSFT). We have well priced interest rate risk, but we have to account for potential defaults in our return calculations. XFLT is also at a discount and that makes us feel better about our forecast.
Keep in mind that is total return price, including the distributions. As we have said a few times in the last 6 months, not a single CLO fund will earn its distributions in the immediate future. That is, NAV and price will drop at least to some degree to counterbalance the distributions. So far, this has proven correct, though there has been a wide disparity in the drops.
While markets are extremely oversold and a bounce could come at any time, do examine total returns over long period before accepting the idea that high double digit annual returns can fall out of the sky for you. XFLT’s total returns with distributions reinvested since inception (fund beginning, not the movie) are presented below.
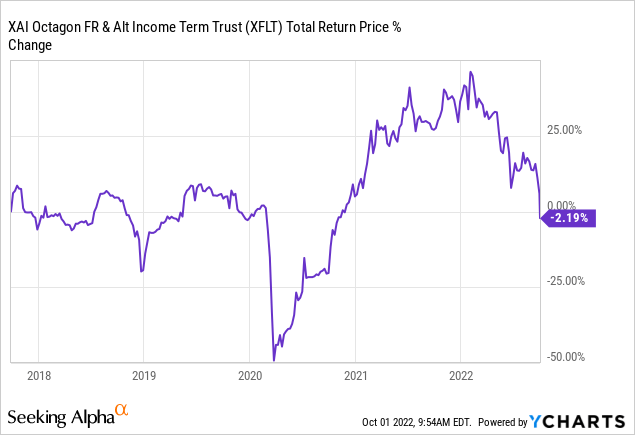
If somehow magically, XFLT earned 20% a year from here over the next 5 years, then total annual returns since inception would be 4%. Think about that.
Please note that this is not financial advice. It may seem like it, sound like it, but surprisingly, it is not. Investors are expected to do their own due diligence and consult with a professional who knows their objectives and constraints.
Be the first to comment