

guvendemir
Normally energy prices are very cyclical and the capex plans of oil majors follow this boom and bust pattern. This made the oil services companies that provide services to the big oil & gas companies also very cyclical, even more than their customers.
But after the Covid crisis and due to the energy transition to renewable energy, oil majors are very disciplined with their capex plans and this will make the energy sector more stable and the oil services companies less risky.
The oil services industry performed badly for years and took a big hit during the Covid crisis, but since then the trend is up. The valuation is still reasonable given the expected earnings growth for the coming 3 to 5 years. Our preferred ETF to play this theme is the SPDR S&P Oil & Gas Equipment & Services ETF (NYSEARCA:XES).
Oil services companies
The energy value chain can be classified under three broad categories: Upstream, Midstream, and Downstream.
Upstream concerns exploration and production (E&P): developing and extracting oil and gas. Downstream involves refining oil and gas into consumable products and delivering them to end users. Midstream energy companies connects the upstream with downstream.
Oil services companies primarily engage in providing support services to the (upstream) exploration and production players, like e.g. Chevron (CVX). Oil services companies, like e.g. Schlumberger (SLB) and Halliburton (HAL), provide equipment and services necessary to discover, produce, and bring oil to market. An example of such services is hydraulic fracturing: pumping water, sand, and various chemicals deep underground at high pressure to release oil and gas in tight reservoirs.
Energy market cycles
Historically, oil majors increase capex and production when oil prices are high. And at a given point supply is bigger than demand and prices collapse. This results in a cut in capex and at a given point demand surpasses supply and prices start rising again and the cycle starts over.
After the sharp drop in oil prices at the start of the Covid crisis oil prices rose sharply, but this time oil majors didn’t increase capex as much as they normally would.
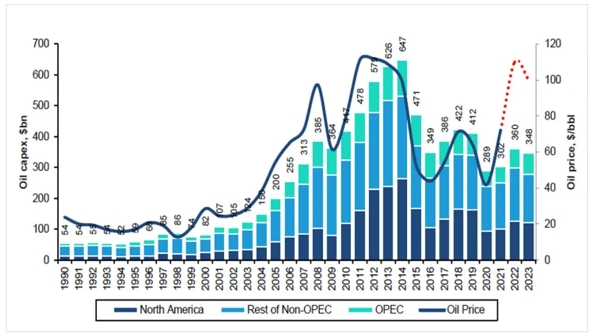
Figure 1: Oil capex vs oil price (Bernstein Energy)
The focus is more on leverage reduction and returning cash to shareholders. There is of course also the impact of the energy transition. Oil and gas look like a risky long term investment when everybody wants to switch as soon as possible to renewable energy.
But that switch will not happen overnight. Research by the International Energy Agency shows that the demand for fossil fuels will be around for many years to come. The share of fossil fuels in the total energy supply will only drop to 60% by 2050 in the Stated Policies Scenario (STEPS), which is based on today’s policy settings.
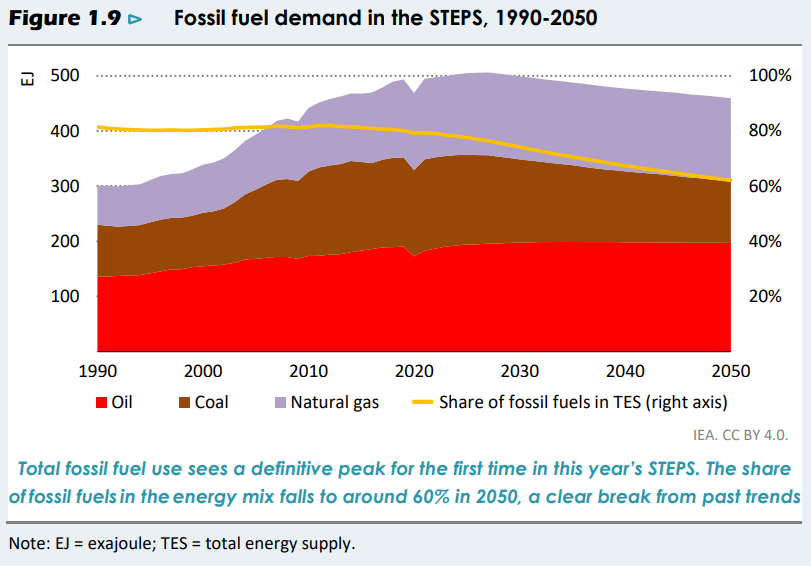
Figure 2: Fossil fuel demand (IEA)
To quote Mike Wirth, the CEO of Chevron, in an interview with the Financial Times: “Annual capital spending on oil and gas projects is now about half the rate seen in years before the pandemic, even though demand for the energy has continued to rise”.
It’s often said that the best cure for high oil prices are high oil prices, but this seems no longer the case. The low capex is supportive of high(er) energy prices.
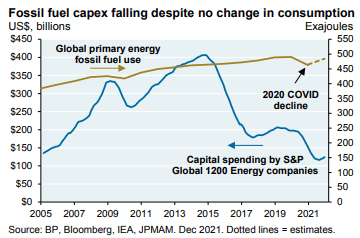
Figure 3: Fossil fuel capex (J.P. Morgan)
The result is a less outspoken cycle, a more stable and less volatile price environment.
Oil services industry cycles
The sensitivity of the oil services industry to the oil price is almost twice as high as the energy sector in general. This means that the volatility of the results and the share prices of oil services companies was quite high in the past. So, the lower capex plans of the oil majors will have a positive impact on the oil services industry.
But on the other hand have the lower capex plans undeniable a negative impact on the turnover of oil services companies.
Traditionally, oil and gas producers drilled for more oil when prices surged. That meant more drilling rigs were actively operating. When rigs are active they consume products and services produced by the oil service industry. The active rig count acts as a leading indicator of demand for oil services companies. Figure 4 shows for starters that in the past higher oil prices led to more capex and active rigs and vice versa. Secondly, Figure 4 confirms the low(er) capex following the price surge since 2020.
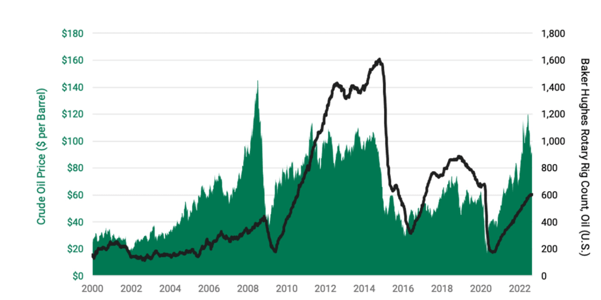
Figure 4: active rigs count (American Century)
The oil majors’ capex discipline offers the best of both worlds for oil services companies. The oil demand will remain that high that the oil companies will have to keep developing new oil rigs. At the same time, the volatility of the cycle will be diminished. No more boom and bust, or at least less than in the past.
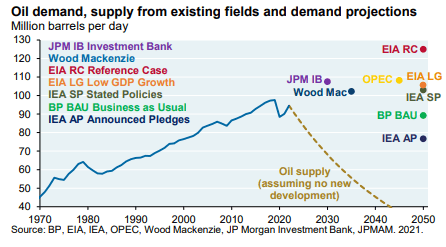
Figure 5: Oil demand and supply (J.P. Morgan)
The bottom line: sales will keep rising, and will do so in a less risky way than was the case in the past. And that growth can be considerable. State Street expects a 3-5 year EPS growth of 35% for the SPDR S&P Oil & Gas Equipment & Services ETF.
XES
The SPDR S&P Oil & Gas Equipment & Services ETF is our favourite ETF in the oil services industry.
Below you can find the top 10 holdings to get an idea what’s inside the ETF.
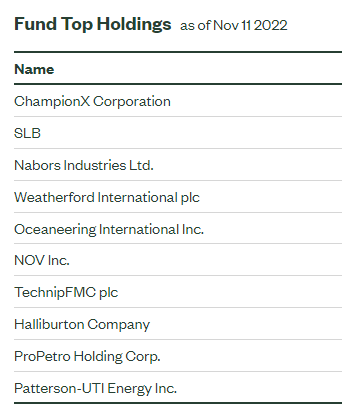
Figure 6: Top 10 holdings (SPDR)
Three quarters of the ETF are in the equipment and services sub-industry and the remainder belongs to the drilling sub-sector.
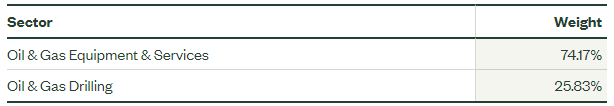
Figure 7: Sector weights (SPDR)
Like the two other oil services ETFs, the iShares U.S. Oil Equipment & Services ETF (IEZ) and the VanEck Oil Services ETF (OIH), XES is in a strong uptrend. We prefer XES because it has the lowest expense ratio and the cheapest valuation.
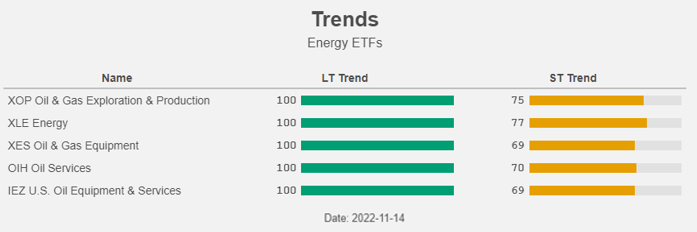
Figure 8: Trend (Yahoo! Finance, Author)
The oil services companies aren’t really cheap and XES has a dividend yield of only 0.6% and the forward P/E is 24.4.
For higher yielding investments in the energy sector, you can always take a look at the ALPS Alerian Energy Infrastructure ETF (ENFR).
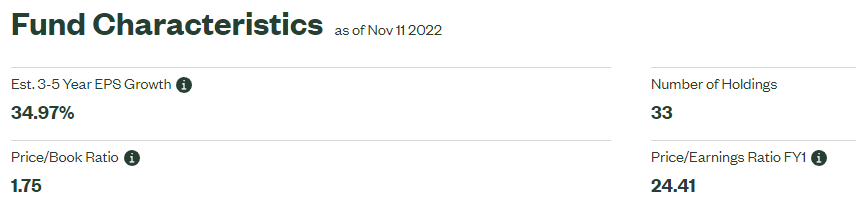
Figure 9: Fund characteristics (SPDR)
But we are nevertheless positive given the high expected growth rates, the lowered risk profile and the positive macro backdrop for the energy sector.
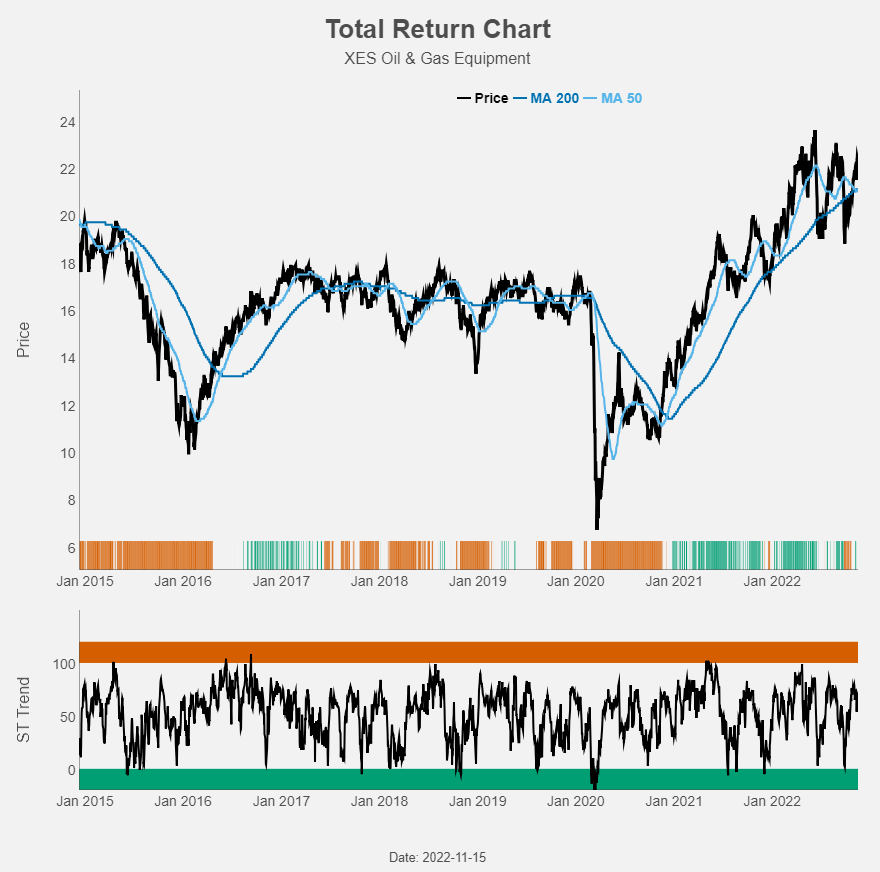
Figure 10: Total return chart (Yahoo! Finance, Author)
What could go wrong?
Everything that disturbs that favourable backdrop could endanger our positive outlook.
A strong drop in demand caused by e.g. a recession could lead to lower oil prices. But the drop in oil prices would need to be very severe in order to lower the already low capex plans of the oil majors.
And everything that increases supply could also cause energy prices to drop. Continued releases of strategic oil reserves, an OPEC production increase, an end to Western sanctions against Russia… All three seem very unrealistic. We think that a decrease in demand is much more a possibility compared to an increase in supply. It remains to be seen to what extent this lower demand is countered by an OPEC production cut.
Conclusion
The oil majors’ capex discipline creates a perfect scenario for oil services companies: more stable energy markets with a slowly but surely growing production. This renewed stability replaces the past “boom and bust” environment with its wild swings in energy prices, oil production and oil services business.
Given the high expected earnings growth, the valuation is reasonable even after the nice recent performance. The trend is still clearly up. We prefer the SPDR S&P Oil & Gas Equipment & Services ETF: buy and let your profits run.
Be the first to comment