

Editor’s note: Seeking Alpha is proud to welcome BioPharmCatalyst as a new contributor. It’s easy to become a Seeking Alpha contributor and earn money for your best investment ideas. Active contributors also get free access to SA Premium. Click here to find out more »
sanjeri
Biotech was the darling of both seasoned and armchair investors throughout the pandemic, with SPDR S&P Biotech ETF (NYSEARCA:XBI) peaking as high as $175 in February 2021. The rapid growth in the fund has since receded, touching lows last seen in 2016 and 2020. As of October 2022, XBI has been down 26% since January and down 33% since the same time last year.
Now as tourist investors from the pandemic-fueled rally have left, and the macroeconomic environment is changing, biotech too, will find itself correcting with the rest of the market, providing opportunities for investors to capitalize on the changing times. It would be naive to not consider the factors that have brought biotech lower in recent months, as well as not analyze the ever-changing playing field. In this article, we strive to cover the historical price action of XBI and explore how the past year lays the groundwork for two possible futures. As a biotech investor, you have two ways to consider today’s circumstances – a glass half empty or a glass half full. We will analyze the fundamentals behind XBI, the rich catalysts that lay ahead and the historical performance to support our view that XBI is a glass half full. All things considered, we assign a Hold rating on XBI.
XBI Overview
XBI is an Exchange Traded Fund (ETF) that has exposure to US small- and micro-cap biotech stocks in its equal-weight portfolio. XBI’s investment goal is to provide results that generally follow the total return performance of the S&P Biotechnology Select Industry Index. XBI provides a unique investment focus, as its holdings are largely small and mid-cap biotech firms rather than larger pharmaceutical companies such as Pfizer (PFE) and Johnson & Johnson (JNJ). Additionally, because it is equal weighted it provides a better picture of the current biotech sector health, and insulates an investor from single stock risk, as the volatility of biotech companies can result in major drops in stock price.
Since its inception XBI has had a 10.62% return, when measured by month end, and over the last 10 years has a 11.34% return. However, the downturn in in recent years has soured the fund’s performance, with a loss of 37% over the year and 25% year to date (YTD). XBI did however make up for lost ground, following the larger market rally in July and August. Today XBI trades at a $83 price point, with $7,101.18 million assets under management.
Benchmark
XBI has a quarterly distribution for shareholders with a 0.20% yield. Similar to the fund’s performance, returns after taxes on distributions have been measly over the last year, but recently picking up with a 12.8% return in the third quarter. While XBI has traded in-step with the underlying index over the last year it has trailed the SPDR S&P 500 ETF Trust’s (SPY) performance, currently down 39% as compared to SPY’s loss of 23% YTD. However, over time, and especially during the peak of the pandemic, XBI has outperformed the benchmark, in 2018, 2020 and 2021. Interestingly, while XBI tends to be a more volatile position than the SPY, its beta has dropped to 0.565 as of late.
Holdings
XBI’s portfolio consists of 153 biotech companies, with Biogen (BIIB), IVERIC bio Inc. (ISEE), and ACADIA Pharmaceuticals Inc. (ACAD) leading the holdings.
Per our assessment, we note that innovation is undoubtedly present in the fund, but identified that of the 153 holdings, 20 of the companies have only an estimated 12 months of cash or less to continue to fund operations. bluebird bio (BLUE), for example, has only an estimated month of cash remaining but makes up 1.14% of the fund, ImmunityBio Inc. (IBRX) and Sorrento Therapeutics Inc. (SRNE) are other names with low cash holdings that are 0.34% and 0.7% of the fund respectively.
However, despite some limited dilution risk, XBI does hold other companies of interest with upcoming catalysts to watch. There are 10 low float (<20 million) companies in XBI, of which 7 have upcoming catalysts due in 2022 or 2023. Many of these account for a significant portion of the fund such as Prothena Corporation plc (PRTA) (0.974%) and Madrigal Pharmaceuticals Inc. (MDGL) (0.772%). Both companies that do not have an approved drug will be releasing data from a Phase 1 and Phase 3 trial respectively.
Glass Half Empty
XBI Levels vs. History
The peak of biotech hit in February 2021 as biotech companies were continuously being pumped with funding in hopes of capitalizing on the COVID-19 pandemic. This attention both from venture capitalists and investors developed inflated valuations for many of these companies.
A similar peak in XBI price occurred in mid 2015, which turned after regulatory discussions sparked by presidential candidate Hillary Clinton and congressional attention on the drug pricing practices of Valeant Pharmaceuticals (currently Bausch Health Companies Inc. or BHC) had investors worried about valuation potential for approved drugs in a heavily regulated market. By May 2016, XBI was down 25% for the year.
Michael Batnick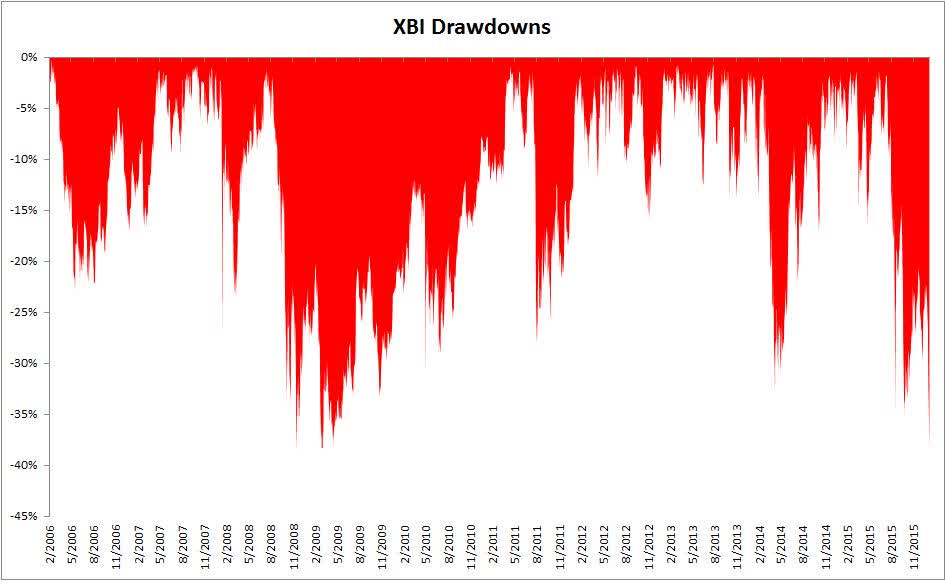
Truthfully, an aged biotech investor will have experienced major XBI drawdowns since the ETF’s inception. XBI itself has historically been more volatile than the S&P 500 and the Direxion Daily S&P Biotech Bull 3X Shares ETF (LABU), which triple leverages XBI and provides higher volatility exposure to an already volatile market. It makes sense then that LABU, which was once as high as $180 per share, is now trading at a mere $7 per share. Without signs of relief, the expectation of a continued downtrend is a reality that may come to fruition, and a reality that investors should prepare for.
Long-term Patterns; Possible Continued Drops
Trading View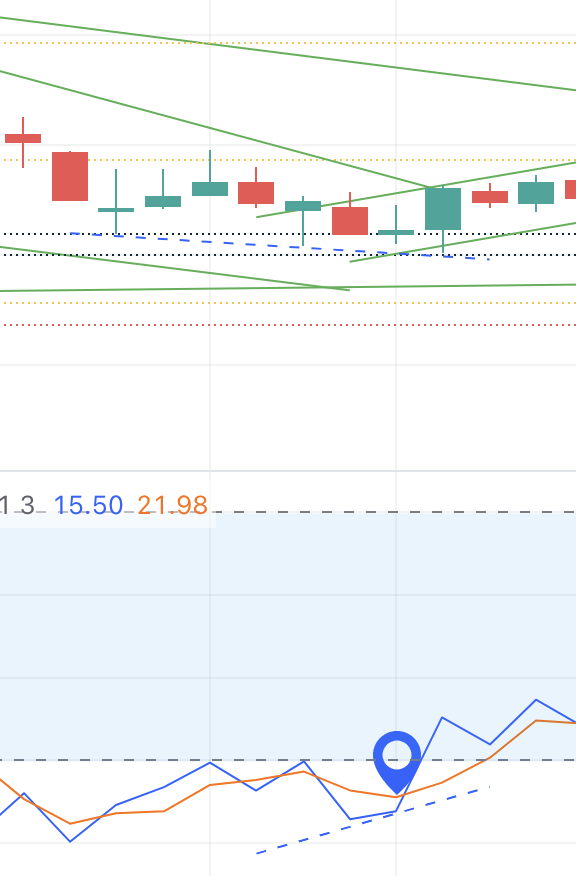
The chart pattern of XBI has been trading in a strong descending channel pushing through support lines – prices where the stock downtrend can be expected to pause due to a concentration of demand or buying interest – at $118 and $80. XBI is now testing the $76 support, a line reached most recently twice this October. A continued test of this support could lead to a breakout down as low as $62 or $45, a price last seen in 2016.
Some bullish patterns have emerged such as in early March when the Stochastic Oscillator, a momentum indicator, diverged from the movement of XBI’s price. As XBI’s price dropped, the Stochastic Oscillator increased, causing a month-long ascending channel. Similarly, biotech rallied in the month of July, following the larger market’s optimism in spite of rising inflation and hawkish FED hikes. However, despite the rallies this year, XBI has consistently reverted back into its downward trend.
Similar bearish trends were noted during that drop of 2016, and continued until a reversal breakout into an ascending parallel bullish channel after its low bounced from the $45 support. This bounce up continued from 2016 to 2018, gaining back much of the lost value. While we can hope for the support to hold, XBI had pushed through previous support at $118 and $76 in recent months, leaving little optimism to rely on.
CNBC 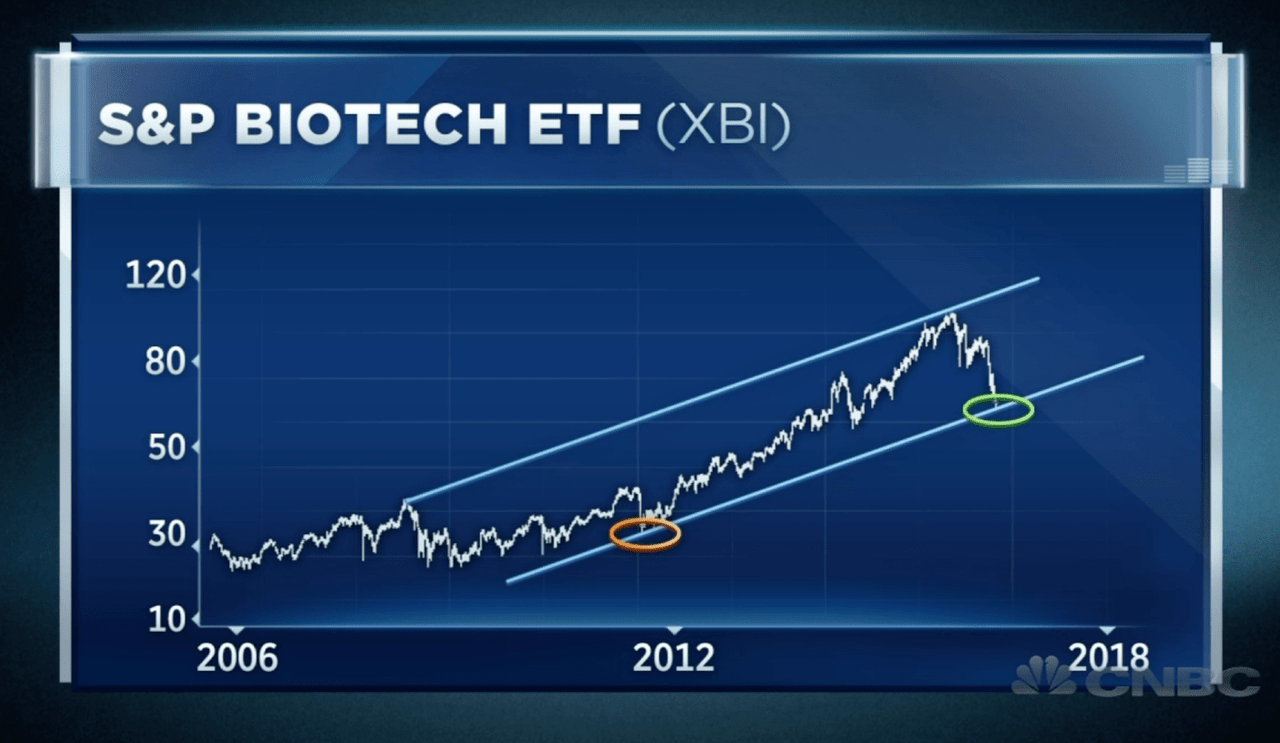
XBI Risks
The inherent volatility of biotech, as previously mentioned, is a significant risk for an investor. Someone with the view that XBI is a glass half empty can note that its historical performance and sector focus does not provide enough diversity to withstand larger macro economic uncertainty. As investors watch both the Federal Reserve’s next moves, undoubtedly, continued interest rate hikes or a strong recession may continue to push XBI to previously tested supports. As compared to SPY, the XBI has only outperformed in strong times for biotech (ex. the 2020 Pandemic), and tends to underperform in times of market weakness. This trend may continue to be applicable, pending larger market trends going into next year. Additionally, as biotech itself, and thus the companies that make up XBI, is largely pre-revenue and a debt-heavy sector, the increasing expense of financing a new drug may leave catalysts, approvals, and price-moving deals few and far between. Moreover, the passage of the Inflation Reduction Act may have longer-term implications on the amount of revenue a company can expect to receive following approval. Thus far, XBI has continued to trade in the downward channel since its peak in February 2021, and while we remain optimistic that catalysts and the fundamentals of XBI could provide strength in the long run, this is a long-term trend line that XBI has yet to break out of.
Glass Half Full
Returns from Drawdowns
While the bleak market may incentivize traders to stay away, in our view it also provides an opportunity for the diligent and researched traders. While a major market shift that quickly reclaims the loss of XBI over this year is highly improbable (though we wish markets could rise as quickly as they can fall), a breakout into a bullish trend is still possible.
Janus Henderson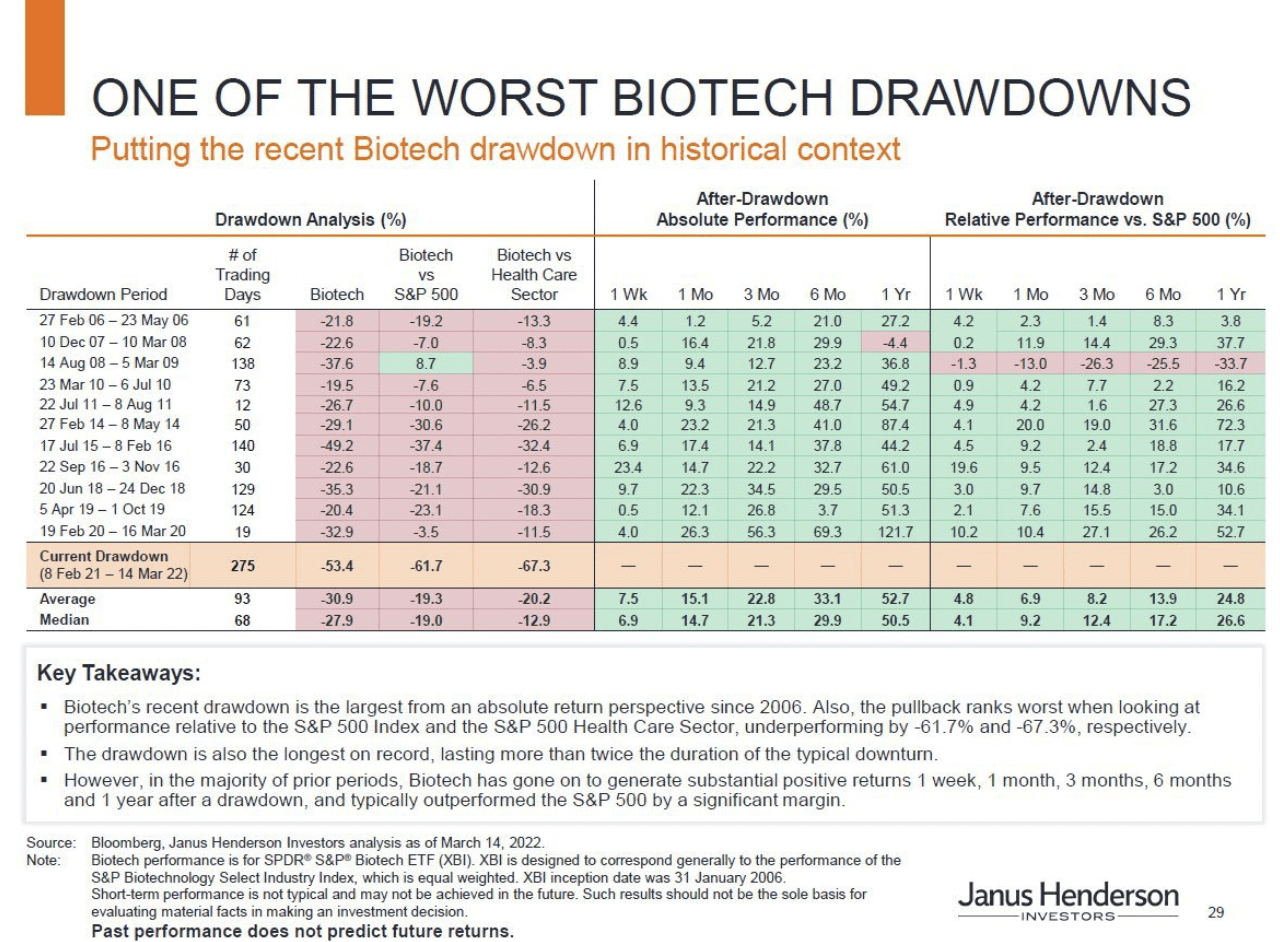
This phenomena has happened in previous drawdowns such as gaining 44% after one year from Feb 2016, 50.5% from 2018, and an average return of 52.7% across all drawdowns since XBI’s inception. This means biotech is ripe for opportunity as the flooded market gets thinned.
The previously mentioned risk due to the volatility of biotech, we believe, comes with major awards. In a study from 2016, a biotech investor who bought XBI at inception, would have been in a “10% drawdown 51% of the time and in a 20% drawdown 25% of the time. For this pain they would have experienced a 257% return over the next decade, compounding their wealth at 13.7% a year.”
Bloomberg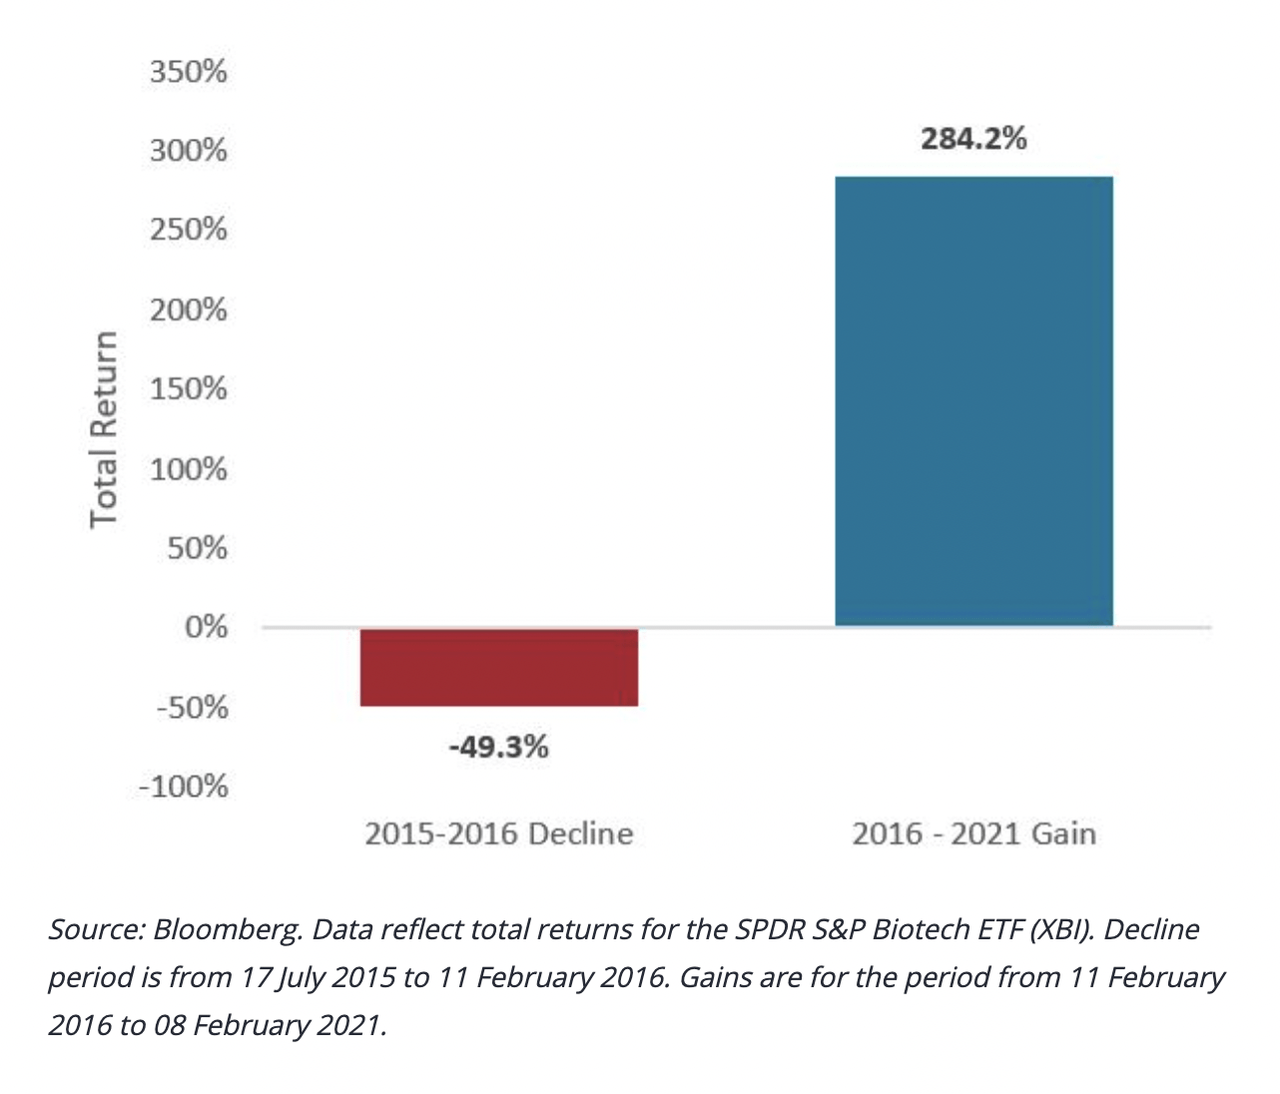
The ~50% historical returns from just a year after drawdowns can entice new investors that bring momentum to push biotech out of bear territory. While not all biotech companies will experience this return, an ETF, such as XBI, offers company diversification, preventing some risk and allowing for exposure to potential gains across the market.
Much of what we are experiencing is largely fundamental, the oversaturated market we had in 2021 is readjusting in order to price companies of value accordingly.
Possible Signs for a Turnaround
In recent days we have seen biotech start to readjust. Since earlier this year biotech, biotech has increased its strength, supported by mergers and acquisitions, as well as sector fundamentals. Since then, biotech has increased its ranking on the Investor Business Daily’s Relative Strength Rating, jumping from number 143 out of 197 industries to 96. This increase placed biotech in the top 4% of all industries in terms of six-month performance. This has translated into XBI’s performance, bringing it back up from recent lows at $60.
Other analysts and experts see the potential as well. Macro analyst Larry McDonald at The Bear Traps wrote in May that XBI could go up 20% to $83 in a shorter-term countertrend rally, a mark it well exceeded by July. He continued, and noted a possible 30% rise to $90 or more by mid-2023, based on the 50- and 100-day moving averages. Other analysts argue that a larger market catalyst such as M&A activity, consistent FDA regulatory behavior, and strength from the larger market could push biotech out of its darker days.
Vettafi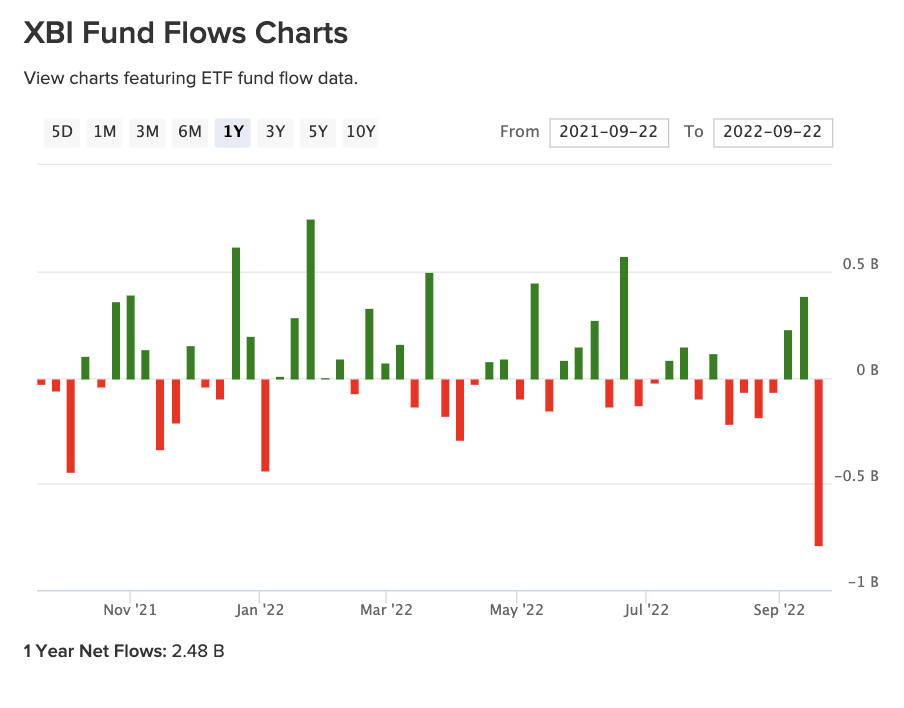
Furthermore, while the most recent drop in fund flows for XBI is negative by over $.5 billion, the one-year flow for XBI has remained positive at $2.48 billion. Fund flows are a momentum indicator and closely track overall market moves. However, the relationship seems hard to pinpoint for XBI and biotech.
XBI Signals
From the 2016 drawdown of XBI, an investment from the bottom $45 doubled by 2018 and returned to trade at $99.
A similar pattern may occur today with a deep drop which continues into a prolonged rally to reach previous peaks. While in the very short term, the drop in biotech is being pushed by market forces, as they subside a rally up could follow historical patterns.
On a short-term level, XBI’s chart could be displaying an inverse head and shoulders formation a pattern that investors consider to be among the most reliable trend reversal patterns – it is appearing with a resistance/neckline at $95. An inverse head and shoulders can be an indicator of a reversal from a downward trend and, if it breaks out, can signal a bull market. While larger macro events, such as the reaction to an additional interest rate hike by the FED, have pushed XBI’s price below the pattern’s right shoulder lower, a rise in price to complete the pattern could lead to a bullish breakout.
TradingView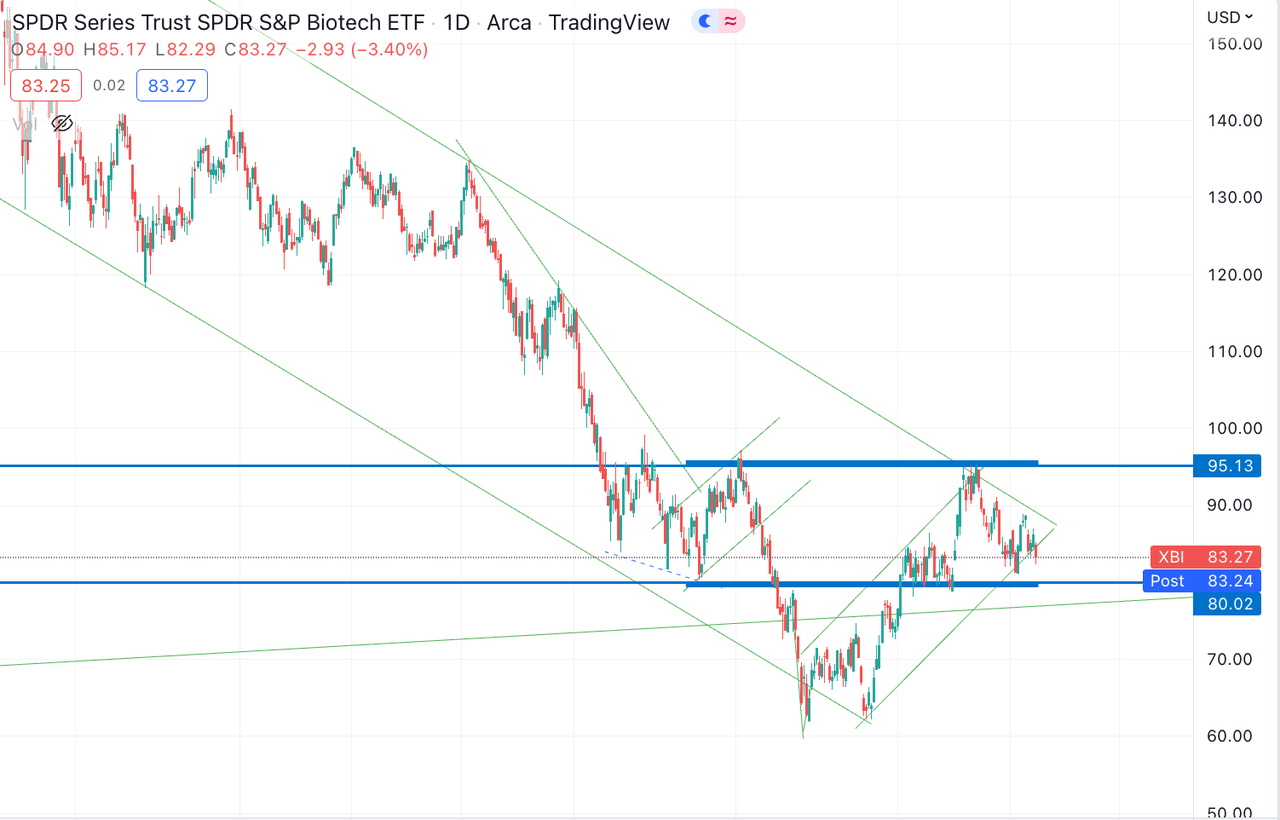
Based on the share price being above its 5-, 20- and 50-day moving averages, the current trend is considered strongly bullish. When looking at the 20-, 50- and 100-day moving averages, they also have a bullish lead, and a buy opinion.
The Science Behind Catalysts
Favorably, market sentiment and economic factors do not change science. In our view, while company valuations may drop, developments in Nonalcoholic Steatohepatitis (NASH), oncology, and clinical use of gene and cell therapies are setting the foundation for groundbreaking medical achievements. Where science is continuing to innovate, one can be hopeful for the profit that follows. In the third quarter, of 84 binary events considered by Evercore, 60% of them were considered positive. The report also noted a positive 8% reaction to recent FDA approvals, which outperformed historical data.
The most recent disappointments in novel treatments may be hard to withstand for the faint of heart; however, this is largely the process that these therapies will need to experience in order to reach patients. Historically, temporary roadblocks were seen in the development of monoclonal antibodies in the 1990s, with Centoxin in 1992 or Campath-1H’s in rheumatoid arthritis. However, without these setbacks, it would not have made the monoclonal antibodies mainstream today, now a global market of $157.33 billion.
Likewise we have still seen clinical developments reap benefits for investors throughout this depressed market.
Kezar Life Sciences, Inc. (KZR) shares traded up 75% at $10.09 following its announcement of data from its Phase 2 MISSION trial of zetomipzomib to treat active lupus nephritis (LN). 64.7% of patients achieved an overall renal response of 50% or greater reduction in urine protein to creatinine ratio (UPCR) at 6 months and 35.2% achieved a complete renal response.
As well as have major catalysts that we are still awaiting such as conferences like the American Society of Hematology (ASH) Annual Meeting being held December 10-13, 2022.
Merger and Acquisition Potential
Another important market catalyst to continuously monitor is M&A activity. As consolidation starts to take place, this will not only thin an oversaturated market but also provide direct benefits to direct investors or ETFs like XBI that hold the company. Many mega- and large-cap companies are sitting on COVID-19 cash and have billions at risk in the coming years due to the expiration of patients on household names like AbbVie Inc.’s (ABBV) Humira, and Merck’s (MRK) Keytruda. These companies will be looking at a market with valuations beaten down, and billions at their disposal.
Evaluate 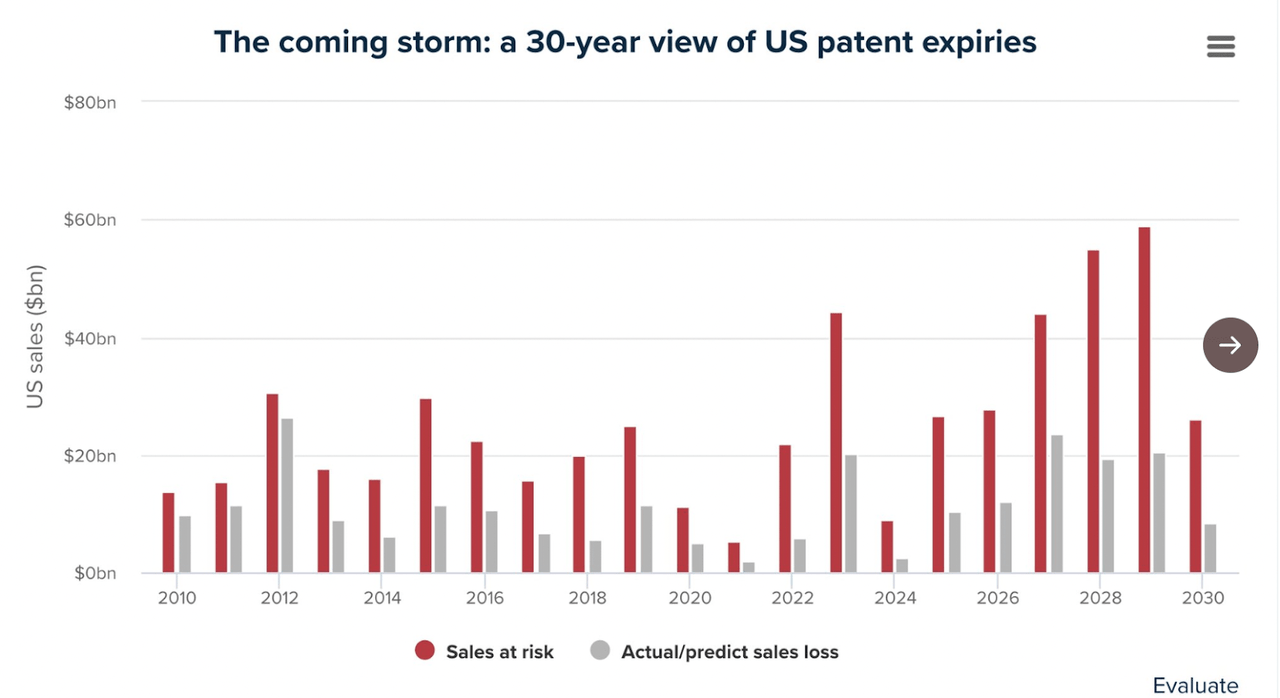
PWC noted in a mid-year analysis that both size and value of M&A deals for biotech and medical device companies has decreased since 2021. Countering PWC’s analysis, Chimera Research Group noted that M&A deals for 2022 total 26, relatively similar to 2021’s 25 deals, 2020’s 23, 2019’s 28, and 2018’s 16. Both firms do make the observation that with these characteristics, additional deals are expected to pick up in the last half of the year.
For any investor it is then important to identify companies with licensable assets, and previous relationships with large caps, to provide guidance on where consolidation or licensing deals may take place. Gains as seen with Catalyst Biosciences’ (CBIO) deal with Vertex Pharmaceuticals (VRTX) which pushed Catalyst shares up 234%, Acquisitions such as Pfizer’s acquisition of Global Blood Therapeutics Inc. (GBT), and Amgen’s (AMGN) of ChemoCentryx Inc. (CCXI) also highlighted a recent emphasis on M&A transactions for companies with commercial pipelines, and lower upfront payments for preclinical programs this year. These companies not only jumped off the news, but were/are holdings of XBI, sending gains for the ETF.
Fundamental Advantages
Currently XBI is trading well below its peak at $170, and recent highs of $93. From our analysis, we view XBI as cheap and undervalued considering the catalysts and science underlying each company in its holdings. XBI also provides enough diversity to hedge any risk of investing in a single company that could have a drug fail in a late-stage trial, while provided a more specified attention to small- and mid-cap developments than its fund competitors.
For example, iShares Biotechnology ETF (IBB) also provides exposure to the biotechnology industry, but because it is not equal weighted, it prevents investors from reaping the same returns as it would in the XBI. Additionally, IBB’s larger concentration on bigger pharmaceutical companies does not give it the same ability to rise in price following a small cap’s successful catalyst. Per our analysis, when biotech companies are doing well with plenty of meaningful catalysts and M&A activity, XBI outperforms IBB.
YCharts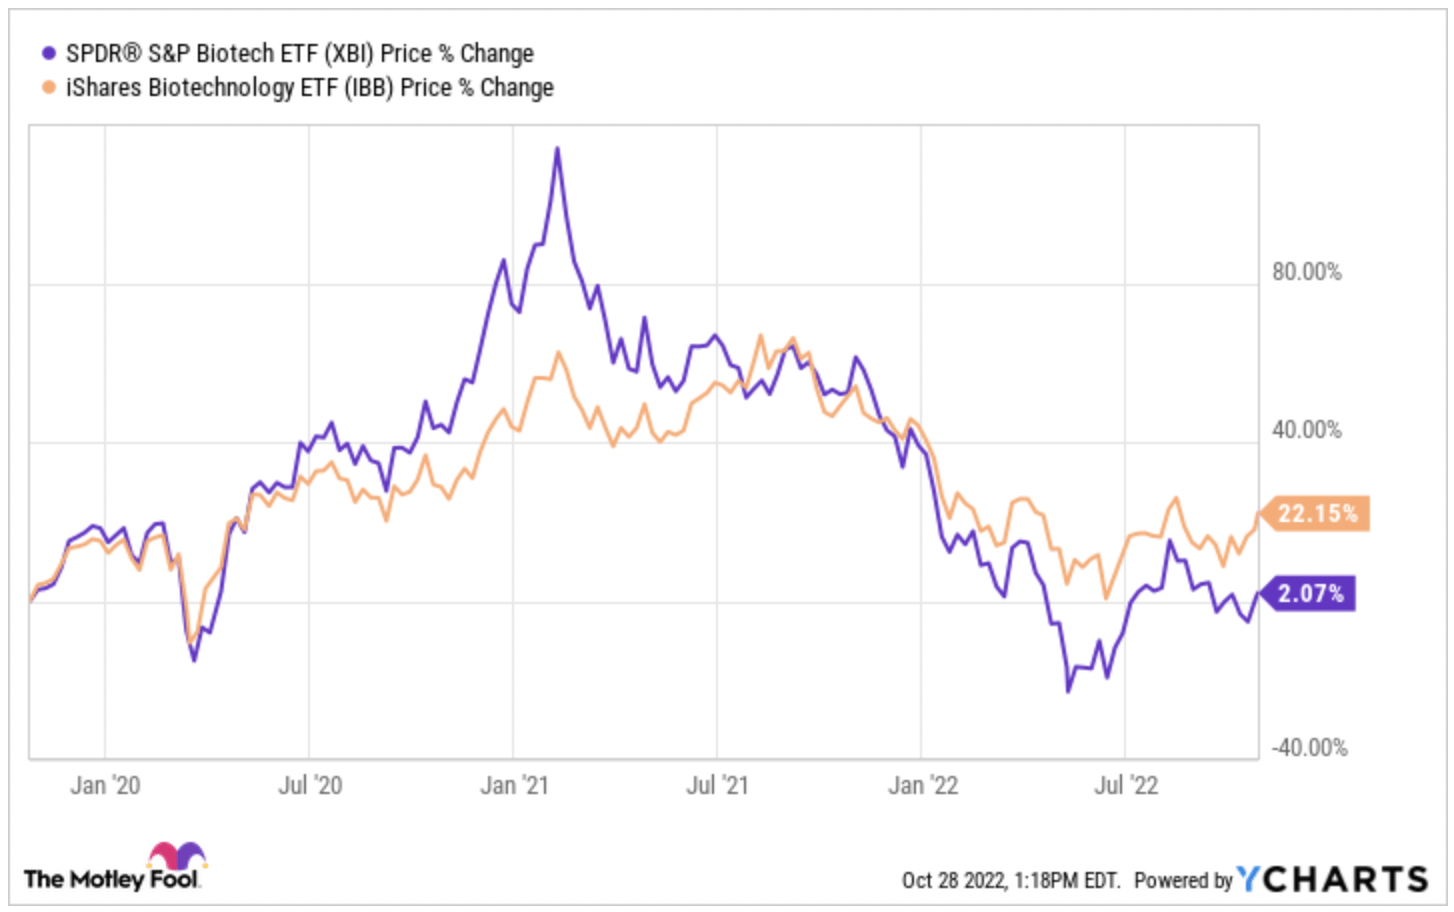
Conclusion: A Glass Half Full
We view XBI as an investment opportunity that may be looked over, but has potential for growth. While more short-term timeframes may be subject to the larger macroeconomic environment, we do not think that XBI’s current depression will continue in the long term. Despite the rise in interest rates, inflation, and talks of a recession, XBI will continue to hold companies conducting life-changing science and bringing new treatments to market. While the current drawdown in biotech is the largest in history, this reality provides an opportunity for XBI… it really all depends on how you want to look at it.
Be the first to comment