

KEY POINTS:
- WTI Under Pressure as China Reports Biggest Daily Jump in Covid Cases in Six Months.
- US API Data Indicate a Build Up in Inventories.
- WTI Prints an Evening Star Candlestick Formation, Hinting at Further Downside.
Recommended by Zain Vawda
Get Your Free Oil Forecast
MOST READ: Crude Oil Trading Strategies and Tips
WTI Fundamental Outlook
Crude Oil continues to struggle this week and looks on course for its third successive day of losses. Demand fears have returned as China reported its biggest daily jump in covid cases in six months. This morning news filtered through that China’s Guangzhou has locked down another district which is likely to weigh further on oil prices.
Oman Minister of Energy Salim Al-Aufis initial comments yesterday added further pressure on oil prices. The Minister stated that current prices are not sustainable with his belief that prices will retreat to the $70-$80 a barrel range after the winter season. He commented on the upcoming OPEC+ meeting scheduled for December 4, stating that any decision would largely be based on the economic outlook from Europe. If the message out of Europe regarding a recession and higher interest rates remain the same OPEC+ may decide on further cuts.
Trade Smarter – Sign up for the DailyFX Newsletter
Receive timely and compelling market commentary from the DailyFX team
Subscribe to Newsletter
US API data on oil stocks released yesterday indicated an increase of inventories by 5.61 million barrels for the week ended November 4. The increase in inventories comes at the wrong time as US domestic demand has showed signs of a slowdown weighing further on prices.
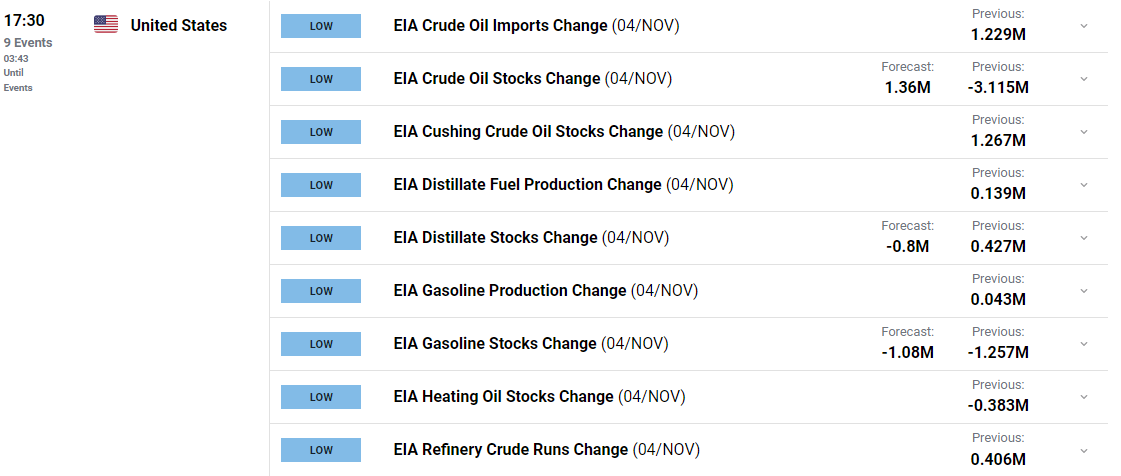
The Energy Information Administration (EIA) meanwhile published its short-term energy outlook yesterday in which it continued its trend of cutting forecasts regarding US supply growth for 2023. The Energy Agency now expects output to grow by 490 million barrels a day YoY in 2023. Later in the day we have a bunch of data from the EIA which could further weigh on oil prices.
For all market-moving economic releases and events, see the DailyFX Calendar
WTI Crude Oil Daily Chart – November 9, 2022
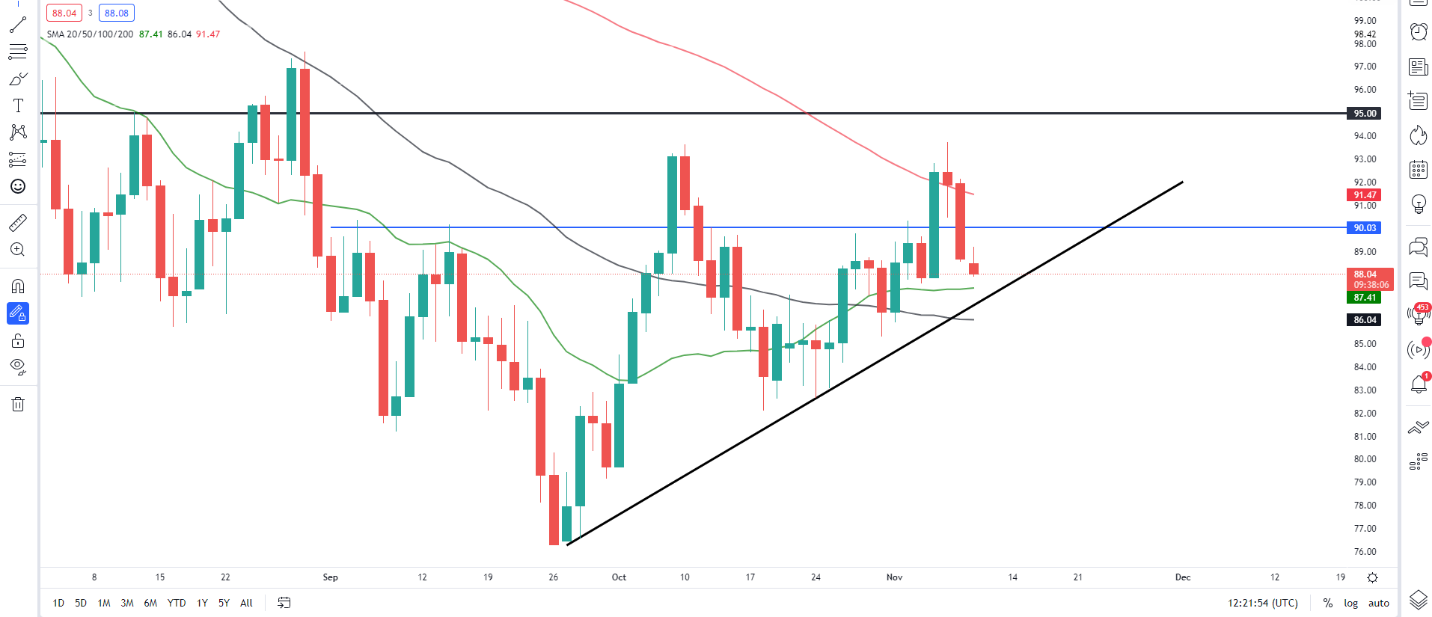
Source: TradingView
From a technical perspective, WTI began the month on the front foot following its first month of gains since May. However, since printing a new high early on Monday oil prices have seen a sharp slide back below the psychological $90 level.
The daily timeframe has printed an evening star candlestick formation which hints at further downside ahead. There is a confluence area just below current price around the $86-$87.50 area. There is an ascending trendline coupled with the 20 and 50-SMA which could potentially halt further losses.
Starts in:
Live now:
Nov 15
( 03:11 GMT )

Recommended by Zain Vawda
Weekly Commodities Trading Prep
Resources for Traders
Whether you are a new or experienced trader, we have several resources available to help you; indicators for tracking trader sentiment, quarterly trading forecasts, analytical and educational webinars held daily, trading guides to help you improve trading performance, and one specifically for those who are new to forex.
Written by: Zain Vawda, Market Writer for DailyFX.com
Contact and follow Zain on Twitter: @zvawda
Be the first to comment