

NanoStockk
I recently wrote a contrarian bullish article on the Templeton Dragon Fund (TDF) that highlighted the squeeze potential in Chinese equities.
While I am contrarian bullish on Chinese equities, I am hesitant to buy the Direxion Daily FTSE China Bull 3x Shares ETF (NYSEARCA:YINN) due to the volatility decay of levered ETFs. While nimble traders may enjoy the positive convexity from levered ETFs like YINN, I worry that the upcoming rebound could be volatile (with lots of up and down days) and will eat away at potential returns. I am much more comfortable expressing my contrarian bet through unlevered funds like the TDF or FXI.
Fund Overview
The Direxion Daily FTSE China Bull 3x Shares ETF gives investors 3x levered exposure to Chinese equities. The YINN ETF has almost $200 million in assets and charges an expense ratio of 0.95%. It does not pay any distributions.
Strategy
The YINN ETF seeks daily returns that are 3x the return of the FTSE China 50 Index (“Index”).
The Index consists of the 50 largest and most liquid public Chinese companies currently trading on the Hong Kong Stock Exchange. The index constituents are weighted based on total market value and the index weight is capped at 9%. An unlevered ETF that is based on the same index is the iShares China Large-Cap ETF (FXI).
The fund achieves its 3x daily levered return by holding shares of the FXI ETF and entering into total return swaps with the large investment banks that are reset nightly (Figure 1).
Figure 1 – YINN ETF holdings (direxion.com)
Positive Convexity And Volatility Decay Of Levered ETFs
I have recently written several articles on the pros and cons of levered ETFs. Readers interested in the mechanics of how these ETFs work can consult one of my prior articles. Essentially, levered ETFs have ‘positive convexity’ in the direction of the bet (exposure gets bigger as price moves in your favour) and suffer losses from ‘volatility decay’ (daily exposure resets cause levered ETFs to lose value over time).
While levered ETFs like the YINN are advertised as short-term trading vehicles (since they are designed to provide levered 1-day returns of the index), some traders use them to express medium-term views and take advantage of the positive convexity.
For example, measured from the COVID lows on March 19th 2020 to the cycle highs on February 16th 2021, the unlevered ETF FXI returned 61.3%. However, the 3x levered YINN ETF returned 241.1%, almost 4x the return of the unlevered ETF (Figure 2).
Figure 2 – YINN ETF positive convexity (Seeking Alpha)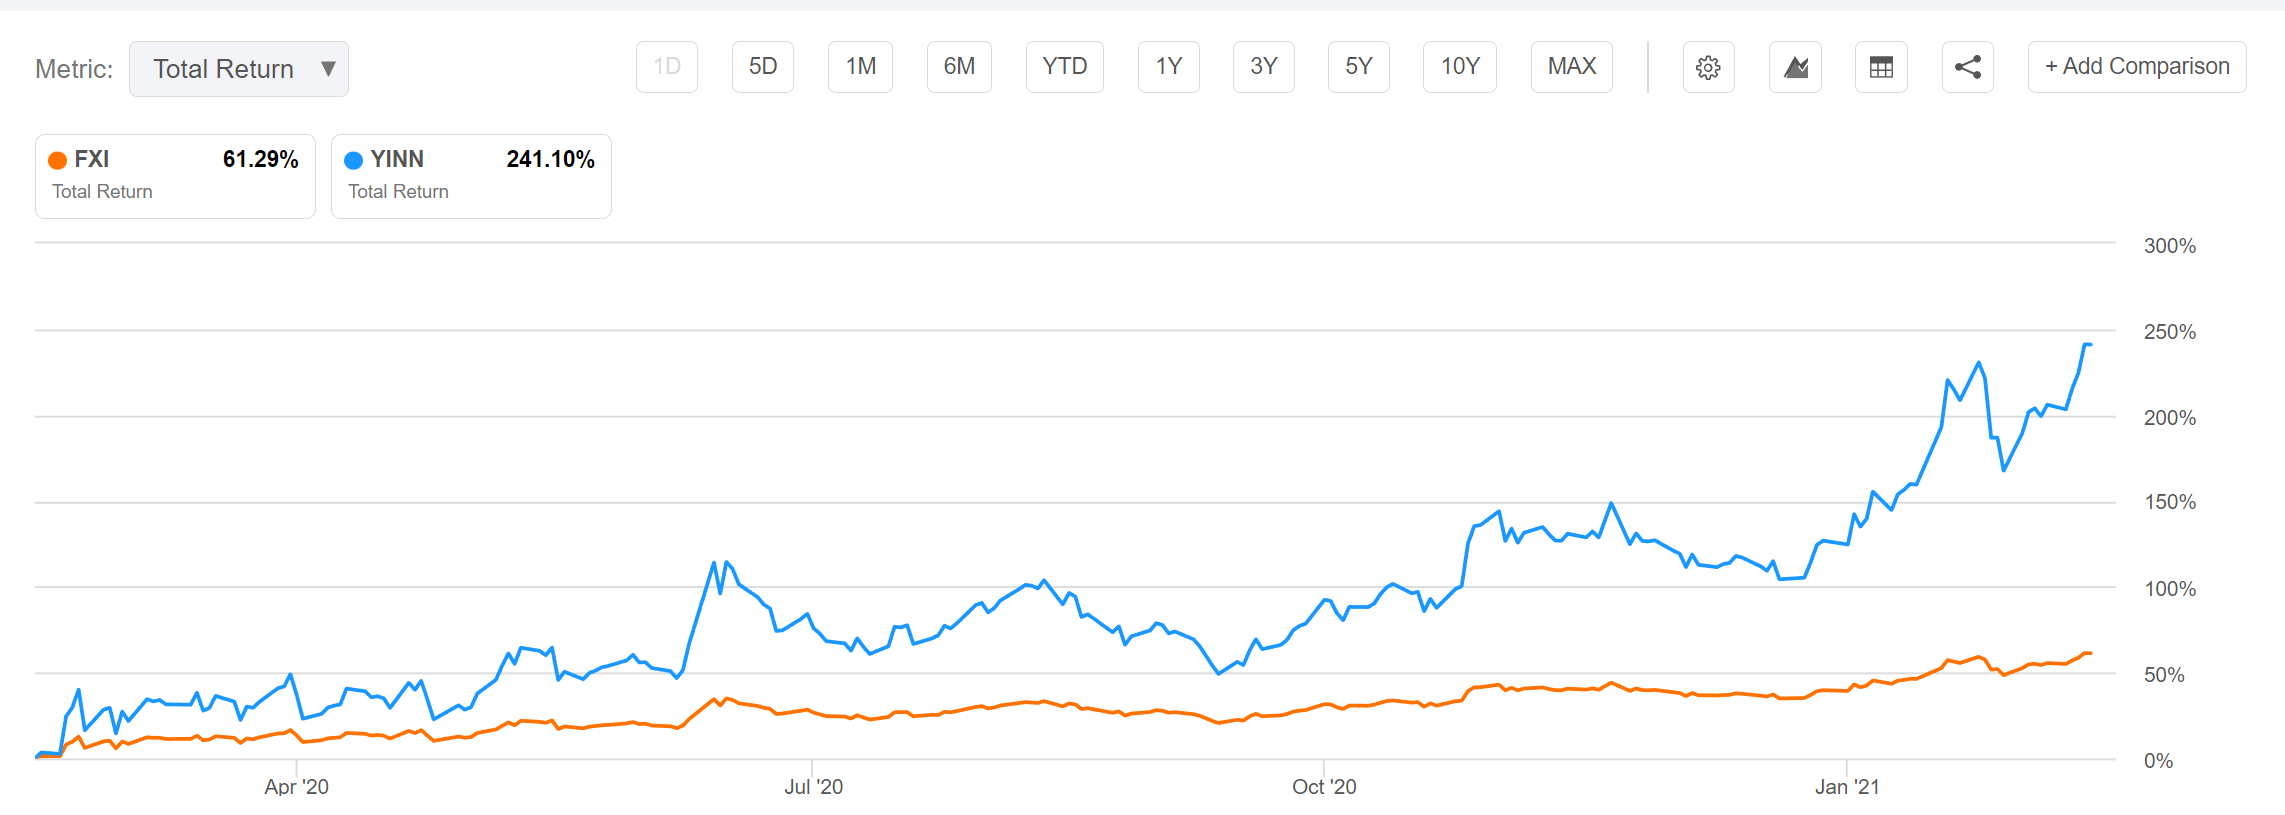
Returns
With the poor performance of Chinese equities in the past two years, it is no surprise that the YINN ETF has suffered catastrophic losses. The YINN ETF has returned -88% YTD and -91.1% in the past year. On a 3Yr and 5Yr basis, it has generated average annual returns of -61.7% and -49.7% to October 31, 2022!
Figure 3 – YINN have seen catastrophic losses (direxion.com)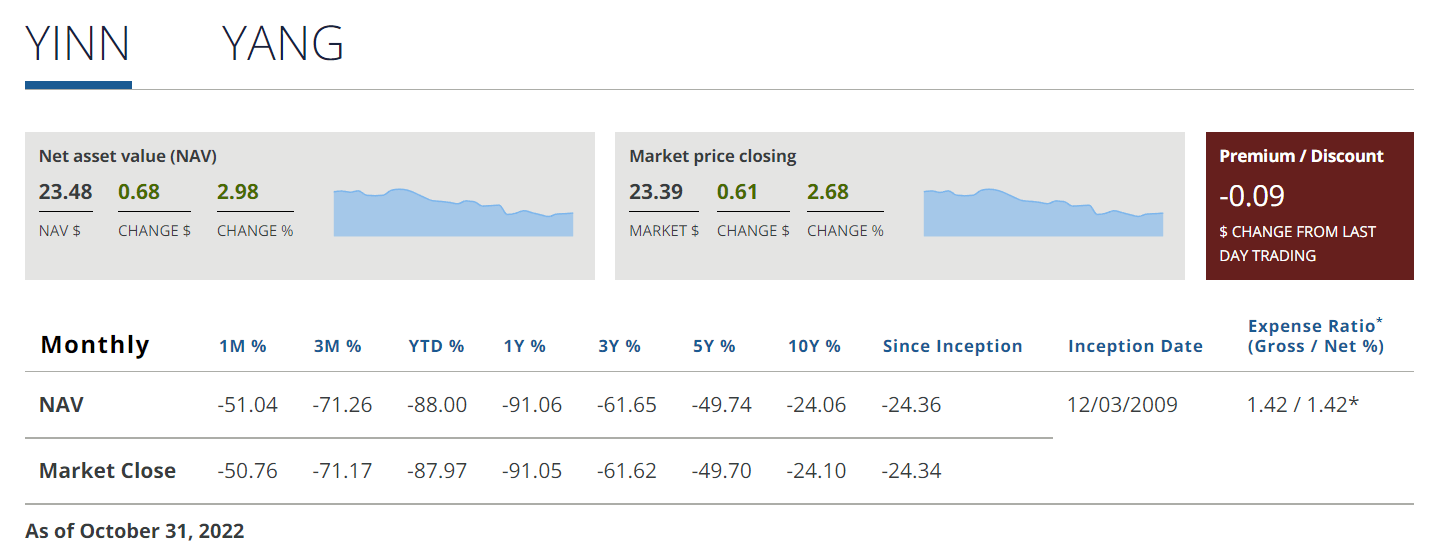
Basically, $100 invested 3 years ago at a split adjusted $353.61 was worth only $6.15 on October 31, 2022, with the price at $21.74 (Figure 4).
Figure 4 – YINN price chart (stockcharts.com)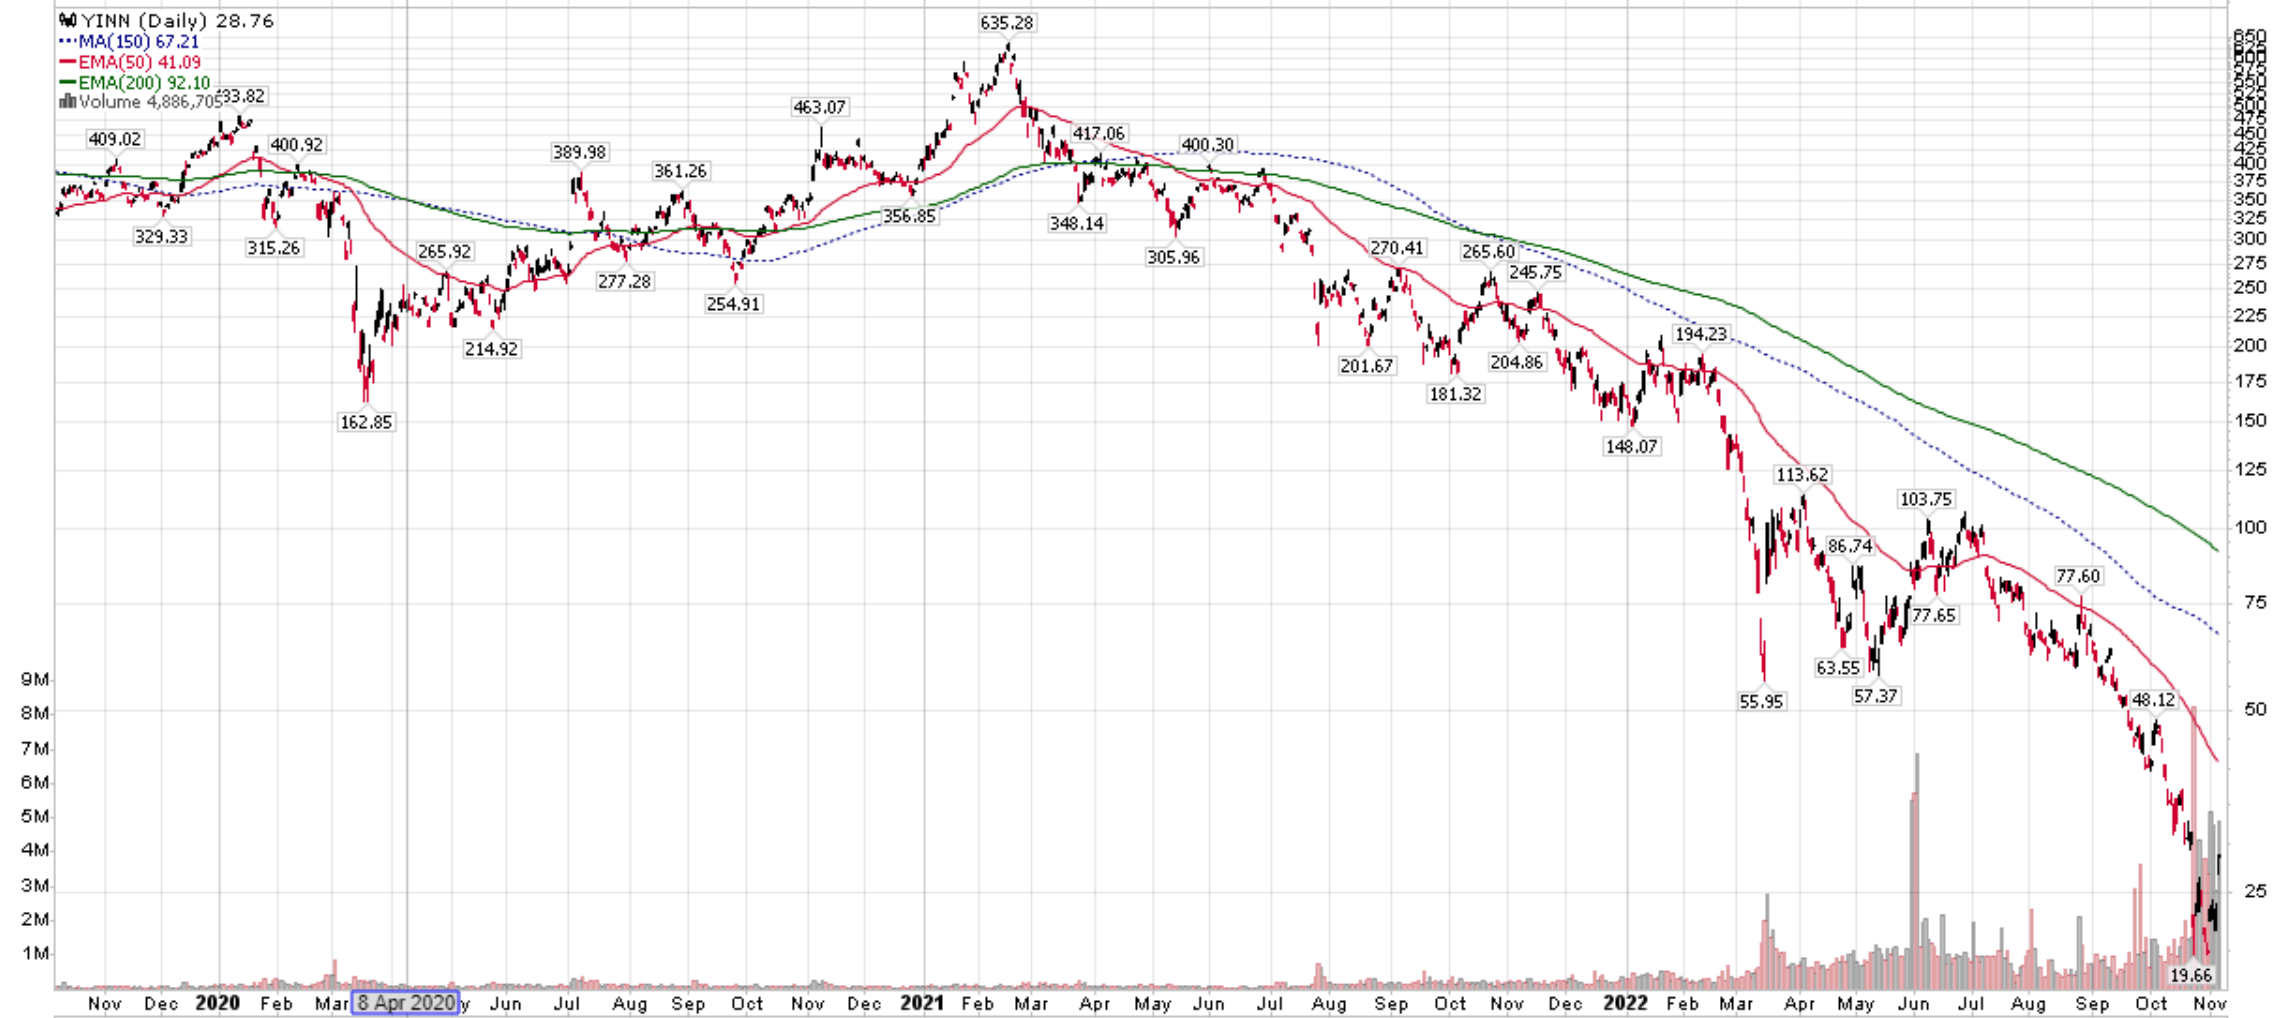
Time To be Contrarian In Chinese Equities
By now, the bearish case against Chinese equities is well known and has become consensus. Everyone knows about the Chinese government’s crackdown on its tech giants in the name of ‘common prosperity’. The housing crisis is also common knowledge, with real estate developers running into trouble on a weekly basis. Who can forget images of citywide lockdowns in Shanghai disrupting everyday life and causing the economy to grind to a halt? Finally, geopolitical risks are ratcheting higher, with the latest development being a semiconductor ban by the U.S. government.
However, I believe investor sentiment against China may have gotten excessively bearish such that it is prone to a sharp squeeze on the slightest improvement in any of the negative drivers mentioned above.
In the past week, we have seen signs that the zero-COVID restrictions may be easing, sparking a huge rally in Chinese equities. The YINN ETF has rallied an incredible 44.9% in 5 trading sessions.
Volatility Decay Makes Me Hesitant On YINN
However, unless Chinese equities continue to rally in a straight line in the coming days and weeks, I would be hesitant to buy the YINN ETF, as it suffers from ‘volatility decay’.
For example, if we invested $100 in YINN and the FTSE China 50 Index returns 5% on day 1 ($100 x [1+[3 x 5%]] = $115), followed by -5% on day 2, investors are left with only $97.75 ($115 x [1 + [3 x -5%]] = $97.75), significantly less than three times the 2-day compounded loss of 0.25% or $99.25.
In fact, if we look at FXI vs. YINN in the past 2 weeks (October 25, 2022 to November 3rd, 2022), while the FXI has returned 8.3%, the YINN ETF has only delivered 19.1% returns, far less than 3x the unlevered return because volatility has been so high in the past few days (Figure 5).
Figure 5 – YINN suffers from volatility decay (Seeking Alpha)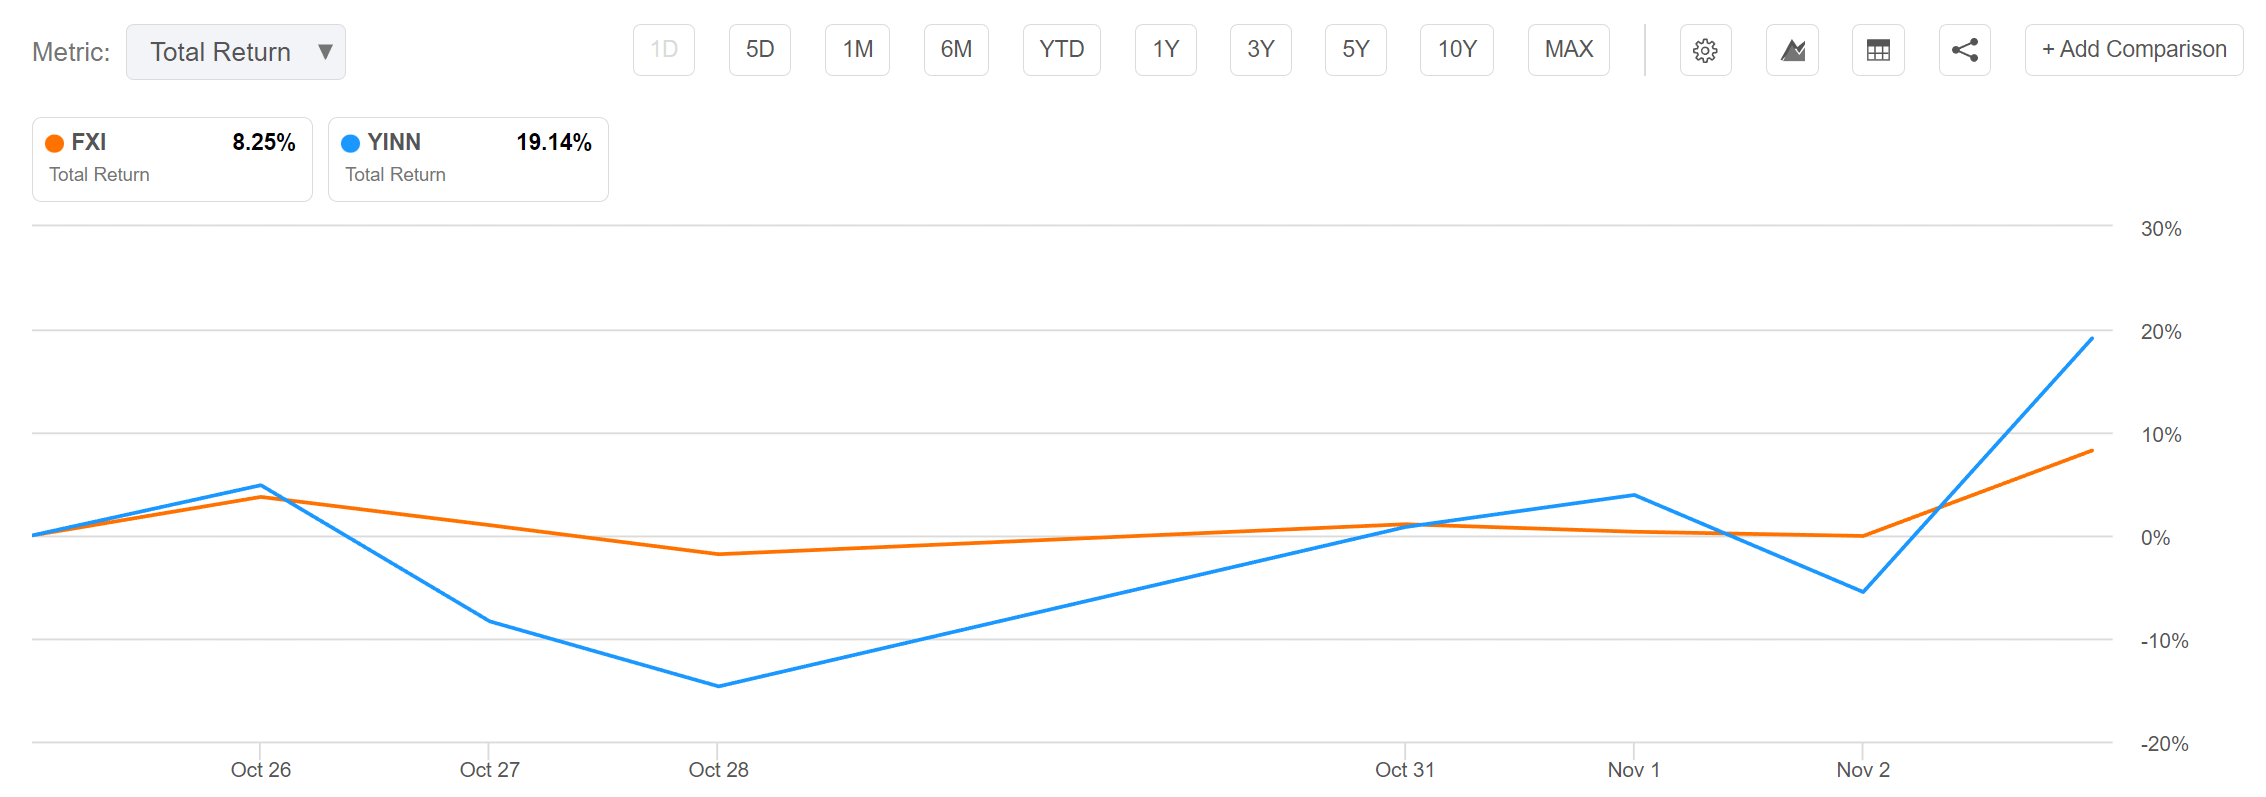
Conclusion
While I am contrarian bullish on Chinese equities, I am hesitant to buy the YINN ETF due to the significant volatility decay of levered ETFs. While nimble traders may enjoy the positive convexity from levered ETFs like YINN, I worry that the upcoming rebound could be volatile (with lots of up and down days) and will eat away at potential returns. I am much more comfortable expressing my contrarian bet through unlevered funds like the TDF or FXI.
Be the first to comment