

The Cannabiz Agency/iStock via Getty Images
A Quick Take On WM Technology
WM Technology, Inc. (NASDAQ:MAPS) reported its Q2 2022 financial results on August 9, 2022, missing expected revenue and beating EPS estimates.
The company provides software solutions to cannabis retailers and brands for their ecommerce and compliance needs.
Until the company sees material revenue growth from new markets such as New York and New Jersey and reduces its operating losses, I’m on Hold for MAPS in the near term.
WM Technology Overview
Irvine, California-based WM Technology was founded in 2008 to develop a platform and marketplace (Weedmaps) for ecommerce functions related to ordering cannabis products online.
The firm is headed by Chief Executive Officer Chris Beals, who joined the firm in 2015 and previously was Senior Vice President at Colbeck and Senior Corporate Counsel at Deutsche Telekom N.A.
The company’s primary offerings include:
-
Weedmaps online marketplace
-
WM Business Suite
-
Sprout CRM system
-
Cannveya delivery and logistics
The firm acquires customers via its online efforts and through its direct sales and marketing efforts to businesses.
WM Technology’s Market & Competition
According to a 2022 market research report by Verified Market Research, the global market for cannabis industry software was an estimated $$476 million in 2020 and is forecast to reach $3.6 billion by 2028.
This represents a forecast CAGR of 30.18% from 2021 to 2028.
The main drivers for this expected growth are legalization successes resulting in greater regulation requiring increased legal compliance as well as the need for efficiencies across cannabis organizations.
Also, many countries have legalized the use of cannabis products, at least for therapeutic purposes and in some cases recreational uses.
The chart below shows the expected growth trajectory of various cannabis industry software market technologies through 2028:
Cannabis Industry Software Market (Verified Market Research)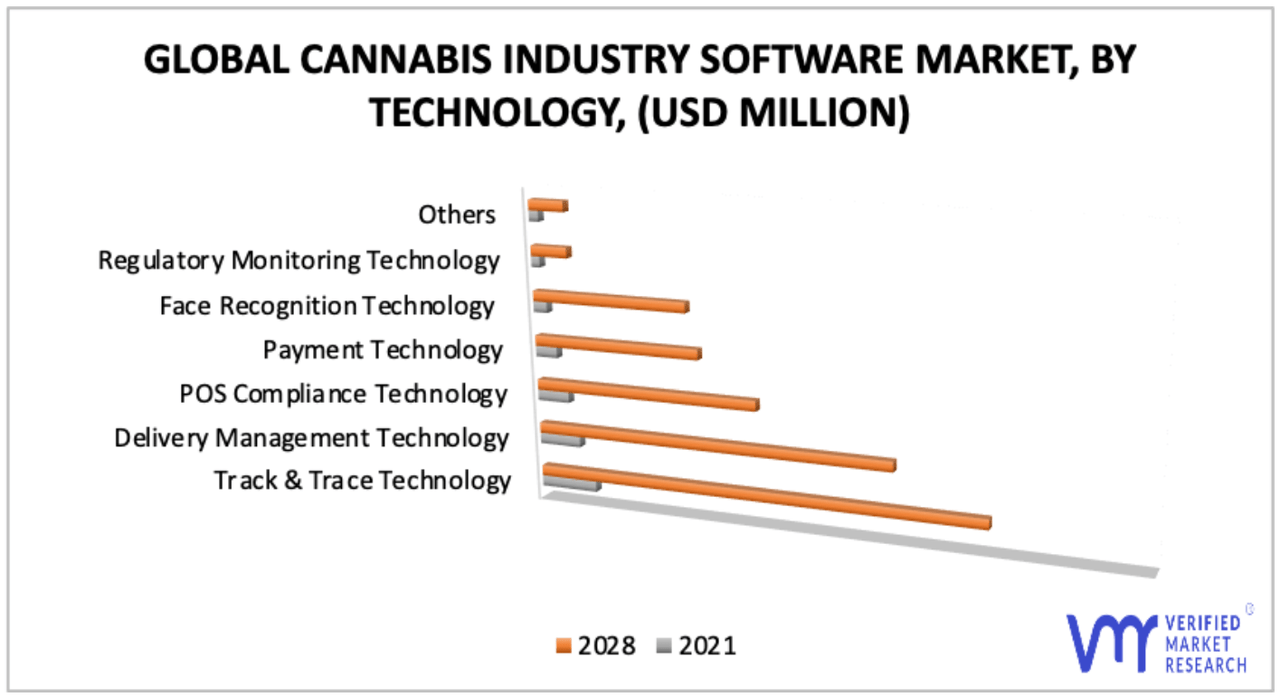
Major competitive or other industry participants include:
-
Ample Organics
-
Canix
-
Distru
-
Flourish Software
-
Flowhub
-
Greenbits
-
Helix BioTrack
-
MJ Freeway
-
Retail Innovation Labs LLC (Cova Software)
-
SYSPRO
WM Technology’s Recent Financial Performance
-
Total revenue by quarter has risen according to the following chart:
9 Quarter Total Revenue (Seeking Alpha)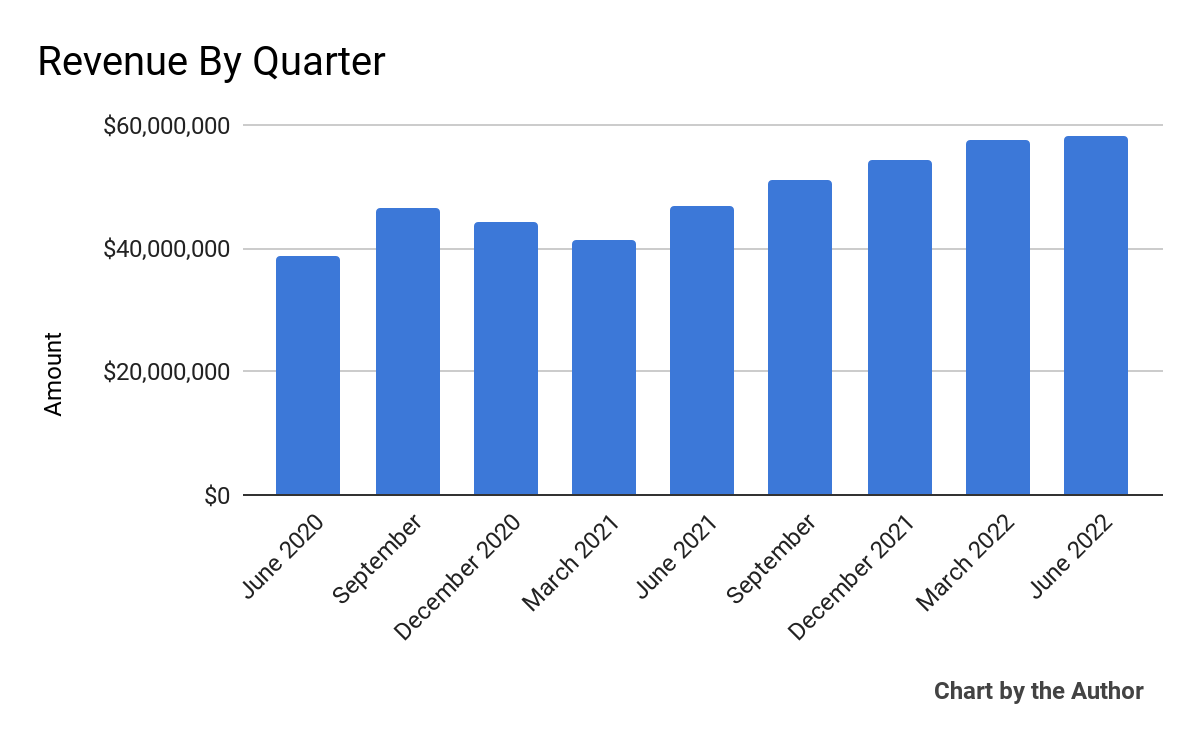
-
Gross profit by quarter has followed approximately the same trajectory as total revenue:
9 Quarter Gross Profit (Seeking Alpha)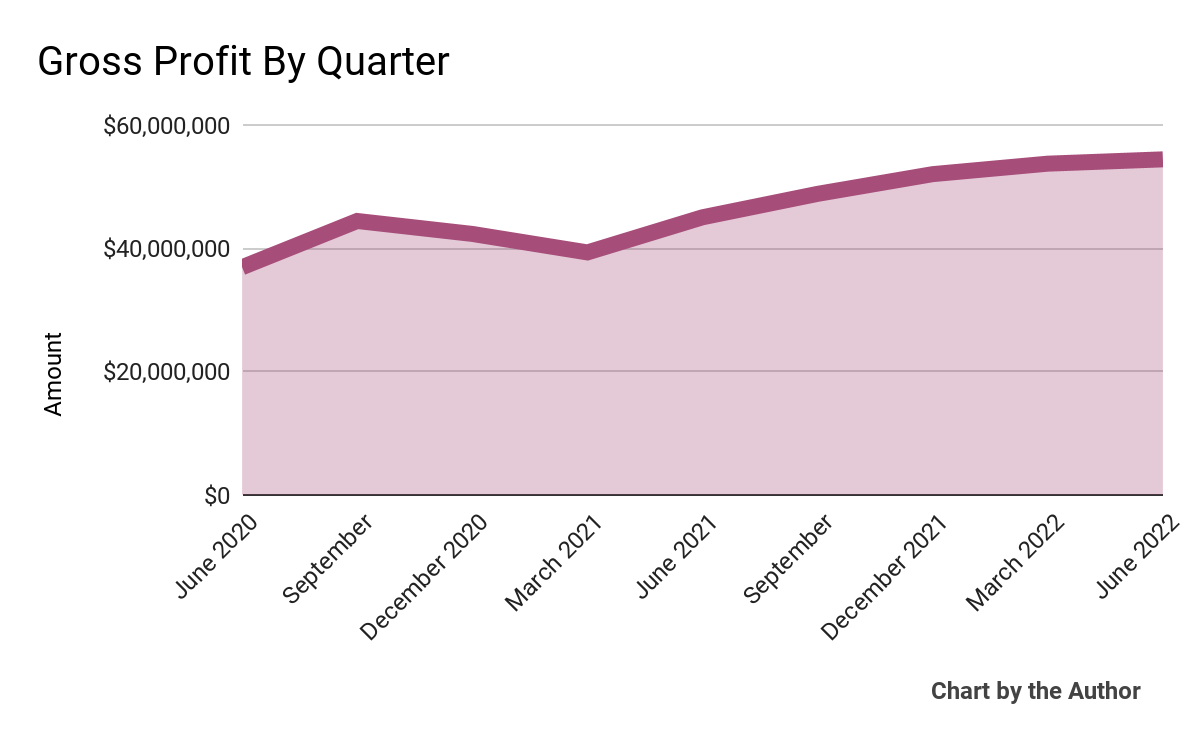
-
Selling, G&A expenses as a percentage of total revenue by quarter have risen substantially in recent quarters:
9 Quarter Selling, G&A % Of Revenue (Seeking Alpha)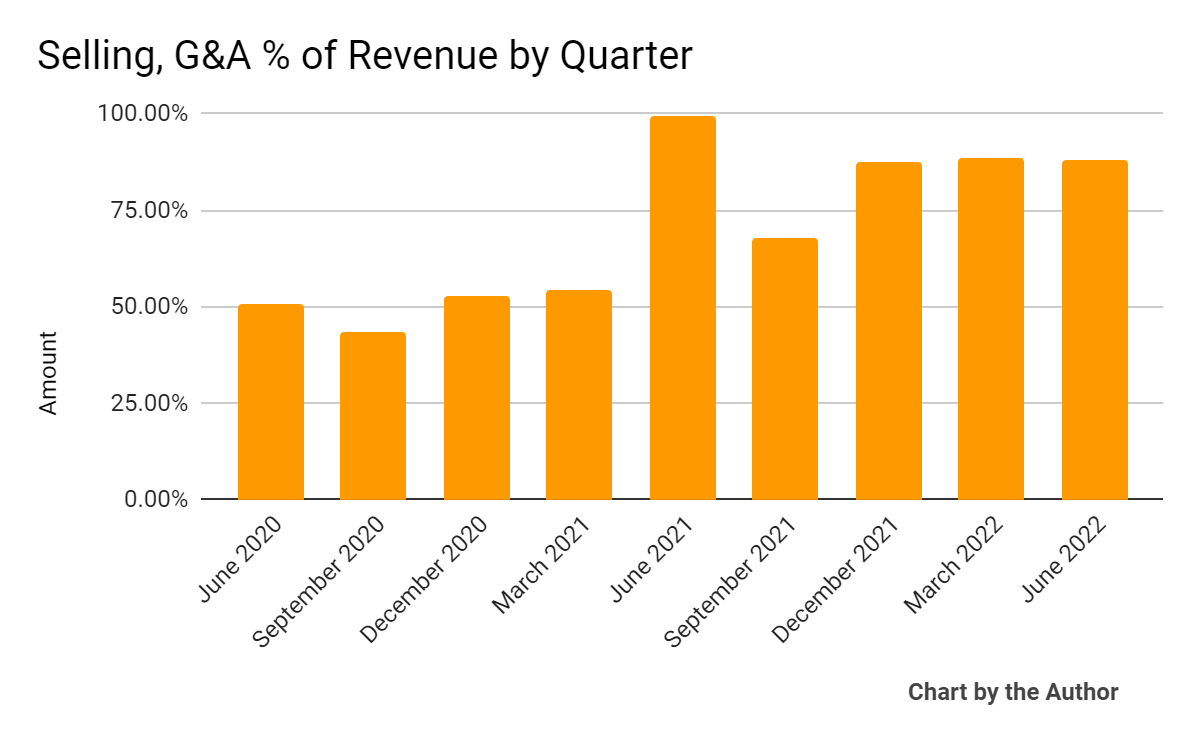
-
Operating income by quarter has turned negative in recent quarters:
9 Quarter Operating Income (Seeking Alpha)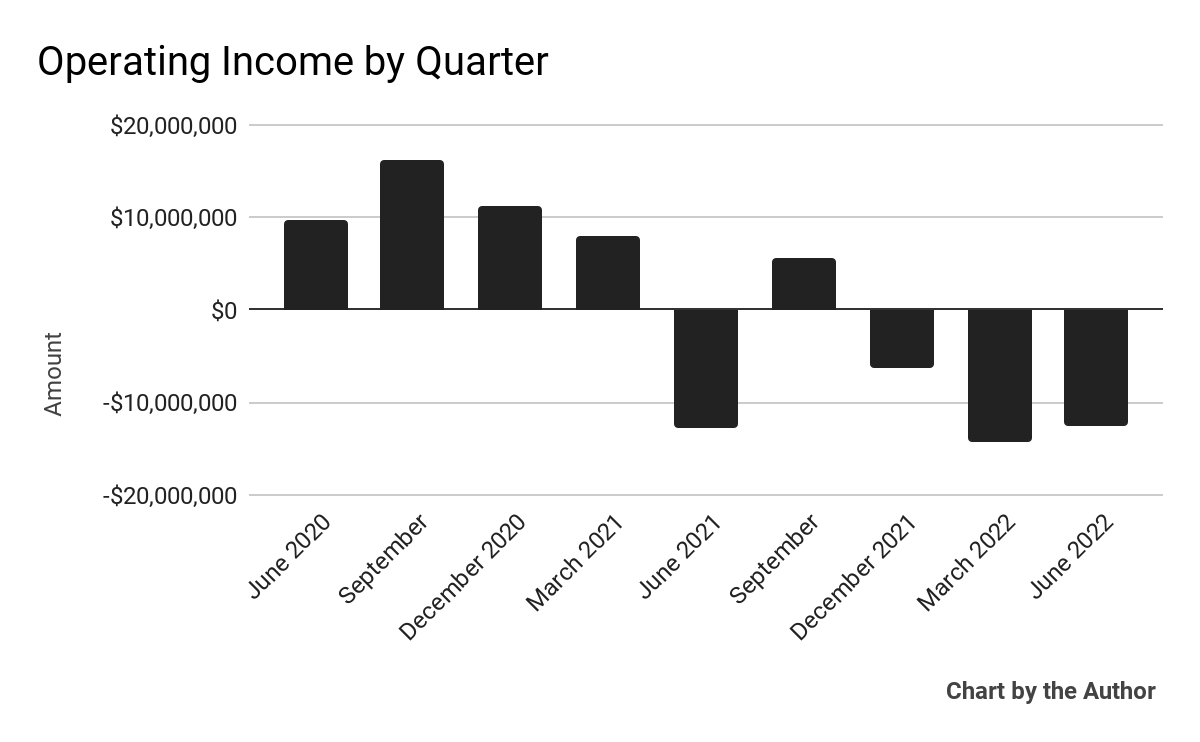
-
Earnings per share (Diluted) have fluctuated according to the chart below:
9 Quarter Earnings Per Share (Seeking Alpha)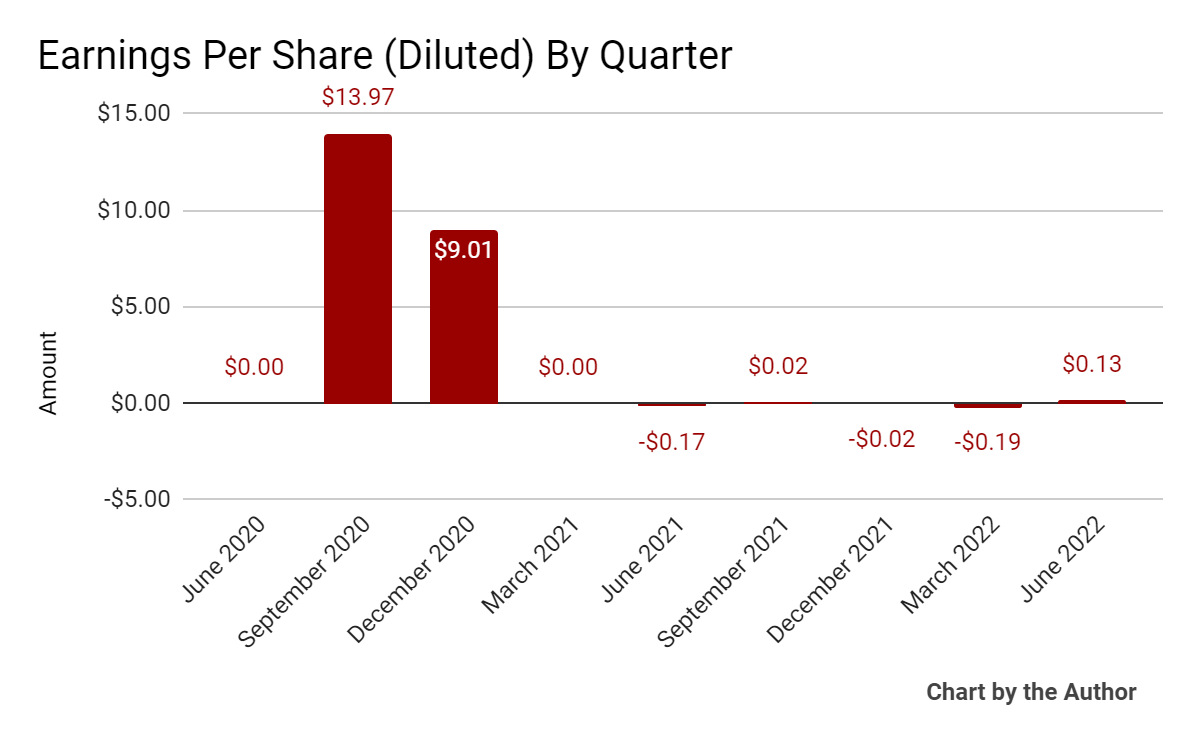
(All data in above charts is GAAP.)
In the past 12 months, MAPS’ stock price has fallen 84.6% vs. the U.S. S&P 500 index’s drop of around 16.5%, as the chart below indicates:
52 Week Stock Price (Seeking Alpha)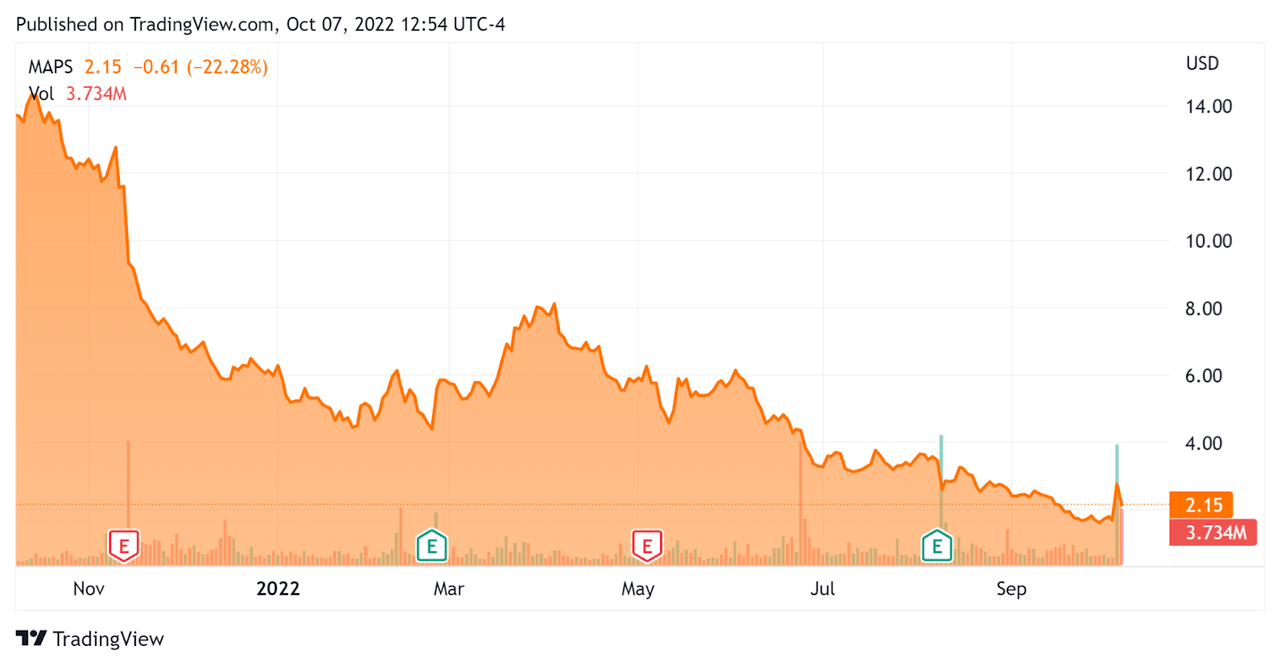
Valuation And Other Metrics For WM Technology
Below is a table of relevant capitalization and valuation figures for the company:
|
Measure [TTM] |
Amount |
|
Enterprise Value / Sales |
0.92 |
|
Revenue Growth Rate |
23.4% |
|
Net Income Margin |
24.4% |
|
GAAP EBITDA % |
-8.9% |
|
Market Capitalization |
$270,550,000 |
|
Enterprise Value |
$203,780,000 |
|
Operating Cash Flow |
$2,740,000 |
|
Earnings Per Share (Fully Diluted) |
-$0.06 |
(Source – Seeking Alpha)
The Rule of 40 is a software industry rule of thumb that says that as long as the combined revenue growth rate and EBITDA percentage rate equal or exceed 40%, the firm is on an acceptable growth/EBITDA trajectory.
MAPS’ most recent GAAP Rule of 40 calculation was 14.5% as of Q2 2022, so the firm needs significant improvement in this regard, per the table below:
|
Rule of 40 – GAAP |
Calculation |
|
Recent Rev. Growth % |
23.4% |
|
GAAP EBITDA % |
-8.9% |
|
Total |
14.5% |
(Source – Seeking Alpha)
Commentary On WM Technology
In its last earnings call (Source – Seeking Alpha), covering Q2 2022’s results, management highlighted that its shortfall in results was due to “macro challenges, in particular the significant rise in gas prices and other inflationary pressures during the quarter.”
The firm has been forced to remove certain clients from its platform due to non-payment and expects inflation and other economic pressures to increase on its clients during the second half of 2022.
This is despite increased optimism about additional states “looking poised to pass new legalization measures in the next two years.”
Also of note is the recent action by the President to pardon those found guilty at the federal level of simple marijuana possession, or approximately 6,500 persons.
As to its financial results, revenue rose 24% year-over-year despite significant declines in licensed channels across its markets.
The company’s net dollar retention rate for the month of June was 92%, indicating worsening results due to nearly 500 clients unable to pay or being put on payment plans.
WM’s Rule of 40 results have been sub-par, although the company is not strictly a software firm.
Gross margin of 93% was flat sequentially while SG&A as a percent of revenue remained elevated.
As a result, operating losses remained well above $10 million for the second quarter in a row.
For the balance sheet, the company ended the quarter with $47.6 million in cash and no long-term debt.
Over the trailing twelve months, free cash used was $13.0 million as the firm made $15.7 million in capital expenditures.
Looking ahead, management expects Q3 revenue growth to be in the “low double-digit” range and is not assuming any material revenue contribution from either New Jersey or New York in the current fiscal year.
Regarding valuation, the market is valuing MAPS at an EV/Sales multiple of around 0.92x.
The SaaS Capital Index of publicly held SaaS (software as a service) software companies showed an average forward EV/Revenue multiple of around 6.9x at September 30, 2022, as the chart shows here:
SaaS Capital Index (SaaS Capital)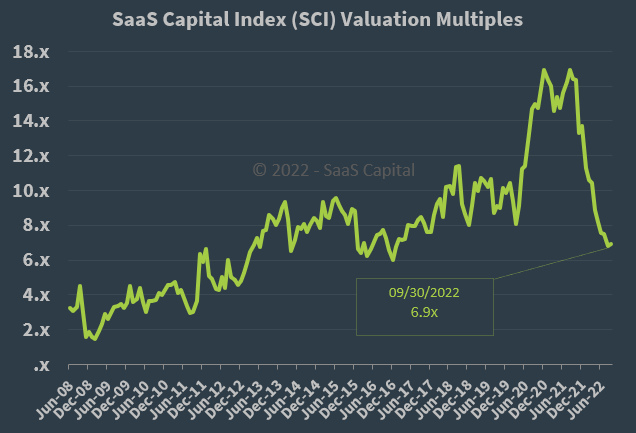
So, by comparison, MAPS is currently valued by the market at a large discount to the broader SaaS Capital Index, at least as of September 30, 2022.
The primary risk to the company’s outlook is a macroeconomic slowdown or recession, reduced access to capital for potential licensees, both of which may slow sales cycles and reduce its revenue growth trajectory.
With the recent employment figures indicating further strength in the U.S. economy, it is increasingly likely the U.S Federal Reserve will continue to increase interest rates, increasing the cost of capital and reducing its availability in the process.
This will likely exert further downward pressure on the company’s prospective customers while reducing MAPS’ valuation multiple given its operating loss position.
Until the company sees material revenue growth from new markets such as New York and New Jersey and reduces its operating losses, I’m on Hold for MAPS in the near term.
Be the first to comment