

KanawatTH/iStock via Getty Images
(This article was co-produced with Hoya Capital Real Estate)
Introduction
Years ago I owned the WisdomTree MidCap Earnings ETF (EZM), which later dropped the “Earnings” from its name on March 29, 2019. The underlying Index was also renamed: WisdomTree U.S. MidCap Index from the WisdomTree U.S. MidCap Earnings Index. A WisdomTree representative confirmed, though the names changed, both the Index and thus the ETF did not change their earnings focus. After doing a review of the WisdomTree U.S. MidCap Dividend ETF (DON), it seemed logical to do my next Mid-Cap ETF comparison using both WisdomTree ETFs since they invest using different WisdomTree inhouse indices.
Exploring the WisdomTree U.S. MidCap ETF
Seeking Alpha describes this ETF as:
WisdomTree U.S. MidCap Fund is an exchange traded fund launched by WisdomTree Investments, Inc. It is co-managed by Mellon Investments Corporation and WisdomTree Asset Management, Inc. The fund invests in stocks of companies operating across diversified sectors. The fund invests in growth and value stocks of mid-cap companies. The fund seeks to track the performance of the WisdomTree U.S. MidCap Index. EZM started in 2007.
Source: seekingalpha.com EZM
WisdomTree describes EZM as an ETF that seeks to track the investment results of earnings-generating mid-cap companies in the U.S. equity market. EZM has $810m in assets with a current yield of 1.1%. WisdomTree charges 38bps in fees.
WisdomTree U.S. MidCap Index review
This is how WisdomTree defines their Index:
The WisdomTree U.S. MidCap Index is a fundamentally weighted index that measures the performance of earnings-generating companies within the mid-capitalization segment of the U.S. Stock Market. The index is comprised of the companies in the top 75% of the market capitalization of the WisdomTree U.S. Total Market Index after the 500 largest companies have been removed. Companies in the index are incorporated and listed in the U.S. and have generated positive cumulative earnings over their most recent four fiscal quarters prior to the index measurement date.
Source: wisdomtree.com/index
The Index comprises 579 stocks, where 83% have market-caps between $2-10b, and 17% over $10b in size. A very small fraction are below $2b in size. The Domestic Earnings Indexes are modified capitalization-weighted Indexes that employ a transparent weighting formula to magnify the effect that earnings play in the total return of the Indexes. Rules for the Index construction include:
- The Index is comprised of companies with positive earnings,
- The Index is reconstituted annually in December, at which time each component’s weight is adjusted to reflect its share of the Earnings Stream during the prior four fiscal quarters,
- The percentage weight assigned to each component in the Index at the annual reconstitution is calculated by dividing the cumulative earnings each component company has generated in its last four reported fiscal quarters by the sum of all the earnings generated by all the component companies in the Index over the same period,
- Companies need to have a market capitalization of at least $100 million by the “Screening Date” (after the close of trading on the last trading day in November); they must also have a P/E ratio of at least 2 on that same date,
- Common stocks, equity REITs, tracking stocks and holding companies are eligible for inclusion. ADRs, GDRs and EDRs, royalty trusts, Business Development Companies, and mortgage REITs are types not eligible,
- Companies that fall within the bottom decile of a composite risk factor score, which is composed of on equally weighted score of the below two factors, are not eligible for inclusion.
- Quality Factor – determined by static observations and trends of return on equity (ROE), return on assets (ROA), gross profits over assets and cash flows over assets. Scores are calculated within industry groups.
- Momentum Factor – determined by stocks’ risk adjusted total returns over historical periods (6 and 12 months).
- The Index employs several ‘capping’ rules to which restrict the weight of any individual securities or sectors size within the Index.
EZM Holdings review
WisdomTree.com EZM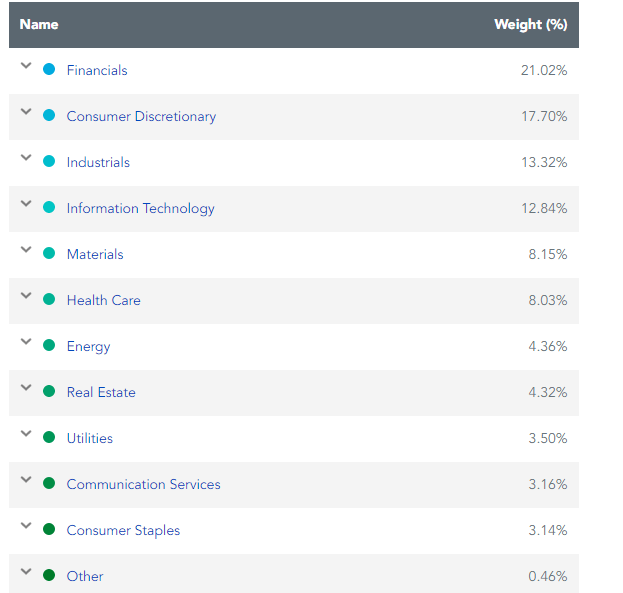
EZM is weighted (over 60%) in its four largest sectors. The lower Technology weight versus a Large-Cap ETF speaks volumes about the P/E ratios of the stocks that top the S&P 500 Index. The Top 20 stocks, out of over 580, are about 13% of the asset value of EZM. The Earnings-based weighting formula keeps any set of stocks from dominating the ETF.
WisdomTree.com EZM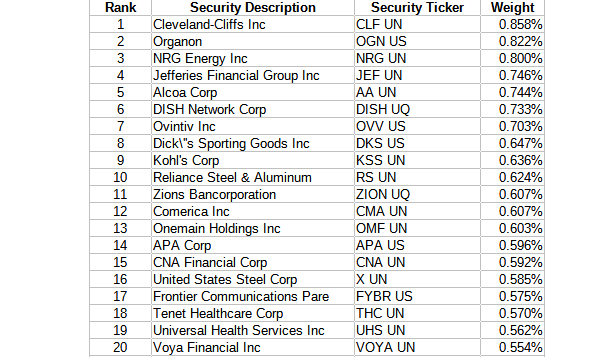
EZM Distribution review
seekingalpha.com EZM DVDs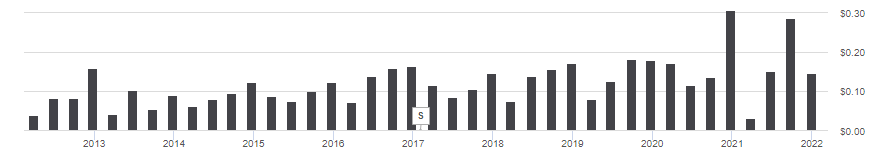
Except for two recent large distributions, distributions have shown little growth over the past ten years. All distributions, including the two large ones, were all from Ordinary income. Seeking Alpha grades EZM’s dividend performance as “B+”. The data shows how much the payout growth has slowed recently.
seekingalpha.com EZM DVD grades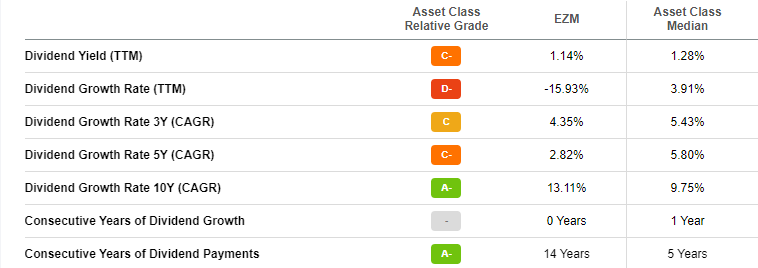
Exploring the WisdomTree U.S. MidCap Dividend ETF
Seeking Alpha describes this ETF as:
The fund is co-managed by Mellon Investments Corporation and WisdomTree Asset Management, Inc. It invests in public equity markets of the United States. It invests in stocks of companies operating across diversified sectors. The fund invests in growth and value stocks of mid-cap companies. The fund invests in dividend paying stocks of companies. The fund seeks to track the performance of the WisdomTree U.S. MidCap Dividend Index. DON started in 2006.
Source: seekingalpha.com DON
WisdomTree describes DON as an ETF that seeks to track the investment results of dividend-paying mid-cap companies in the U.S. equity market. DON has $3b in assets with the managers charging 38bps in fees. The yield is only 2.17%.
WisdomTree U.S. MidCap Dividend Index review
This is how WisdomTree defines their Index:
The WisdomTree U.S. MidCap Dividend Index is a fundamentally weighted index that measures the performance of the mid-capitalization segment of the US dividend-paying market. The Index is comprised of the companies that compose the top 75% of the market capitalization of the WisdomTree U.S. Dividend Index after the 300 largest companies have been removed. The index is dividend weighted annually to reflect the proportionate share of the aggregate cash dividends each component company is projected to pay in the coming year, based on the most recently declared dividend per share.
Source: wisdomtree.com/index
The Index comprises 342 stocks where 54% have market-caps between $2-10b, and 46% over $10b in size. The MidCap Dividend Index is comprised of dividend-paying companies from the mid-capitalization segment of the WisdomTree U.S. Dividend Index. The Domestic Dividend Indexes are modified capitalization-weighted Indexes that employ a transparent weighting formula to magnify the effect that dividends play in the total return of the Indices. The following are applied to construct all the WisdomTree Dividend indices:
- A company must list its shares on a U.S. stock exchange,
- Be incorporated and headquartered in the United States,
- Pay regular cash dividends on shares of its common stock in the 12 months preceding the annual reconstitution, which takes place in December.
- Companies need to have a market capitalization of at least $100 million on the last trading day in November,
- Average daily dollar volume of at least $100,000 for three months preceding the end of November,
- Common stocks, REITs, tracking stocks, and holding companies are eligible for inclusion. ADRs, GDRs and EDRs are excluded, as are limited partnerships, limited liability companies, royalty trusts, Business Development Companies.
- Companies that fall within the bottom decile of a composite risk factor score, which is composed of on equally weighted score of the below two factors, are not eligible for inclusion.
- Quality Factor – determined by static observations and trends of return on equity (ROE), return on assets (ROA), gross profits over assets and cash flows over assets,
- Momentum Factor – determined by stocks’ risk adjusted total returns over historical periods (6 and 12 months).
- Companies that fall within the top 5% ranked by dividend yield and also the bottom ½ of the composite risk factor score are not eligible for inclusion.
- Index weighting is based on each component’s projected cash dividends to be paid over the coming year divided by the sum of the projected cash dividends to be paid by all the components in the Index
DON ETF Holdings review
WisdomTree.com DON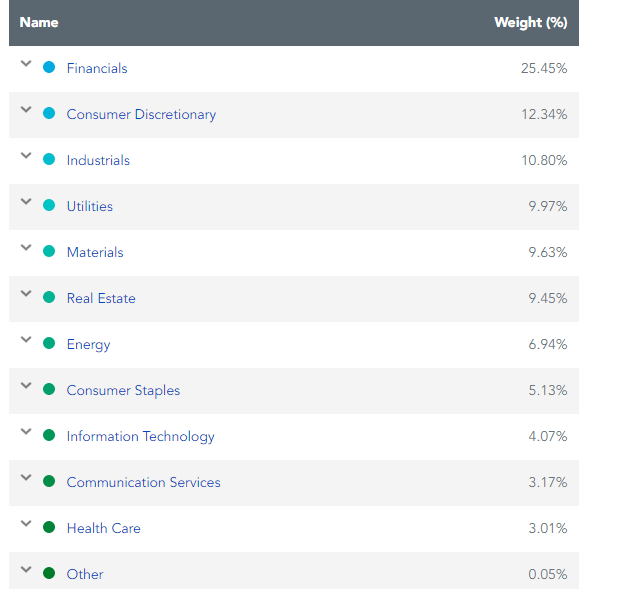
DON is slightly less tied to its top four sectors as EZM is at closer to 58%. We will look closer at the sector allocations in the comparison section of this article, but note what the dividend-focused did to including Tech stocks. The Top 20 stocks, out of 344, represent about 19% of the asset value of the ETF. Again, no subset of stocks dominates the ETF.
WisdomTree.com DON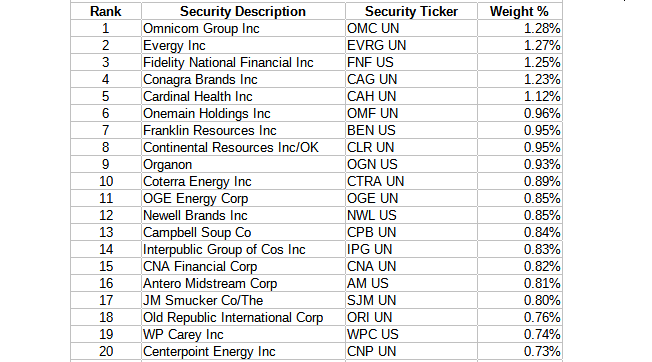
Only three of the Top 20 appear in both lists. The total overlap appears in the Comparison analysis below.
DON ETF Distribution review
seekingalpha.com DON DVDs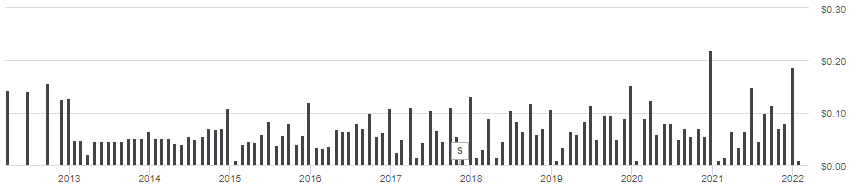
Dividends are paid monthly, and except for some year-end spikes, the payout has been below $.10 per month. According to the DON webpage, 100% of the payouts have come from Ordinary income. Seeking Alpha grades their payout history as a “B”.
seekingalpha.com DON DVD grades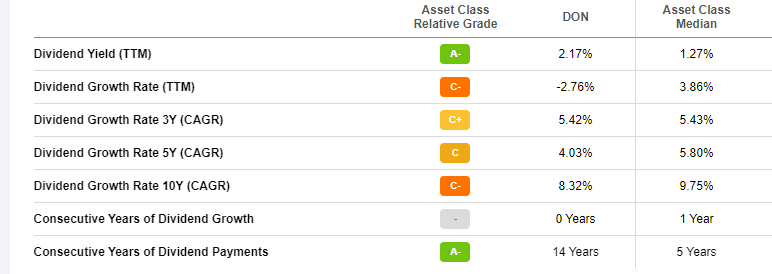
With a yield under 2.2%, how fast it is growing becomes more important. Notice that 2021 was slightly down from 2020, the year of COVID cuts. While the 10-year growth (8.32%) is great, it has slowed down considerably since.
Comparing the ETFs
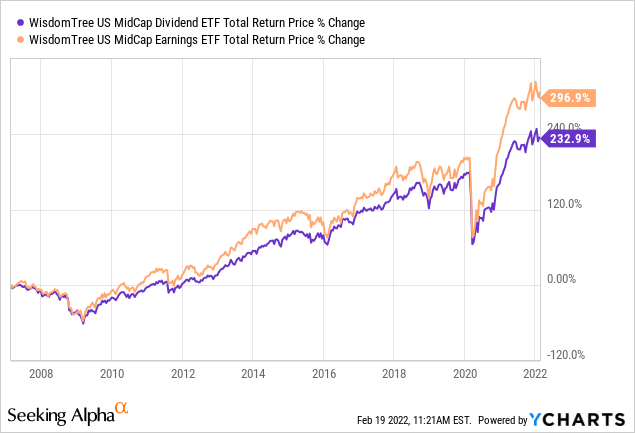
Performance wise, which is where the “rubber meets the road”, definitely favors the earnings approach over the dividend approach. While the following isn’t a historical investment picture but a snapshot in time, it should give clues as to why EZM has done better over time than DON and more importantly, while that trend hold.
WisdomTree.com; compiled by Author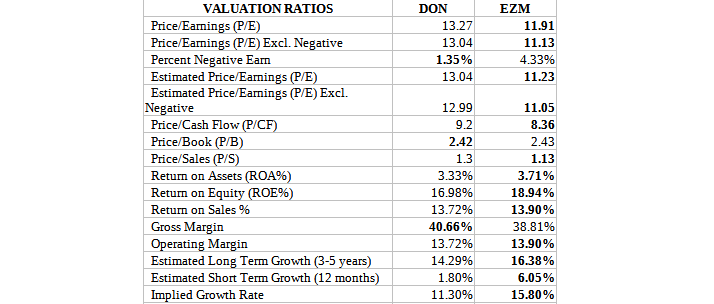
I bolded the ETF with the better value and most point to EZM in how I view each statistic. Next I compared the asset sizes of each ETF.
WisdomTree.com; compiled by Author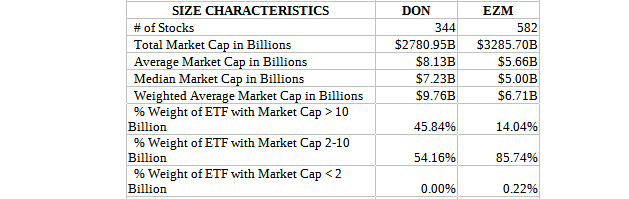
EZM averages are smaller than DON’s, with DON holding stocks greater than $10b in size. I checked what the SPDR S&P 500 ETF (SPY) holds, and that category is 99% of that ETF, and WisdomTree classifies $10+b as Large-Cap. With many investors in SPY-like funds, I added it to the comparison for the sector review.
WisdomTree.com comparison tool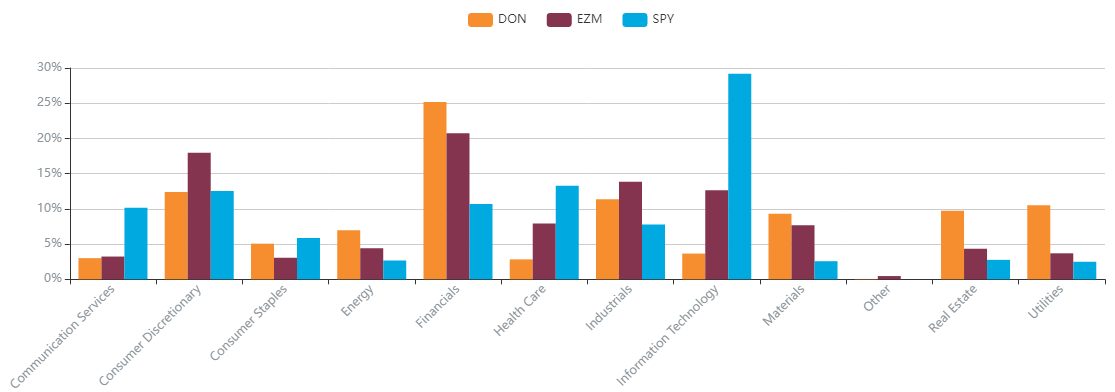
This shows not only how DON and EZM invest differently, but how they compare to a Large-Cap, non-factor ETF. As most investors might expect, SPY is heavily invested in Technology stocks, with the dividend-focused DON ETF having the least exposure there. The three higher-yielding sectors (FIN, RE, UTIL) outweigh those sectors compared to SPY.
WisdomTree.com comparison tool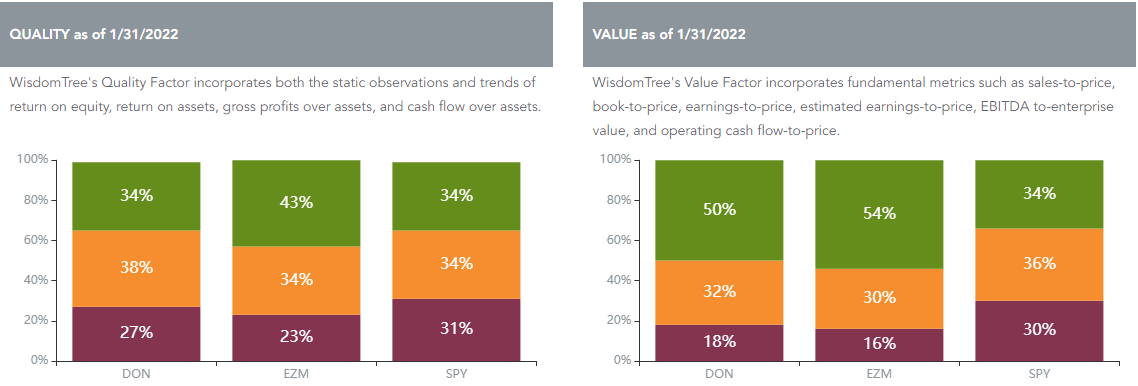
EZM has both more Quality and Value exposure than either of the other ETFs. I would expect that based on the earnings tests that have to be passed to get included and than weighted.
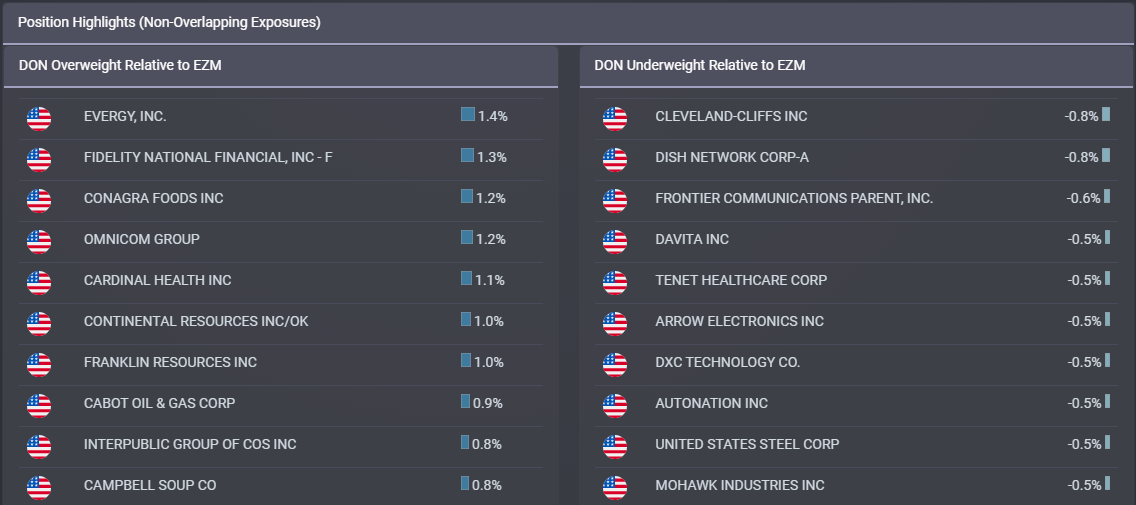
The two ETFs share 261 holdings, with 76% of EZM’s stocks held by DON; 45% in the other direction. Overall, 44% of the market weight overlaps. The next chart shows the biggest overweightings by each ETF.
Portfolio Strategy
The DON ETF and EZM ETF provide focused mid-cap exposure, and both have performed well but there are others investors might consider. Here are a few I found but haven’t researched in depth yet.
Hoya Capital Income Builder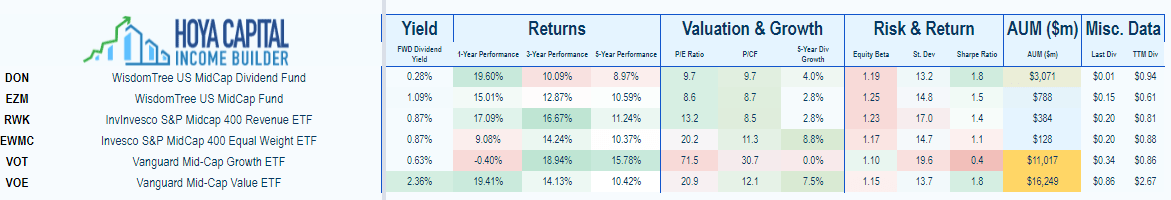
Even in the cid-cap space, the Growth ETF, Vanguard Mid-Cap Growth ETF (VOT), has the best CAGR. With the Invesco S&P MidCap 400 Revenue ETF (RWK) placing second, it is worth a deeper analysis.
For those still deciding between Mid-Cap ETFs and Large-Cap ETFs, I included the following chart:
PortfolioVisualizer.com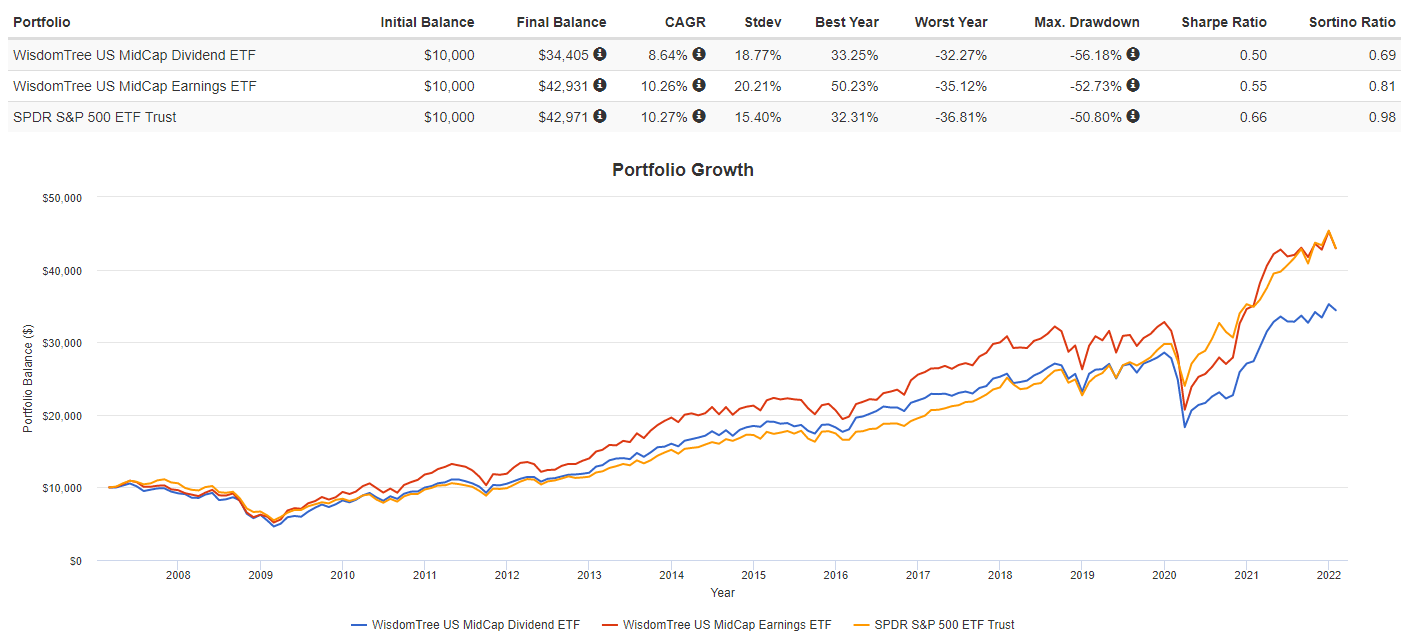
Since 2007 when EZM started, much of the time it was outperforming SPY, though its StdDev is much higher.
Final thought
“Don’t Let Great Get in the Way of Good”. While many of you may recognize the above as the business-speak version of Voltaire’s “The Perfect is the Enemy of the Good”, it definitely applies to investing. With thousands of ETFs to pick, waiting to find the perfect or greatness ETF, leaves you on the sidelines. While there are times that is the best option, in the long run it is not.
While I found several Mid-Cap ETFs that use a focused strategy, of these EZM is one of the best. Based on that, I would be Bullish on this ETF.
Be the first to comment