

Vladimir Zakharov
This dividend ETF article series aims at evaluating products regarding the relative past performance of their strategies and quality metrics of their current portfolios. Holdings and weights change over time, so updated reviews are posted when necessary.
DES strategy and portfolio
The WisdomTree U.S. SmallCap Dividend Fund (NYSEARCA:DES) has been tracking the WisdomTree U.S. SmallCap Dividend Index since 6/16/2006. It has 665 holdings, a distribution yield of 2.74% and a total expense ratio of 0.38%.
As described in the prospectus,
The Index is comprised of the companies that compose the bottom 25% of the market capitalization of the WisdomTree U.S. Dividend Index after the 300 largest companies have been removed. The index is dividend weighted annually.
The fund invests exclusively in U.S. companies, 59% in small caps, 40% in micro caps and less than 1% in mid-caps.
DES is cheaper than the small cap benchmark iShares Russell 2000 ETF (IWM) in price/book ratio. However, other usual value metrics are close.
|
DES |
IWM |
|
|
Price / Earnings |
11.12 |
11.52 |
|
Price / Book |
1.56 |
1.92 |
|
Price / Sales |
0.9 |
1.17 |
|
Price / Cash Flow |
9.42 |
9.77 |
Data: Fidelity
The heaviest sector is financials (25.40%), followed by industrials (16.8%). Compared to IWM, DES overweights financials, utilities, real estate, consumer staples and materials. It underweights healthcare, technology and energy.
DES sectors (chart: author; data: Fidelity)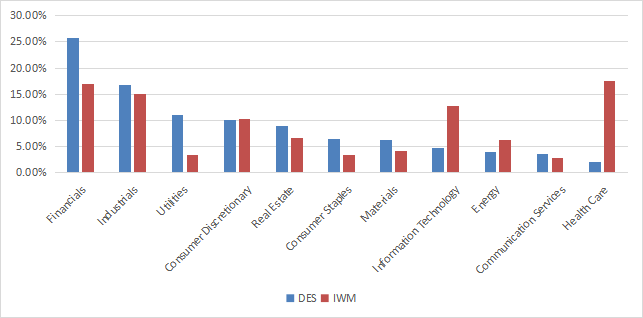
The fund is diversified: only 10.5% of asset value are in the top 10 holdings, listed below. The top name weighs less than 1.4%. Risks related to any individual stock are very low.
|
Ticker |
Name |
Weight |
EPS growth %TTM |
PE TTM |
PE fwd |
Yield% |
|
South Jersey Industries, Inc. |
1.38% |
-20.66 |
24.65 |
19.94 |
3.61 |
|
|
New Jersey Resources Corp. |
1.13% |
35.34 |
20.23 |
18.78 |
3.15 |
|
|
Spire Inc. |
1.09% |
-17.99 |
17.90 |
18.05 |
3.91 |
|
|
Cogent Communications Holdings, Inc. |
1.07% |
849.09 |
52.82 |
66.30 |
7.29 |
|
|
Greif, Inc. |
1.03% |
15.35 |
10.62 |
8.47 |
2.94 |
|
|
ONE Gas, Inc. |
1.02% |
2.34 |
20.61 |
19.82 |
3.07 |
|
|
Xerox Holdings Corp. |
0.98% |
-376.09 |
N/A |
13.70 |
6.25 |
|
|
MSC Industrial Direct Co., Inc. |
0.96% |
48.50 |
14.84 |
13.01 |
3.75 |
|
|
NorthWestern Corp. |
0.90% |
-9.78 |
16.64 |
16.44 |
4.65 |
|
|
ALLETE, Inc. |
0.89% |
12.44 |
16.65 |
16.05 |
4.32 |
Historical performance
Since inception in June 2006, DES has lagged IWM by 80 bps in annualized return (with dividends reinvested). It also shows a deeper maximum drawdown.
|
Tot. Return |
Annual Return |
Drawdown |
Sharpe ratio |
Volatility |
|
|
DES |
193.57% |
6.87% |
-65.09% |
0.37 |
21.09% |
|
IWM |
231.28% |
7.67% |
-58.26% |
0.41 |
20.75% |
Data calculated with Portfolio123
DES vs. IWM since inception (Portfolio123)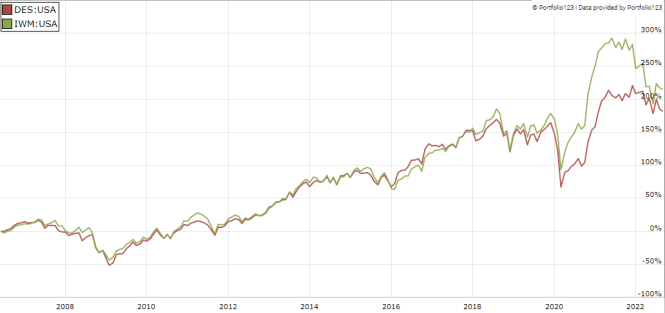
DES was almost on par with IWM until 2019, then it has underperformed in 2020 and 2021. However, it has beaten the benchmark in 2022 (see next chart).
DES vs. IWM year-to-date (Portfolio123)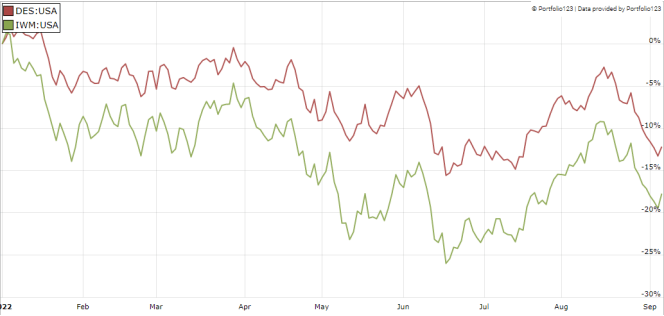
Comparing DES with a reference strategy based on dividend and quality
In previous articles, I have shown how three factors may help cut the risk in a dividend portfolio: Return on Assets, Piotroski F-score, and Altman Z-score.
The next table compares DES since inception with subsets of the S&P 500 and the Russell 2000: stocks with a dividend yield above the average of their respective indexes, an above-average ROA, a good Altman Z-score, a good Piotroski F-score and a sustainable payout ratio. Subsets are rebalanced quarterly to make them comparable with a passive index.
|
Tot. Return |
Annual Return |
Drawdown |
Sharpe ratio |
Volatility |
|
|
DES |
193.57% |
6.87% |
-65.09% |
0.37 |
21.09% |
|
Small cap reference subset |
288.80% |
8.74% |
-58.48% |
0.47 |
19.76% |
|
Large cap reference subset |
578.47% |
12.54% |
-41.51% |
0.79 |
15.08% |
Past performance is not a guarantee of future returns. Data Source: Portfolio123
DES lags this simple dividend and quality strategy applied in both large cap and small cap universes. It also shows a higher risk in drawdown and standard deviation of monthly returns (volatility). However, DES performance is real, whereas the reference subsets performance is hypothetical. My core portfolio holds 14 stocks selected in the large cap subset (more info at the end of this post).
Scanning DES portfolio for quality
DES shows better quality metrics than the Russell 2000 index. In particular, ROA is much better.
|
DES |
IWM |
|
|
Altman Z-score |
2.53 |
3.22 |
|
Piotroski F-score |
5.24 |
4.06 |
|
ROA |
6.31 |
1.13 |
Data calculated on a large sample representing 73% of asset value
Only about 5% of the 665 stocks held in the portfolio are risky regarding my preferred quality factors. These are companies with at least 2 red flags: bad Piotroski score, negative ROA, unsustainable payout ratio, bad or dubious Altman Z-score, excluding financials where these metrics are unreliable.
Takeaway
DES is a small cap dividend fund with more than 600 holdings. It is quite concentrated in financials (25.4%). DES is a bit cheaper than the small cap benchmark Russell 2000 regarding valuation metrics. It also has a better quality, measured in aggregate ROA and Piotroski F-score. DES shows a higher risk than IWM in drawdown and volatility, and its total return since inception is lagging the benchmark. However, it is mostly due to underperformance in 2020 and 2021. DES beats IWM in 2022 to date. The expense ratio of 0.38% looks a bit high in regard to past performance and the simplicity of its strategy. DES has an average rating at Morningstar (3 stars). For transparency, a dividend-oriented part of my equity investments is split between a passive ETF allocation and my actively managed Stability portfolio (14 stocks), disclosed and updated in Quantitative Risk & Value.
Be the first to comment