

A matrix is similar to these balanced stones Jonathan Kitchen
A Wider View
Some investors chase growth based on recent price performance or sell on breaking news. Recently, the market has broadly declined on economic news; over-inflated valuations; and sentiment based on market chatter and fear.
1-YR Price Return: DJIA, S&P 500, and NASDAQ Indexes
Seeking Alpha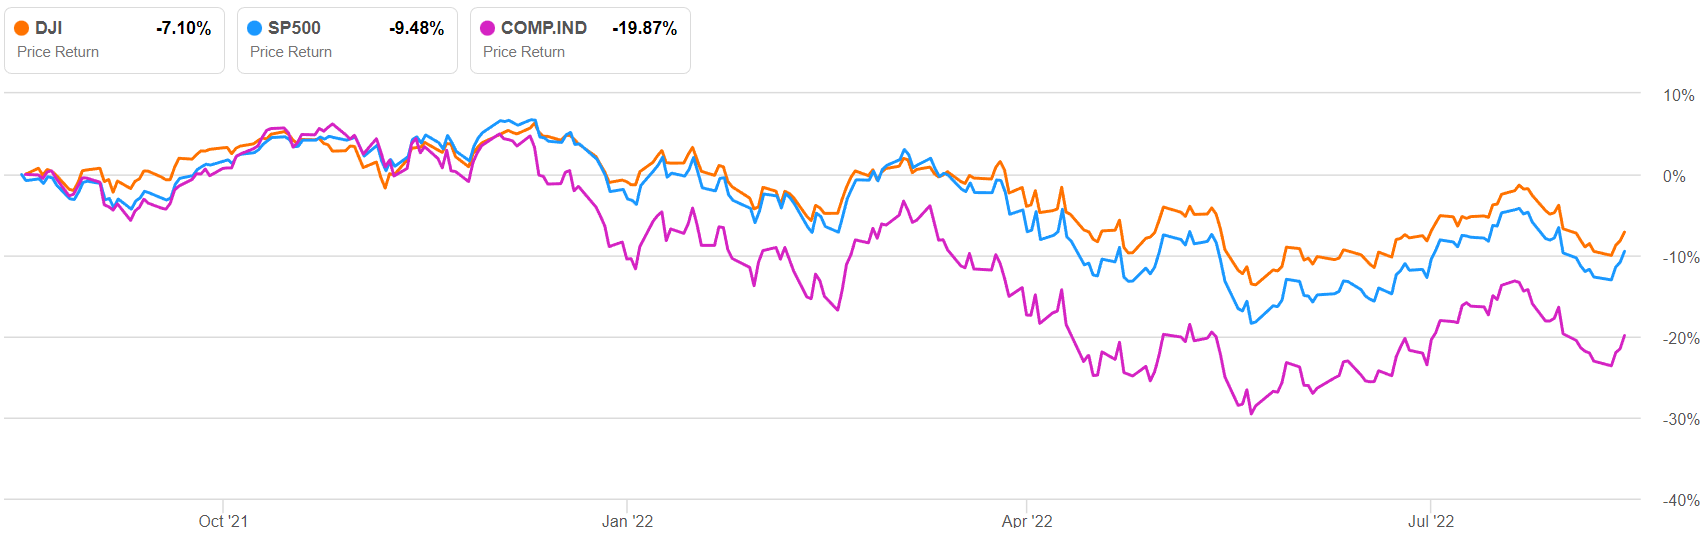
The market has been in a broad decline since early January, with DJIA (DIA), S&P 500 (SPY), and NASDAQ (QQQ) down 15-25% currently. While the recent trend is alarming, I prefer to begin by taking a wider view of the market and identify a promising sector or industry based on historical data and longer-term trends. Based on a wider view, the wireless services industry exhibits relatively safe valuations with high yield.
Why Wireless Services
5-Month Return: S&P 500
Author, BOA Data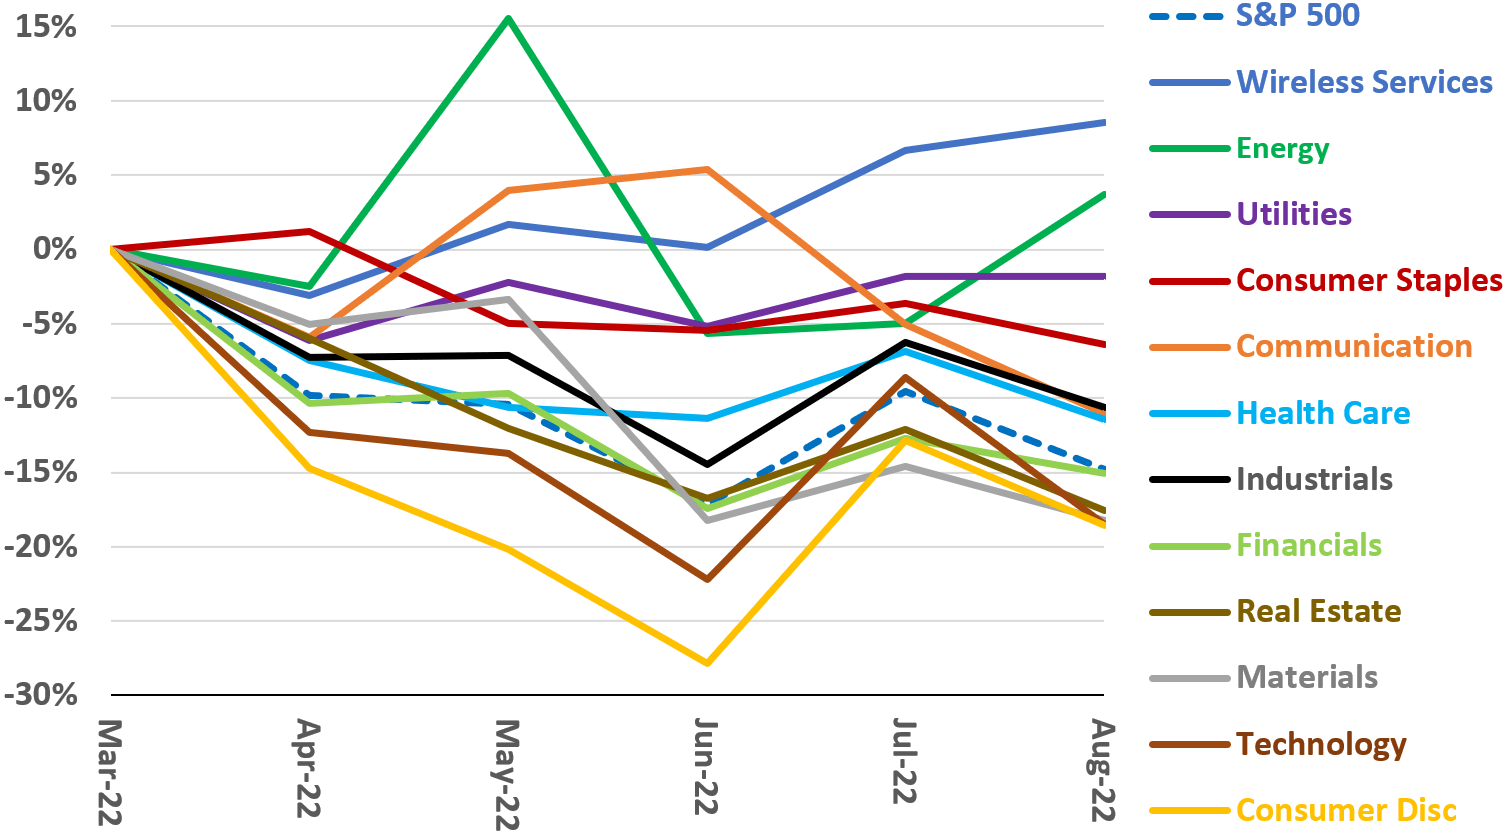
In the last five months, the broad decline has accelerated in most sectors excluding energy and utilities. A more notable exception is wireless services, a historically defensive industry within the broader communications sector. The wireless services industry has outperformed defensive sectors including utilities, consumer staples, and real estate.
Given current market conditions, wireless services appears to be a good industry to look for high yield and value. I will discuss six high-yield equities with substantial exposure to wireless services.
Durable Revenue
Historic Revenue (M)
Author, Seeking Alpha Data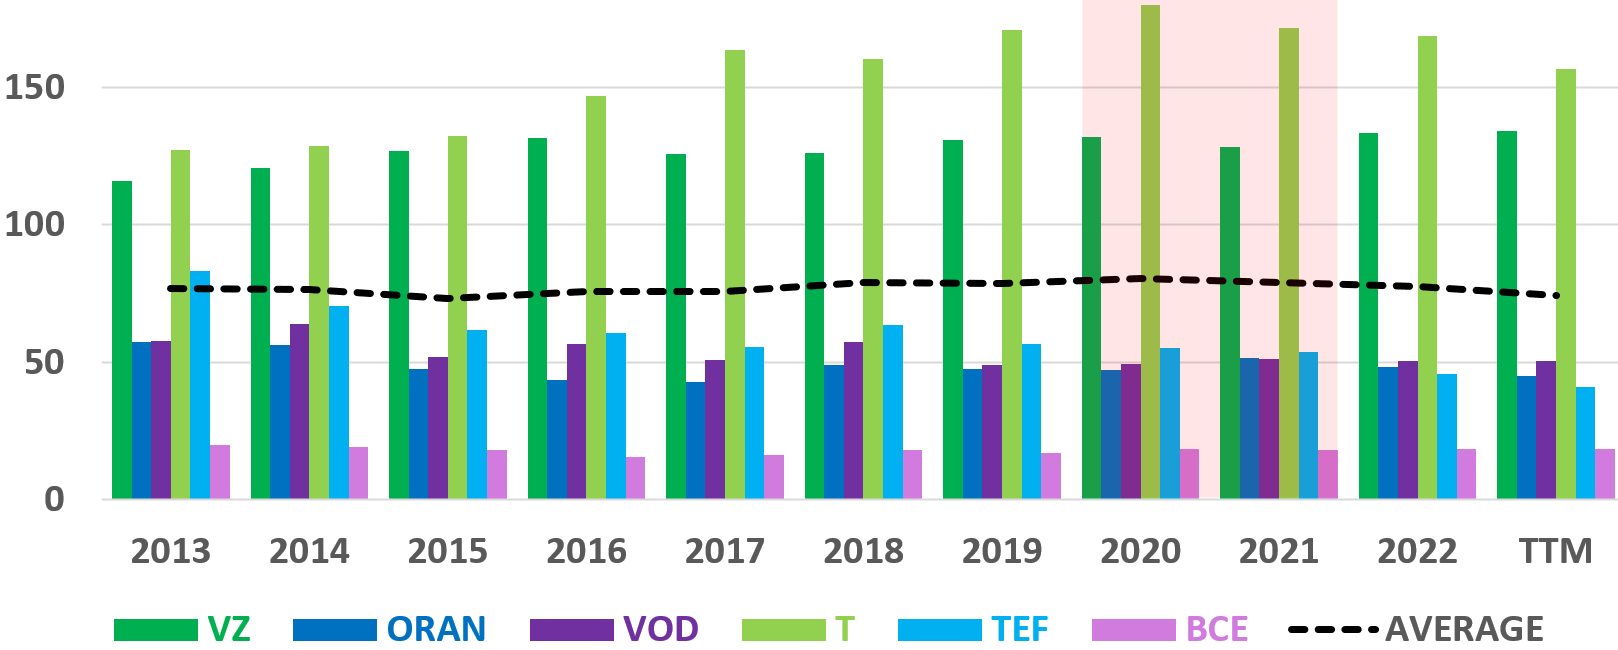
Total revenue over 10 years is plotted for six high-yield wireless providers: Verizon (VZ), Orange (ORAN), Vodafone (VOD), AT&T (T), Telefonica S.A. (TEF), and BCE Inc (BCE:CA). All six providers reported exceptionally durable revenue over the last 10 years including the pandemic interval highlighted in pink. Over that interval, average revenues contracted less than 2%; it was largely business as usual for these six wireless providers. Anecdotally, many wireless consumers consider wireless services to be as essential as keeping the lights on (utilities) and buying groceries (consumer staples).
Consistent Dividends
Historic Dividends
Author, Seeking Alpha Data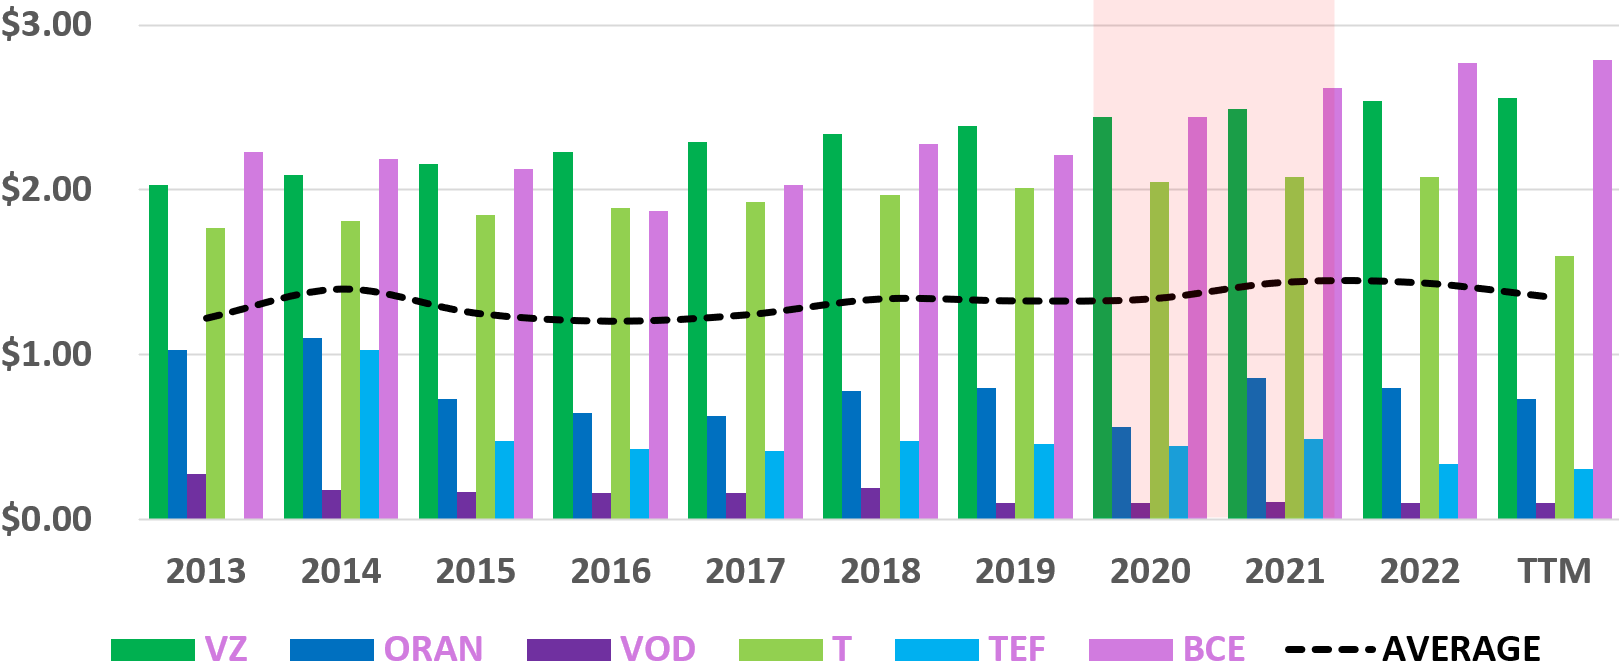
Dividend/share over 10 years is plotted for six wireless providers. Historically, durable revenue has allowed the industry to pay consistent dividends including through the pandemic interval. Average dividend/share actually increased almost 8% over the pandemic interval. Notably, the current downturn could eclipse that of the pandemic; it has already lasted longer than pandemic dip.
Payout Ratio
Author, Seeking Alpha Data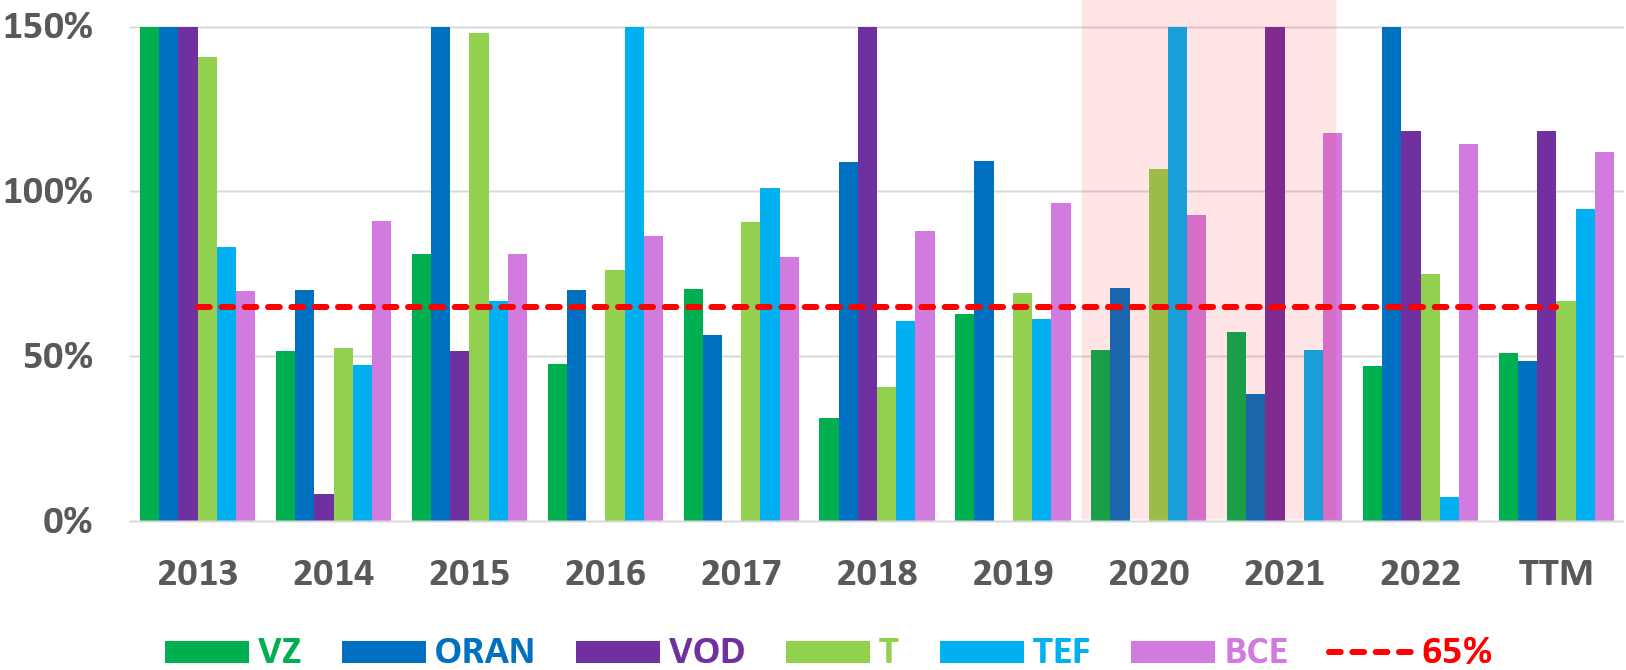
Dividend payout ratio is defined as dividend per share/EPS and generally a figure less than 65% is considered safe and sustainable. (Note: the maximum value on the vertical axis is 150%, but some historic values were much larger. The complete data is available here in a downloadable Excel file.) Although all six wireless providers have generally paid a consistent growing dividend over the last ten years, payout ratios have varied between providers and over time. VZ payout ratio has been consistently low recently with a 3-Yr average of 52%. Conversely, BCE payout ratio has been consistently high recently with a 3-Yr average of 109%.
A Matrix Approach: Relative Ranking of High Yield Wireless Providers
The matrix is designed to rank the six high-yield wireless providers relative to one another. Dividend yield is the primary factor with secondary factors including: dividend safety, dividend growth, value, revenue growth, and debt. The matrix and its factors were designed and calculated by the author within a downloadable matrix Excel file with Seeking Alpha sourced data.
Matrix Chart
Author, Seeking Alpha Data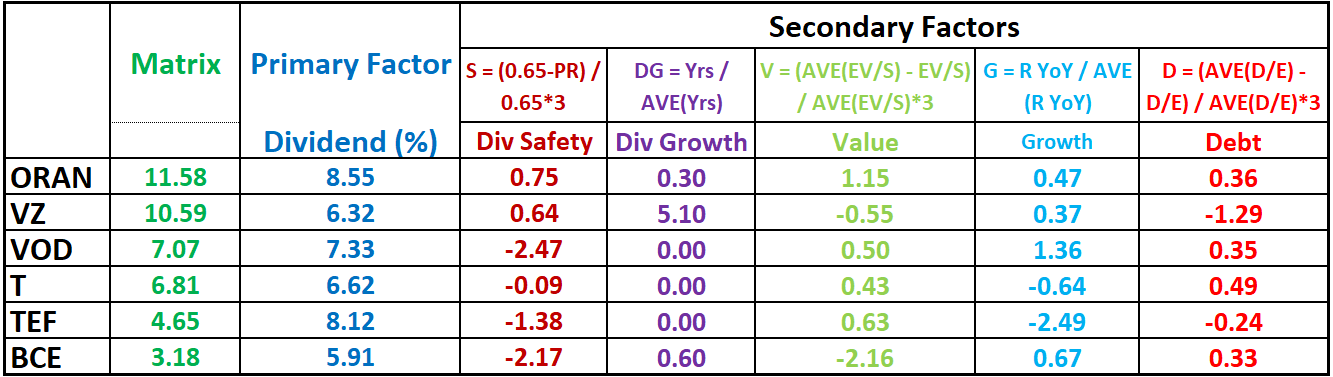
The six wireless providers are ranked relative to one another, with ORAN having the highest matrix value and BCE the lowest.
Matrix Plot
The matrix, its primary factor – dividend yield – and secondary factors are plotted on the bar chart below.
Author, Seeking Alpha Data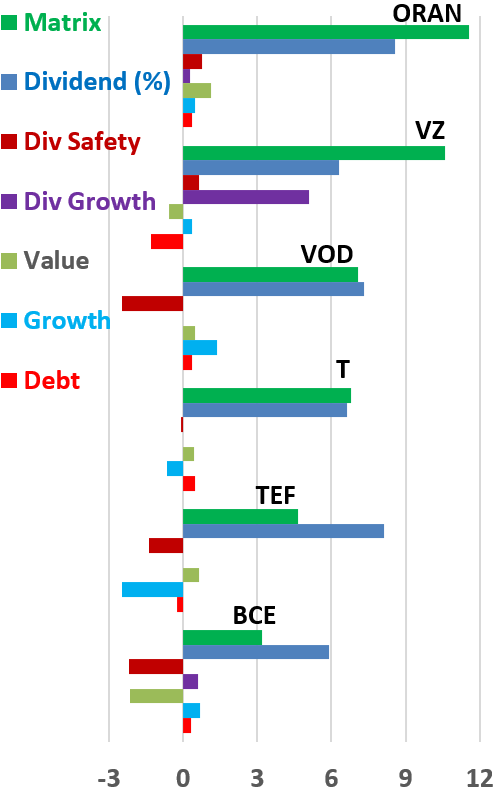
Matrix value is the sum of its factors and represented by the green bar.
Dividend Yield is the primary factor and represented by the blue bar.
Dividend Safety is represented by the dark red bar and based on payout ratio. Positive and negative values reflect a payout ratio lesser and greater than 0.65% respectively.
Dividend Growth is represented by the dark purple bar and based on consecutive years of dividend growth.
Value is represented by the light green bar and based on EV/Sales. Positive and negative values reflect EV/Sales lesser and greater than average respectively.
Revenue Growth is represented by the light blue bar and based on revenue YoY. Positive and negative values reflect growth greater and lesser than average respectively.
Debt is represented by the light red bar and based on debt/equity. Positive and negative values reflect debt/equity lesser and greater than average respectively.
Matrix Ranking Conclusions
Based on the value matrix, those investors who hold BCE, TEF, or T may wish to review their positions. Wireless providers with higher matrix scores may hold more promise. These include ORAN and VZ.
BCE matrix score is the lowest of the group largely as a result of notable negative factors. BCE payout ratio has been consistently above the safe level of 0.65%, with a 3-Yr average of 109%. Further BCE is overvalued when compared to the other wireless providers; its EV/sales is substantially greater than the group average. BCE was recently covered by Jordan Sauer in well-written analysis warning investors on payout ratio and over valuation.
ORAN matrix score is the highest of the group, with solid scores on all factors. ORAN was recently covered by Yannick Frey in a well-written analysis comparing ORAN to its European peers on value and growth.
Investor Takeaways
Given current market conditions, many investors are looking for safe, high-yield investments with favorable valuation. Based on historical data and longer-term trends, the wireless services industry has potential for high yield with safe valuation.
Investors should consider the value matrix a screen only. The matrix; primary factor; secondary factors, normalization method, and weights could all be adjusted and yield different results. Those investors who are most interested can download the matrix Excel file and work it over to better evaluate wireless providers given current market conditions & available data. Or, modify it completely and apply it to a whole new set of fuzzy data. I hope some investors find this analysis actionable and I look forward to comments.
Information is a source of learning. But unless it is organized, processed, and available to the right people in a format for decision making, it is a burden, not a benefit. – William Pollard
Be the first to comment