

Spencer Platt/Getty Images News
I first covered Williams-Sonoma, Inc. (NYSE:WSM) in early 2018 with a bullish rating despite a short interest at the time of 23% of the float (shares outstanding available to the public.) In the article, I wrote:
Just as the financial services players were battered during the Great Recession despite established name-brand quality, Mr. Market is now punishing the specialty retailers since anointing Amazon the new king (or queen) of retail.
Nevertheless, I liked the fundamentals, valuation, and risks and held a long position at the time. The shorts got squeezed, and the share price became a three-bagger over the next three years. Today, this specialty retailer remains a quality operator trading a reasonable stock price.
A few shorts are still hanging around, but I think only a market correction will benefit their position. So here is why I remain bullish on WSM.
Note: Unless noted, all data presented in this article is as of the market close on January 6, 2022; and intended for illustration only.
Williams-Sonoma Business Profile
WSM is a dividend-paying mid-cap stock in the consumer discretionary sector’s specialty retail (home furnishings) industry.
From the company’s investor relations website:
Williams-Sonoma, Inc. is a multi-channel specialty retailer of high quality products for the home.
In 1956, our founder, Chuck Williams, turned a passion for cooking and eating with friends into a small business with a big idea. He opened a store in Sonoma, California, to sell the French cookware that intrigued him while visiting Europe but that could not be found in America. Chuck’s business, which set a standard for customer service, took off and helped fuel a revolution in American cooking and entertaining that continues today.
Today, Williams-Sonoma, Inc. is one of the United States’ largest e-commerce retailers with some of the best known and most beloved brands in home furnishings. We currently operate retail stores in the United States, Canada, Puerto Rico, Australia, and the United Kingdom, and franchise our brands to third parties in a number of countries in the Middle East, the Philippines and Mexico. Our products are also available to customers through our catalogs and online worldwide.
(Source: Williams-Sonoma)
In addition to its flagship Williams Sonoma footprint, its branded retailers are Pottery Barn, Pottery Barn Kids, PBteen, West Elm, Mark and Graham, and Rejuvenation.
Beat the Market or Average to the Index
I target the major U.S. exchange-traded (NYSE and NASDAQ) common shares of high-quality, dividend-paying companies with market-beating history or potential. The alternative is indexing or being average to the market on both the upside and the downside. Unfortunately, last I checked, less than 25% of common stocks available to trade in the U.S. were outperforming the S&P 500 over the last 12 months.
I prefer to own a select basket of the few winners and, except for hedging, avoid the predominance of losers in an index fund.
My focus is on mid-caps and large-caps for potentially wider margins of safety in longer-term investing, leaving the more speculative, albeit worthy, small-caps to the professional, lowest-cost fund managers. Avoided are over-the-the-counter issues (OTC) and micro caps.
Nonetheless, the market cap reflects sentiment. Therefore, I pay less attention to the existing crowd think if the stock is compounding over the long term at a rate as good as, if not better than, expected at purchase.
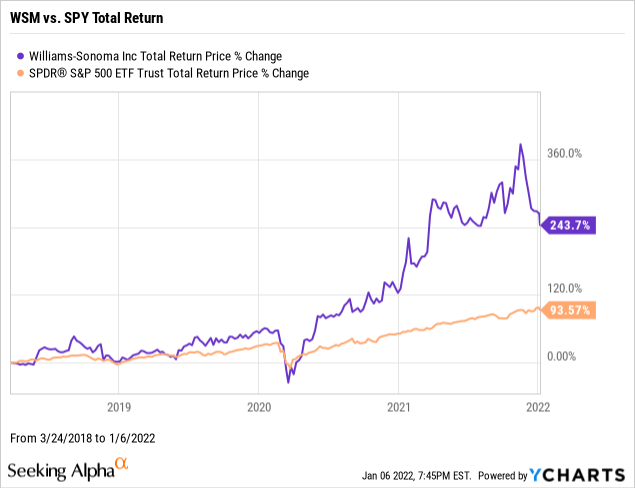
Since my original bullish article on WSM in March 2018, the stock had a total return in dividends plus capital gains of 243.70% versus 93.57% for the SPDR® S&P 500 ETF Trust (NYSE:SPY).
Despite the pandemic and alleged retail apocalypse, perennial quality operator Williams-Sonoma has trounced the market by over two and half times.
WSM Shareholder Yields
As part of my due diligence, I average the total shareholder yields on earnings, free cash flow, and dividends to measure how the stock compares to the prevailing yield on the 10 Year Treasury benchmark note.
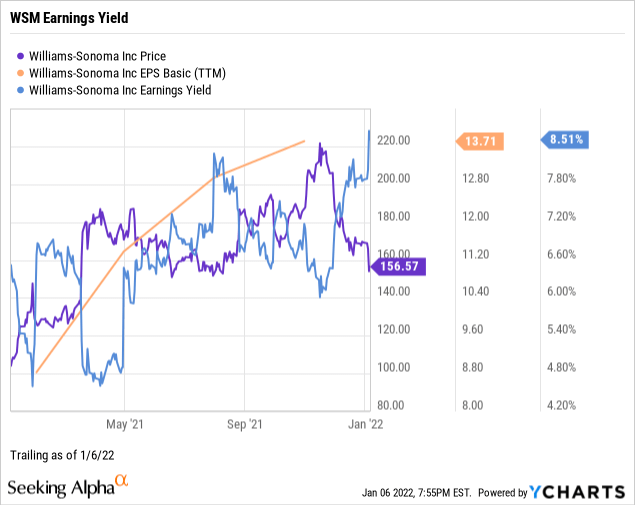
Earnings Yield
Earnings yield or EY is the inverse of the price-to-earnings ratio or P/E. Earnings yield indicates how much a company earns each year per common share relative to the stock price. The earnings per share or EPS represent the portion of the profits of the operation allocated to each outstanding share of common stock. I target an EY of greater than 6 percent or the equivalent of a P/E multiple of below 17 times.
Assuming trailing one-year earnings of $13.71 per share as presented by YCharts, the EY for WSM was 8.51%, above my 6.00% threshold.
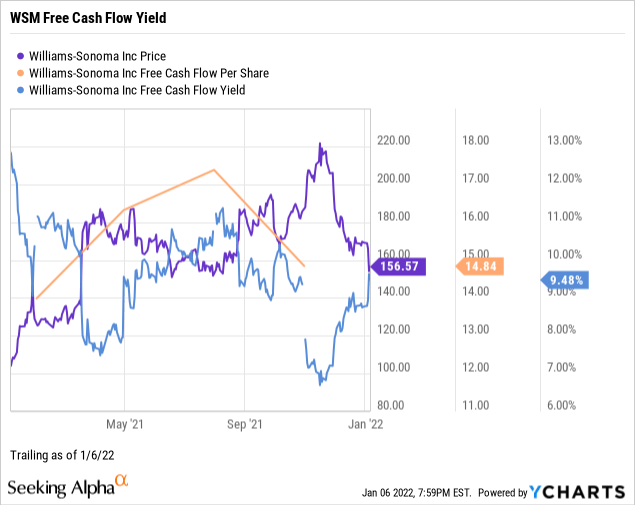
Free Cash Flow Yield
Free cash flow yield or FCFY indicates how much a company generates in free cash flow each year per common share relative to the stock price. Free cash flow per share is the cash available after operating expenses and capital expenditures divided by shares outstanding at the end of the most recent fiscal period. I target an FCFY of 7 percent and higher or the equivalent of fewer than 15 times the inverted price-to-free cash flow multiple.
Assuming a $14.84 cash flow per share, as illustrated by YCharts, the FCFY for WSM was 9.48%, above my 7.00% threshold.
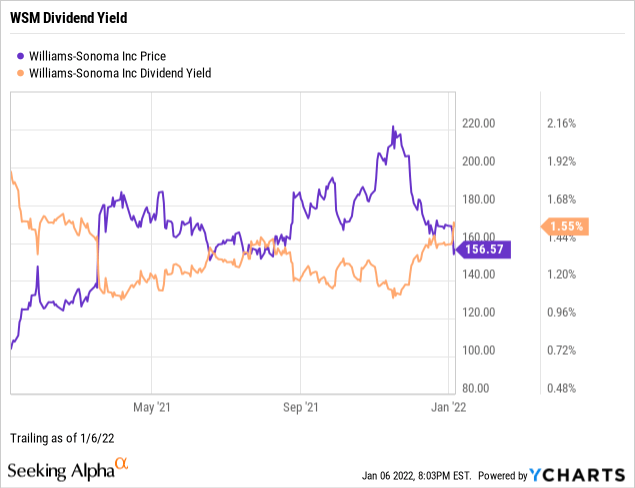
Dividend Yield
Dividend yield indicates how much a company paid out in averaged dividends for the trailing twelve months relative to the share price. To avoid high-yield equity junk, I limit our family’s portfolio holdings to trailing twelve-month rates below 5 or 6 percent.
According to YCharts, the dividend yield for WSM was 1.55%. Although William-Sonoma’s dividend is nothing to get excited about, I prefer dividend-paying stocks to keep paid in the short-term while waiting for capital gains to compound over the longer term.
Average of Shareholder Yields
I take the average of the three shareholder yields to measure how the stock compares to the prevailing yield on the 10 Year Treasury benchmark note.
The average shareholder yield for WSM was 6.51% vs. 1.72% for the 10 Year Treasury’s prevailing rate.
Williams-Sonoma fills the stock shopper’s investment cart at a level superior to the conventional government note. Arguably, stocks are deemed riskier than U.S. bonds. However, WSM’s average total shareholder yield beating the benchmark Treasury by almost four times is hard to ignore.
WSM Return on Management
Next, I will explore the fundamentals of Williams-Sonoma, reflecting the performance strength of its senior management.
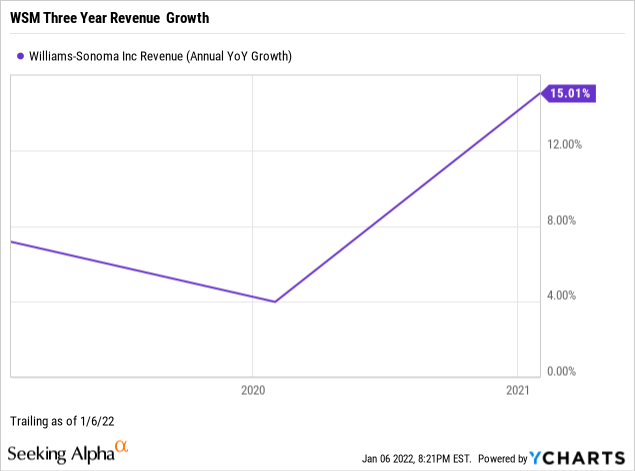
Revenue Growth
Revenue growth is the compounded annual growth rate of revenues or net sales. Generally, I avoid owning slices of companies with negative revenue growth.
Williams-Sonoma had double-digit three-year growth of 15.01% on its top line per YCharts. When analyzing a company, I am biased toward established growth instead of executive promises and analyst projections.
Notable is Williams-Sonoma’s spike in revenue growth since the March 2020 market capitulation.
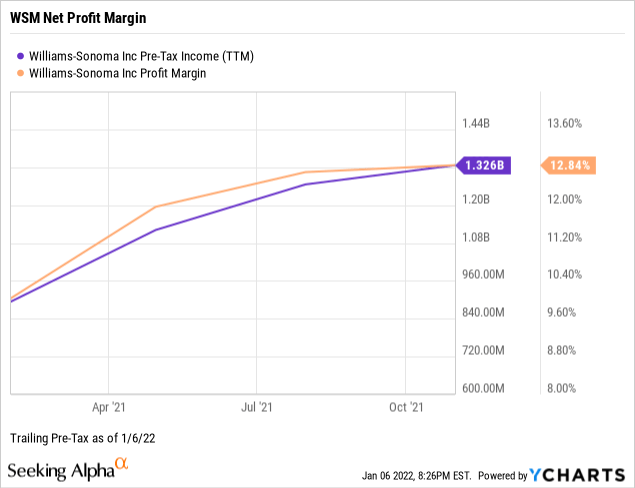
Net Profit Margin
Net profit margin is the percent of revenues remaining after paying operating expenses, interest, and taxes divided by sales for the trailing twelve months. I seek profitable companies to avoid unnecessary speculation. Investors who go long the stocks of money-losing companies should expect to lose money on their investments more often than not.
Williams-Sonoma had a trailing and growing pre-tax income of $1.33 billion for a net margin of 12.84%. So whenever I discover the rare retailer with a double-digit bottom line, I get interested.
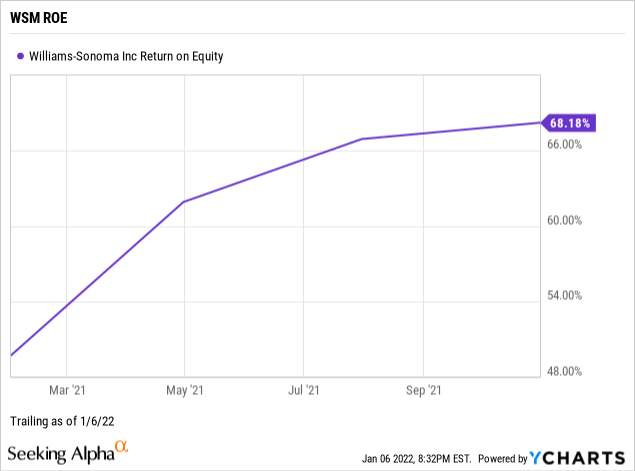
Return on Equity
Return on equity or ROE is the income available to common shareholders for the trailing twelve months divided by the average ownership equity of the stockholders from the most recent fiscal period and the year-earlier fiscal period, expressed as a percentage. ROE reveals how much profit a company generates from shareholder investment in the stock. I target an ROE of 15 percent and higher.
Williams-Sonoma had a trailing return on equity at a whopping 68.18%, far above my threshold for discovering shareholder-friendly management.
In 2018, the Williams-Sonoma board of directors authorized $500 million in share buy-backs (Source: The Online Investor). Keep in mind that share repurchases make positive impacts on returns on equity.
More importantly, investors should be asking if the board repurchased shares at reasonable prices, which appears the case for Williams-Sonoma.
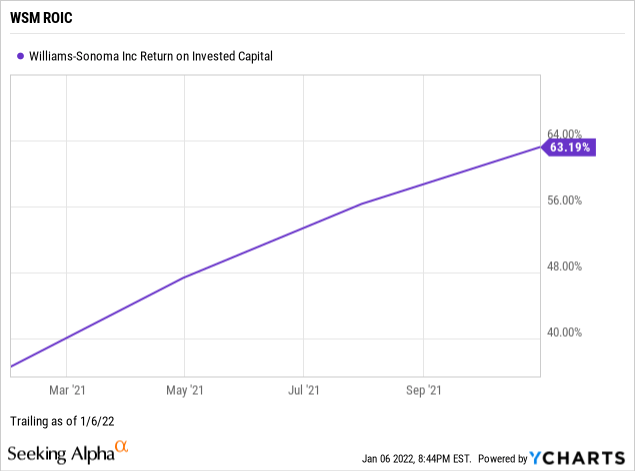
Return on Invested Capital
Return on invested capital or ROIC is net income after taxes divided by the average of total equity plus the sum of total long-term debt, total other liabilities, deferred income tax, and minority interest, expressed as a percentage. ROIC measures how well a company uses its working capital to generate returns. I target an ROIC above 12 percent, although returns on investment had been tanking market-wide during the pandemic.
Williams-Sonoma had a 63.19% trailing return on invested capital. Its ROIC rose considerably in 2021 as it successfully navigated the COVID-19 pandemic. For example, it generated working capital via ~70% of sales from e-commerce channels. (Source: SA contributor, WideAlpha, in a recent bullish article on WSM.)
Weighted Average Cost of Capital
The weighted average cost of capital or WACC illustrates the corporation’s cost of capital, weighing each category in proportion. Therefore, the ROIC needs to exceed the WACC by a comfortable margin giving credence to the ability of management to outperform its capital costs.
Williams-Sonoma had a trailing weighted average cost of capital of 10.56% (Source: GuruFocus). Although its WACC is considerably high, the current spread of return on invested capital exceeding costs of the capital by six times is compelling, if not something to keep an eye on.
WSM Valuation
Our concentrated family portfolio of dividend-paying common stocks has outperformed the broader market since 2009 based on an equal-weighted average total return of each position vs. the S&P 500 during the same holding periods. Access to The Model Portfolio is, at present, complimentary. Visit my Seeking Alpha Author Profile for the link.
Although Wall Street convinces us otherwise with highly sophisticated valuation models, investing in the stock market is not rocket science. I submit that uncovering the common shares of quality companies temporarily trading at reasonable prices is basic science.
Instead of speculating on potential barn burner growth stocks as I did earlier in my investing career with limited success, I prefer the art of finding the proverbial needle in the haystack before the barn burns to the ground.
As highlighted in my latest book, Build Wealth With Common Stocks: Market-Beating Strategies for the Individual Investor, I rely on just four valuation metrics to estimate the intrinsic value of the stock price of a targeted quality enterprise.
Please note that I do not attempt to determine specific future stock prices or percentage targets as I view such practices as arbitrary, if unreliable.
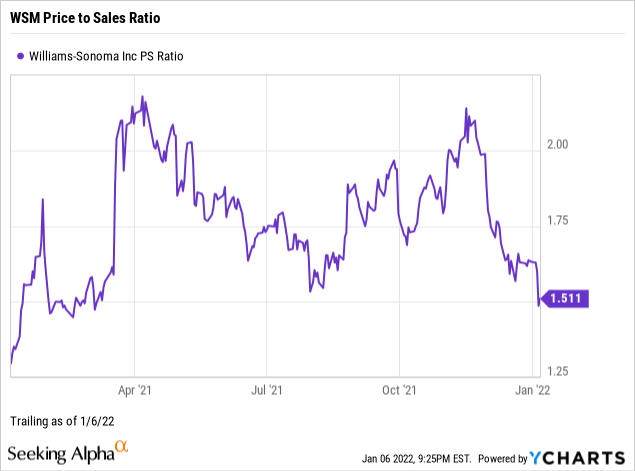
Price to Sales
The price-to-sales ratio or P/S is the closing stock price divided by the sum of sales per share over the trailing twelve months. Price-to-sales measures the stock price relative to revenue. I target a P/S of fewer than 2.0 times.
WSM had a reasonable price to sales ratio of 1.51, indicating the market is somewhat discounting the stock price relative to Williams-Sonoma’s trailing top-line revenue.
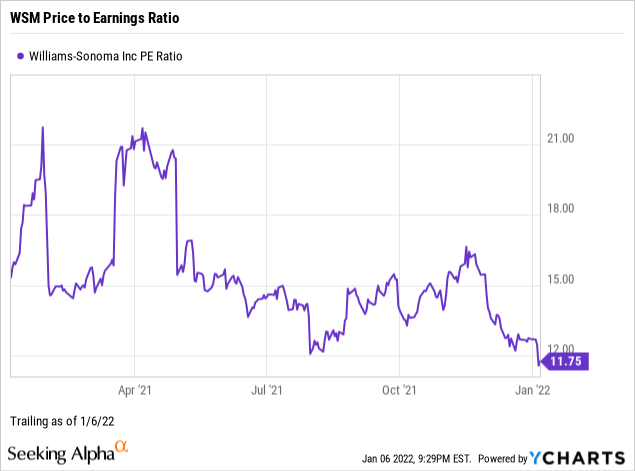
Price to Earnings
Price-to-trailing earnings or P/E is the closing price divided by the sum of GAAP diluted earnings per share over the trailing twelve months. P/E is the inverse of the earnings yield. Although an arbitrary multiple, I target a P/E of fewer than 17 times or below the target stock’s industry averages.
WSM had a price-to-earnings multiple of 11.75, indicating that market sentiment is deeply discounting the stock price relative to its earnings compared to the S&P 500’s overall PE of 29.33 as of December 31, 2021. (Source of S&P 500 PE: Barron’s)
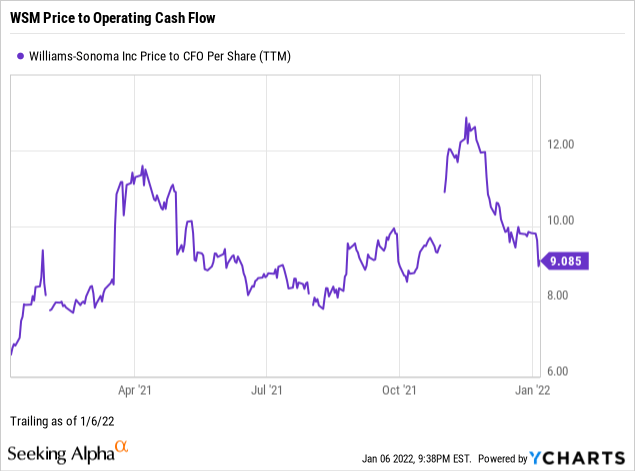
Price to Operating Cash Flow
Price-to-operating cash flow or P/CF is the previous closing stock price divided by cash flow from operations per share for the most recent fiscal year. For the best value, I target single-digit multiples.
WSM had a single-digit price to cash flow of 9.09, indicating the market is discounting the stock price relative to the company’s current cash flows.
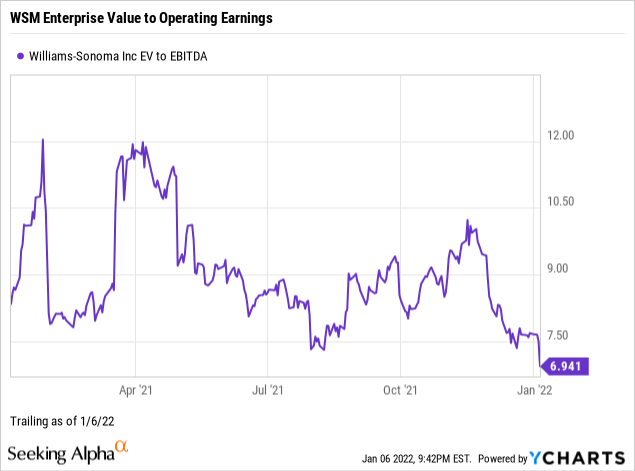
Enterprise Value to Operating Earnings
Enterprise value to operating earnings or EV/EBITDA is the stock’s market capitalization plus the company’s debt, minority interest, and preferred shares, minus total cash and cash equivalents or EV divided by earnings before interest, taxes, depreciation, and amortization or EBITDA. Enterprise value to operating earnings measures whether a stock is overbought, a bearish or neutral signal, or oversold, a bullish or neutral signal, by the market. I target an EV/EBITDA of fewer than 12 times.
WSM had an EV/EBITDA of 6.94, signaling the market has oversold or underbought the stock into value territory.
WSM Margin of Safety
The margin of safety is a principle of value investing where an investor purchases securities when the market price is comfortably below the perceived intrinsic value.
Although Wall Street uses standard formulas based on models projecting future free cash flows and other hypotheses, I am forever wary of the assumptive projections of those methods.
I am biased toward excellent companies whose common shares are experiencing out-of-favor market sentiment as suggested by lower ratios of price-to-sales, price-to-earnings, price-to-operating cash flow, and enterprise value to operating earnings. Thus, I weigh the above key indicators to determine the overall market valuation of the targeted company.
The weighting of my four preferred valuation metrics suggests that WSM’s current stock price, although a three-bagger since my bullish article in early 2018, remains undervalued by the market. Based on the metrics shared in this article, risks and catalysts notwithstanding, I would call WSM a marked-down stock of a quality retail enterprise.
WSM Downside Risk
When assessing the downside risks of a company and its common shares, I focus on five metrics that, in my experience as an individual investor and market observer, often predict the potential risk/reward of the investment.
Economic Moat
An economic moat is a competitive advantage, wide, narrow, or none, that a company’s products or services have over other businesses within the same industry. I target companies that own wide or narrow moats.
The leading authority on competitive advantage research, Morningstar, assigns Williams-Sonoma a narrow moat rating.
While discretionary spending can be fickle, we believe Williams-Sonoma has built a defensible position in the domestic home furnishings industry, despite capturing only mid-single-digit market share. In our opinion, the company has carved out a narrow economic moat when considering the solid adjusted returns on invested capital (including goodwill) that the business has delivered over the past decade at 18%, higher than our 9% cost of capital. We forecast ROICs that rise to more than 30% as some of the economic profits that are generated are reinvested into the business to elevate the brand, and as the business grows into more accretive segments (B2B, for example). We contend that Williams-Sonoma’s brand intangible asset has historically been the supporting factor in the firm’s top- and bottom-line growth, as its ability to drive repeat business is widely reliant on customer loyalty and smart marketing and merchandising. Its cross brand loyalty program, The Key, with 12 million members at the end of 2020, offers an incremental revenue opportunity that is 4 times that of single brand consumers. — Jaime M. Katz, CFA, Senior Equity Analyst, November 23, 2021.
Long-Term Debt Coverage
A favorite of the legendary value investor Benjamin Graham, long-term debt coverage measures current assets or CA divided by long-term debt or LTD. CA/LTD demonstrates balance sheet liquidity or a company’s capacity to pay down debt in a crisis. Generally, one-and-a-half times long-term debt to current assets is ideal.
As reflected on its Q3 2021 balance sheet, Williams-Sonoma’s long-term debt coverage is a perfect 100, as there is zero long-term debt on its balance sheet (Source: Seeking Alpha). Of course, one could argue that the company did not take advantage of the low-interest-rate environment. Still, zero debt is an attractive business practice that protects the interests of an enterprise’s long-term shareholders.
Short-Term Debt Coverage
Current liabilities coverage, commonly referred to as the current ratio or CR, is the total current assets divided by total current liabilities for the same period. CR measures the short-term liquidity of the balance sheet. I target higher than 1.00, although a quality company may have a CR of less than one because of the industry served.
Currently, William Sonoma’s short-term debt coverage or current ratio is 1.29 (Source: Seeking Alpha), which is excellent for a retailer.
Stock Price Volatility
Beta gauges the volatility or systemic risk of a stock compared to the market as a whole. I use a two- to five-year beta trend line and screen for companies with betas lower than 1.25. For example, The S&P 500 beta is constant at 1.00.
As of this writing, WSM’s 24-month trailing beta is a borderline volatile 1.23 (Source: Seeking Alpha).
Market Sentiment
Short interest represents the percentage of outstanding shares that investors have borrowed to sell short and have yet to cover or close the position. The short interest provides a sentiment indicator that the market is betting the price of a stock will fall. When the short interest exceeds 10 percent of the float, I become wary of a speculative deep value play and dive deeper.
The short interest on WSM being 23.03% in 2018 suggests some short-side investors possibly took a beating as the stock price tripled. A short trader’s tongue-twister:
Shorts in time are left short and cover their shorts before losing their shirts.
Defer shorting the market to the professionals who confidently walk the tightrope of such speculative practices.
As of the market closing on January 6, 2022, the short interest as a percentage of the float for WSM was 7.86% (Source: Seeking Alpha), under my 10% threshold, but still an indication that bears are prowling the retail space.
WSM Catalysts
Events that could accelerate my bullish investment thesis on Williams-Sonoma include but are not limited to:
- Another short squeeze on the remaining bears as Williams-Sonoma continues to deliver on the fundamentals.
- The multi-channel specialty retail environment improves as society transitions from a pandemic to an endemic.
Events that could invalidate my investment thesis on WSM include but are not limited to:
- Williams-Sonoma’s inability to remain competitive with formidable peers such as RH (NYSE:RH), Home Goods (NYSE:TJX), Wayfair (NYSE:W) or Amazon (NASDAQ:AMZN), and goes south along with beaten-down homefurnishing retailer, Bed Bath & Beyond (NASDAQ:BBBY). Although an unlikely event, never say never when it comes to retailers.
- Out-of-control inflation or recession tempers consumer buying power sector-wide.
Fundamentals and Valuation Squeezing Bears
Despite sizeable short interest in early 2018 and the ensuing coronavirus pandemic, the common shares of Williams-Sonoma squeezed a three-bagger return for the courageous bulls. And, in defiance of the retail apocalypse storyline, the company increased e-commerce channel sales from 50% to 70% of revenues during the same period.
At present, WSM’s averaged combined yields on earnings, free cash flow, and dividends are trouncing the Ten Year Treasury benchmark, and the stock price was beating the market by two and a half times.
Fundamentals, valuations, risks, and the upside remain compelling, although potential downside catalysts such as competition, inflation, and recession are noteworthy.
Nevertheless, Williams-Sonoma is a quality enterprise whose stock appears reasonably priced, inviting retail investors to explore initiating a buy or adding to an existing long position.
Be the first to comment