

cemagraphics
A fine month for the stock market
From the intra-day lows seen in mid-October, the S&P 500 has since rallied in fine bear market fashion to the tune of ~15%. Spurred in part by last week’s lower-than-expected inflation print and continued hopes of a Fed pivot, as I noted last month this relief rally was both overdue and needed. With the gains now on par with previous bear market rallies seen this year, the headwinds of a rising dollar and rising yields appear to have abated for now, and with the talk of a post-mid-term election rally into Christmas front and centre, what better time to make the bull and bear case for stocks as we close out the year.
StockCharts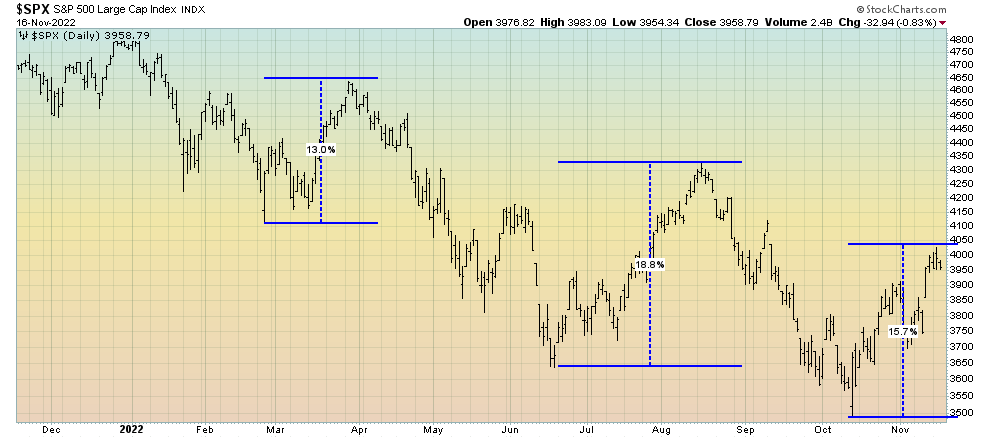
The bull case
As has been obvious for several months now, bearish sentiment and bearish positioning remain a theme that is yet to resolve itself. Why this matters for markets is that until it does, stocks will have a difficult time finding any kind of long-term bottom and risk continued counter-trend rallies to the upside.
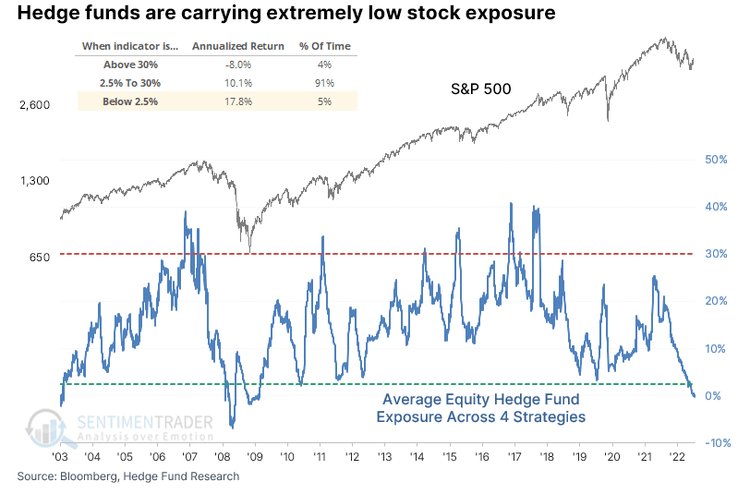
Hedge funds and trend followers, in particular, are a case in point as to this dynamic. Both remain significantly underexposed to equities and equity beta. This is where the upside risk for the market lies. Should this rally continue higher come December, institutional money managers looking to lock in their end-of-year performance bonuses will undoubtedly chase stocks higher. Expect these market participants to chase the rally should it continue. These flows are very real and very powerful.
SentimenTrader SentimenTrader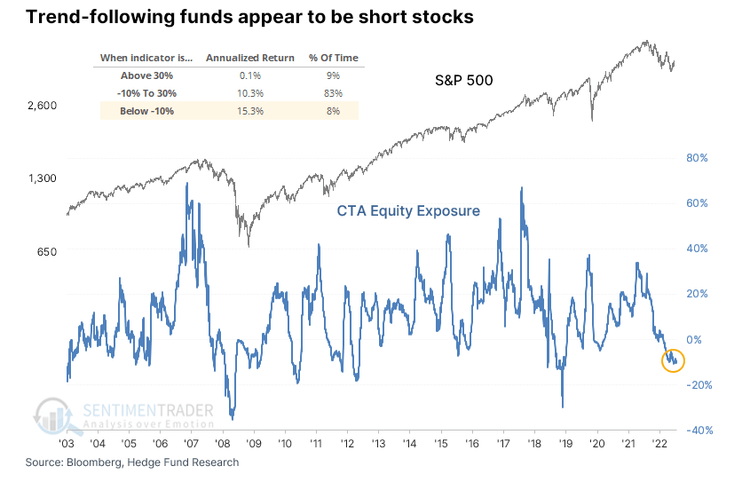
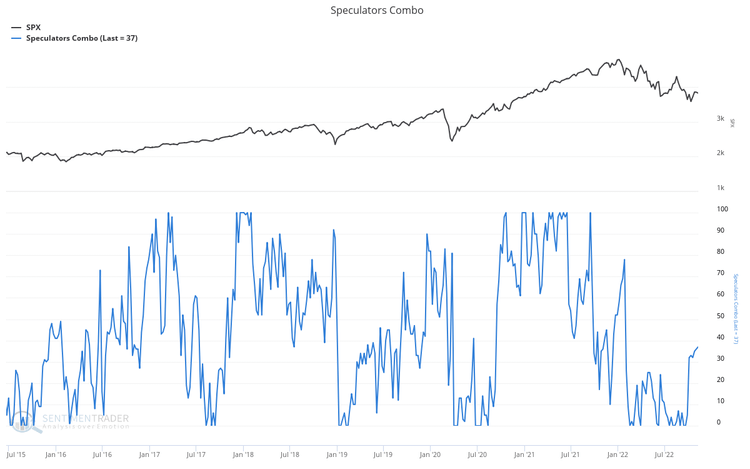
Similarly, speculative positioning remains heavily bearish. Though spec shorts have been squeezed this past week, they remain heavily bearish. Again, further short-covering of hedge funds, trend followers, and speculators alike could continue to squeeze markets higher. Because of this, the pain trade is still upside.
SentimenTrader SentimenTrader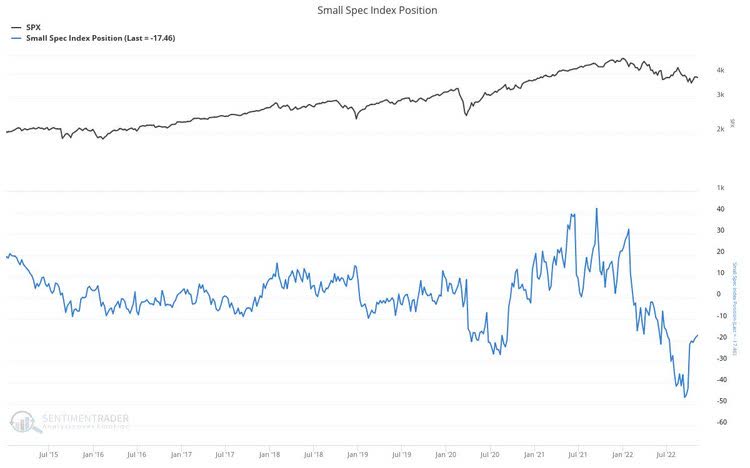
What has been notable this year is how 2022 has effectively been one single trade. Short stocks, short bonds, or long the dollar, the outcome has been the same. We can see below the correlation between the dollar and yields compared to stocks and how it has been negative for much of the year, so much so that the July through August and October through November rallies occurred on the back of a drop in yields and in the dollar.
StockCharts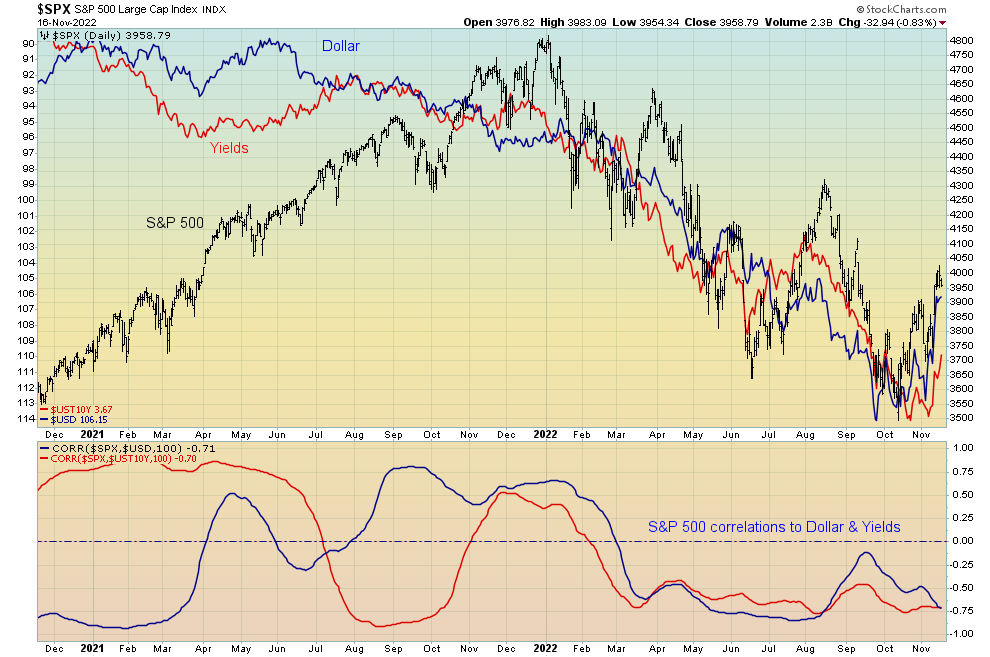
It must be said, however, that the recent moves in both do appear to be somewhat different this time. Technical damage has been done these past couple of weeks.
For one, yields have been looking a little toppy for some time now, with this break lower out of an ascending wedge pattern (generally a bearish reversal technical structure) occurring on the back of bearish momentum divergences in both RSI and price relative to the 50-day moving average, as well as a daily 9-13-19 DeMark sequential sell signal. The technical signs were there. Now that the 50-day moving average has been lost, we could see the 10-year Treasury fall another couple of percentage points very soon down to support around 3.5%. If recent history is any guide, stocks will react positively to this outcome.
StockCharts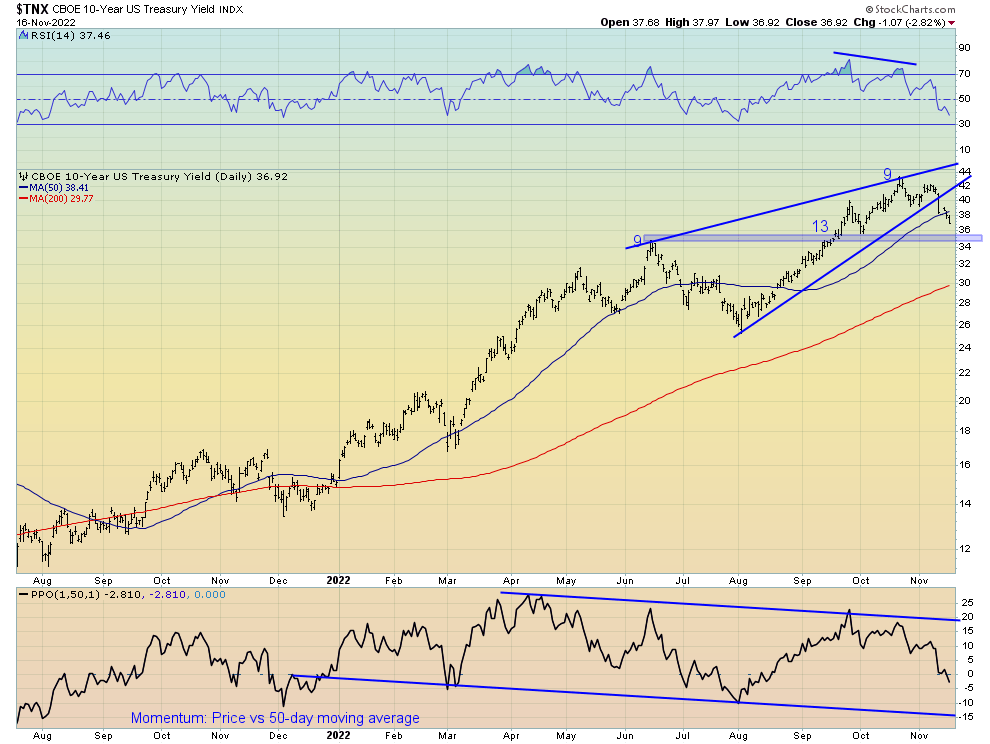
For the dollar, the technical picture is even worse with this sell-off coming hard and fast following a breakdown of the year’s uptrend channel. The 200-day moving average is now the key area of support, though it must be said this looks to be a likely area for consolidation or even a short-term bounce in price. Though I remain bullish on the dollar given the outlook for the business cycle, the dollar may have topped from a cyclical perspective.
StockCharts
It must be said, however, that any hawkish rhetoric from the Fed in the coming weeks will do well to quell any further movements lower in both the dollar and yields for the time being. Remember, the Fed has made it clear they want tighter financial conditions to rein in inflation. Rallies in stocks only serve to loosen financial conditions, and with the hard data points within the labour market and inflation yet to come anywhere close to a level that would satisfy the Fed, hopes of a pivot or even a pause are still wishful thinking for now. Fed officials are aware of the fact that a recession will likely be the by-product of their tightening agenda, so any “pivot” from the Fed, for now, will come in the form of a slowing down in the pace of rate hikes, rather than outright stopping hiking rates. While this would likely be bullish for gold and precious metals, it does little to alleviate the actual pain tighter monetary policy has on the economy and stock market alike.
Herein lies the bear case for stocks.
The bear case
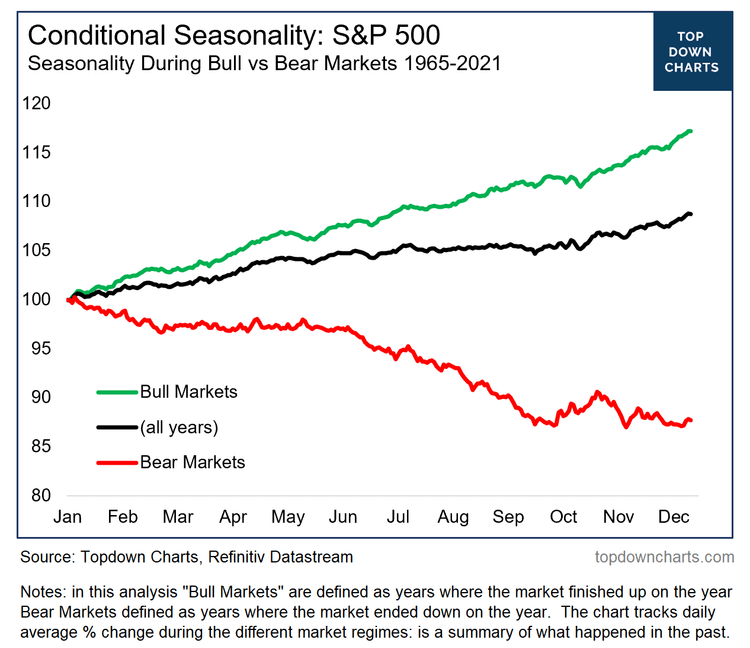
It is true that seasonality is a very real phenomenon grounded in underlying market structure, what is also true is that while seasonality is generally bullish during mid-term election cycles as a whole, what is perhaps overlooked is that this dynamic has historically been conditional on whether we are amid a bear or bull market. This holds true for both years with mid-term elections and without.
Unfortunately for bulls, while October and the early parts of November have indeed historically been bullish from a seasonal perspective, during bear markets – to which we are undoubtedly in – the latter half of November through the turn of the year is not so rosy.
TopDownCharts.com TopDownCharts.com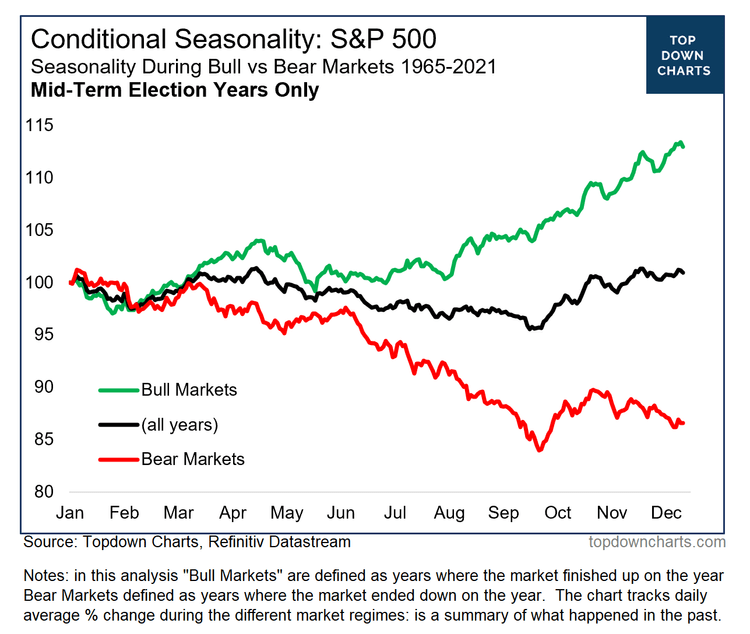
Other indicators suggesting this rally may have run its course, for now, are some of the short-term measures of breadth to which I monitor. Divergences from the price action of the broad index tend to signal short-term tops or bottoms, with this week’s highs coming alongside bearish breadth divergences in both the percentage of stocks within the S&P 500 above their 20-day moving averages and the eight-day rate-of-change for the S&P 500 advance-decline line.
StockCharts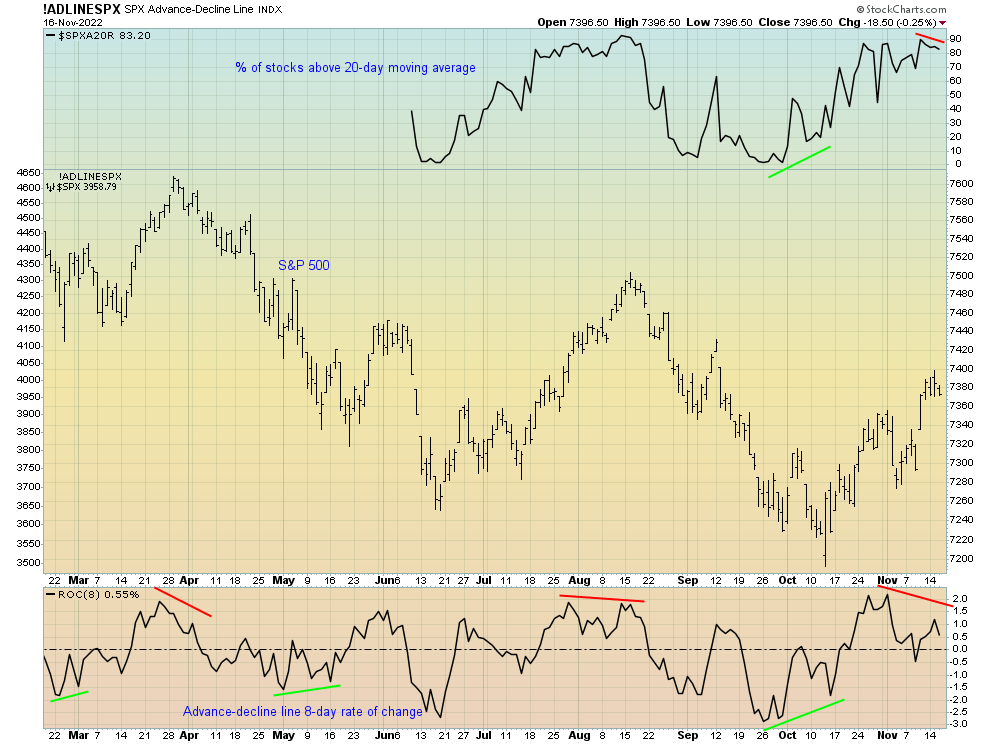
Similarly, the FX Weathervane (per the unique work of Chris Carolan) has too diverged bearishly following the recent highs. Like the short-term measures of market breadth above, this indicator has done a good job of signaling the short-term market tops and bottoms in recent times.
StockCharts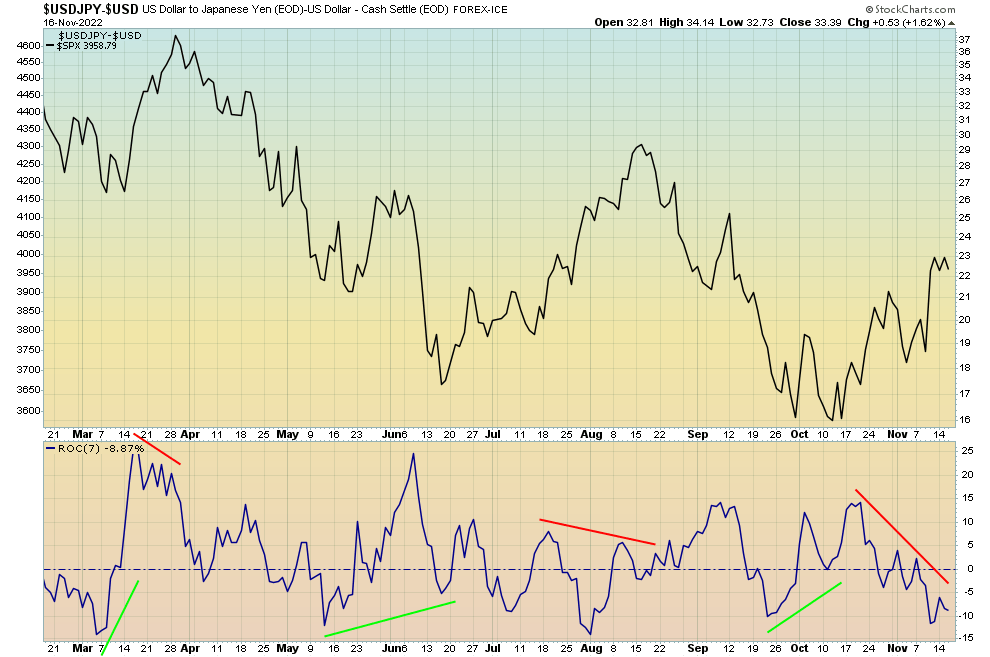
From a technical perspective, the market again looks to be nearing an important area. For the S&P 500, the 4,050-4,100 area coincides with both the 200-day moving average and the current downtrend line, to which the price action reacted both harshly during the August rally highs and which again are likely to act as important resistance levels. Keep an eye on this level.
StockCharts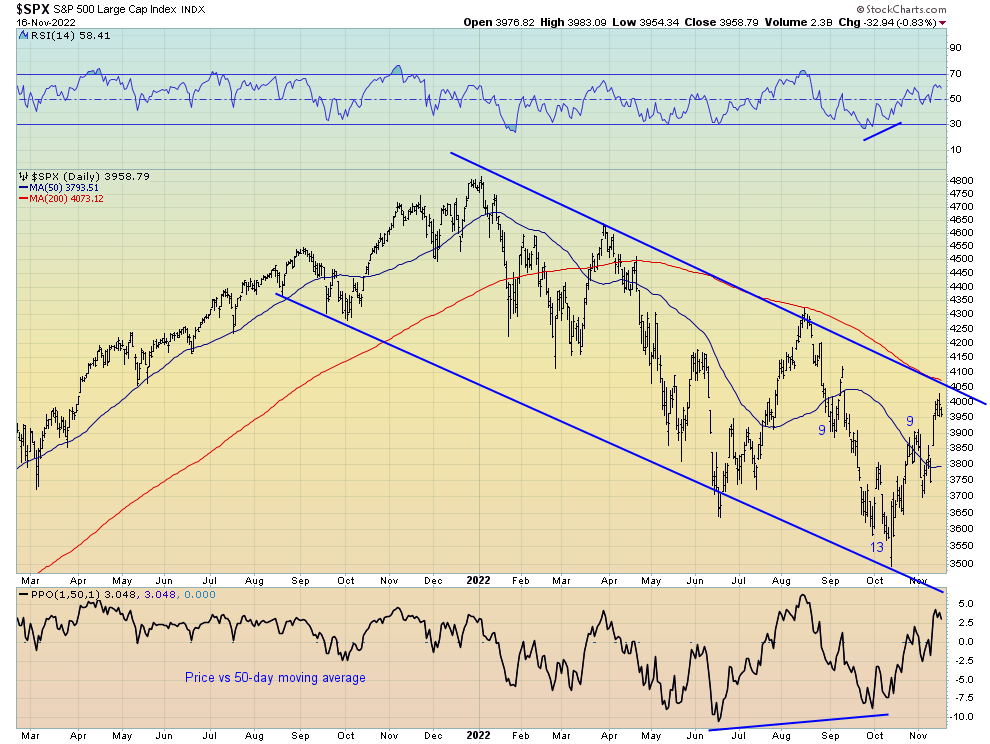
Whatever happens, expect a quiet close to the week
Regardless of whether we see a blow-off top in stocks in the coming months, what is highly likely is a very muted close to the week. Indeed, from a volatility and dealer gamma perspective (what on earth is gamma?), the 4,000 area on the S&P 500 has a significant level of gamma exposure for dealers and thus will likely act as a pin going into Friday’s OpEx.
Tier1 Alpha Tier1 Alpha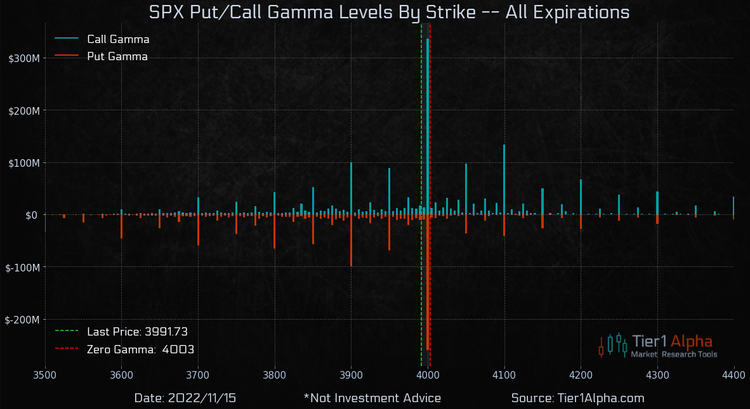
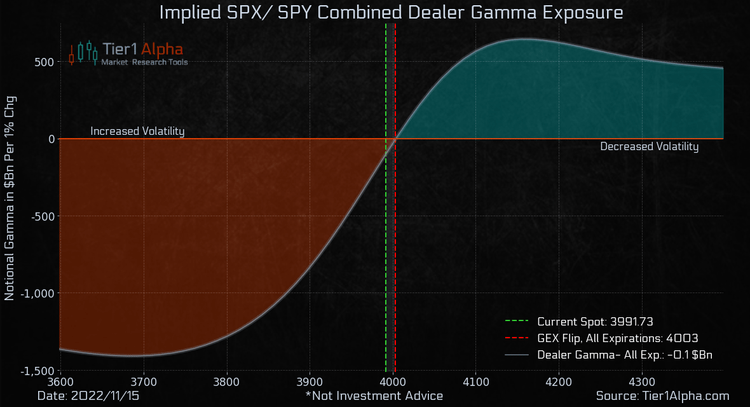
If we are going to see significant realised volatility, barring any data surprises or exogenous shocks in the coming days, expect this not to occur until next week.
A quick word on earnings
One dynamic in particular which is only just beginning to weigh on stocks is the earnings cycle. Along with the economy, corporate earnings are likely to decline swiftly in the coming months. Although the stock market tends to bottom before the earnings cycle bottoms, we are unfortunately not close to the latter.
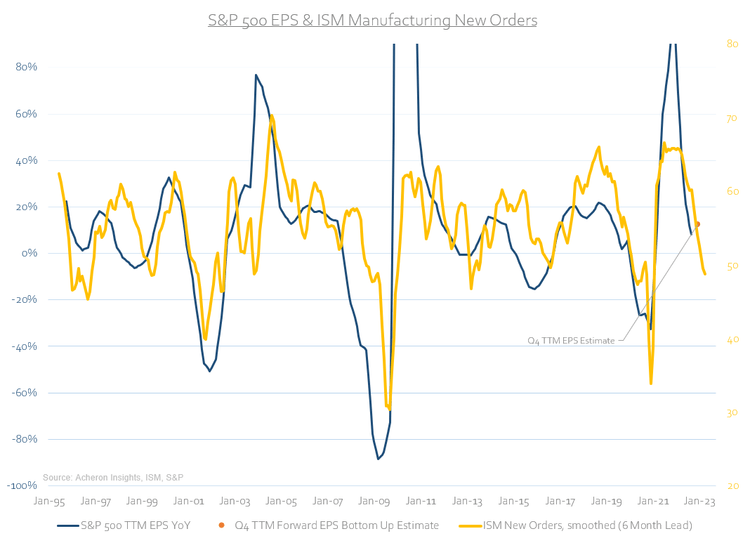
As we can see below, two leading indicators for corporate earnings in the ISM Manufacturing New Orders and ISM Manufacturing New Orders less Inventory spread are both foretelling deeply negative earnings growth is likely to come the first half of 2023. When we compare this to where consensus expectations are for Q4 earnings alone, downside surprises next earnings season look to be a high probability. This will only serve to exacerbate any downside potential for the stock market should a blow-off rally indeed eventuate prior.
Author Author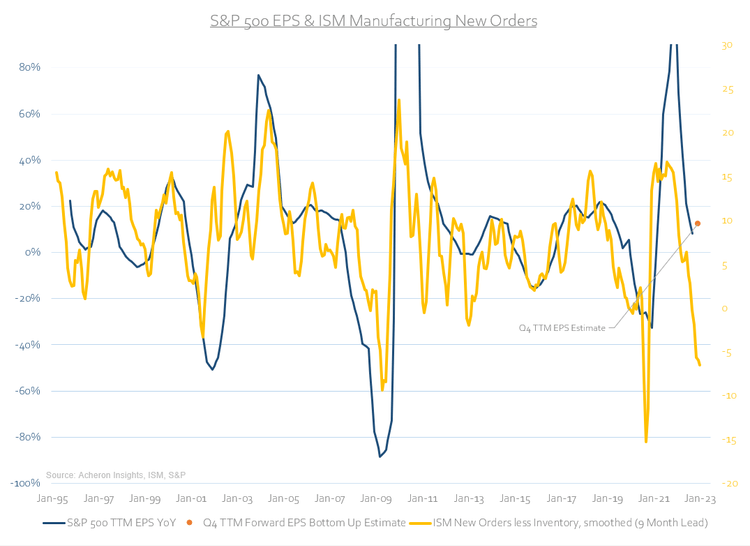
The same message for corporate earnings is coming elsewhere from the macro-land. Historically, some of the most reliable leading indicators of earnings have been a combination of the dollar, interest rates, and energy costs. When we combine the movements of all three, we tend to get a fairly accurate idea of where corporate earnings are headed over the next 12 months. The rising cost of capital, rising energy costs, and reduced foreign income via a stronger dollar are all headwinds for corporate profits. Like those above, this indicator, too, suggests earnings estimates are too optimistic for now.
Author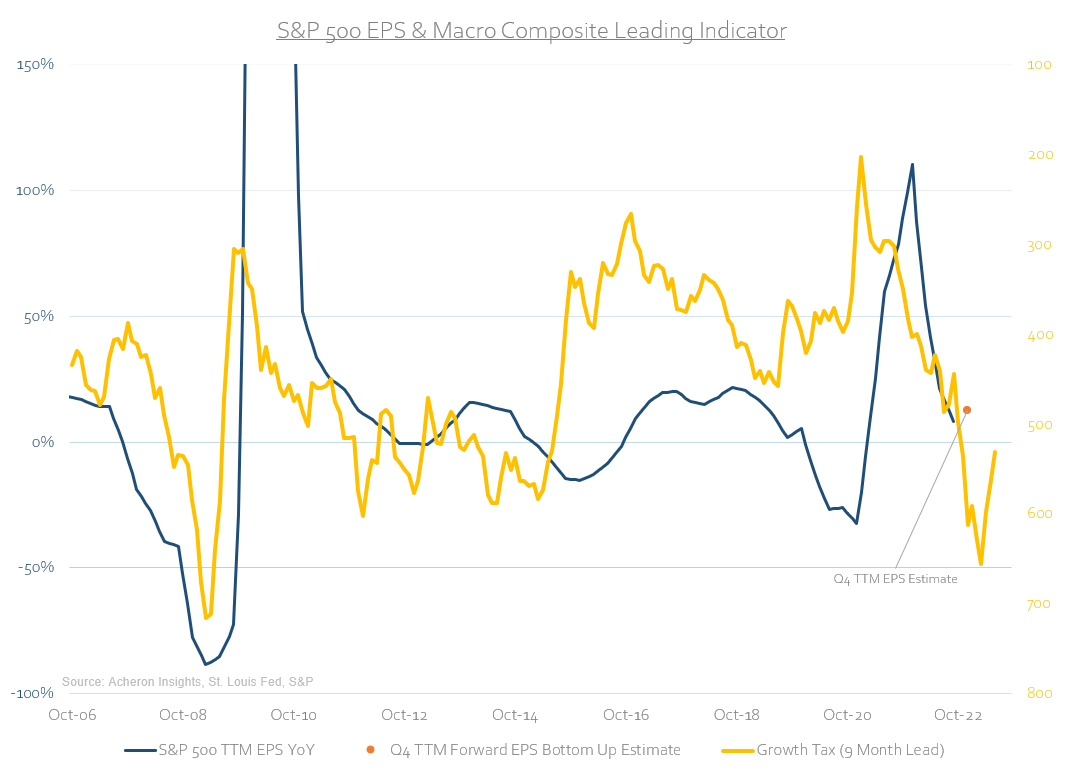
What’s more, an important dynamic we must remember is how earnings and profit margins are highly cyclical and very much correlated to the direction of labour costs (i.e. wages) in addition to the growth cycle and the macro variables described above. We can see this highlighted below via the work of John Hussman. Profit margins are yet to adjust downward to reflect the higher cost of labour. This too is set to weigh on earnings.
John Hussman – Hussman Funds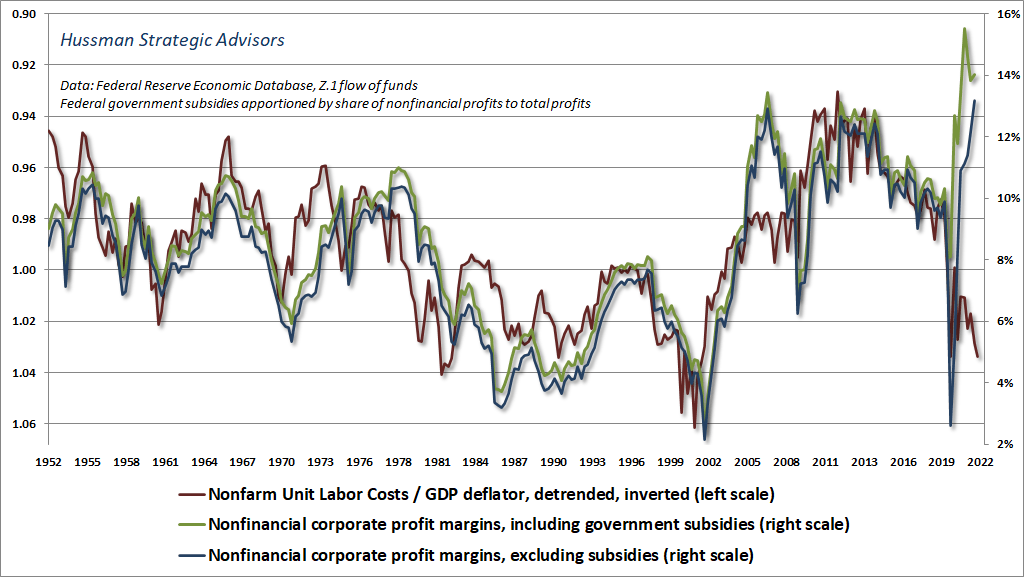
This has been the story of the past 20 years. Through the rise of globalisation and the offshoring of the United States manufacturing sector in return for cheap labour in the East, earnings and profit margins have grown to their highest levels in a century. Unfortunately, at least from a cyclical perspective, a historically tight labour market has seen wage growth rocket higher. The macro environment is changing. Earnings and profit margins have no choice but to fall to reflect this new state of events.
The below charts are an illustration of just how inflated earnings have become. Comparing real EPS to their long-term exponential trend, we can see just how unsustainable earnings are at their current levels.
Author Author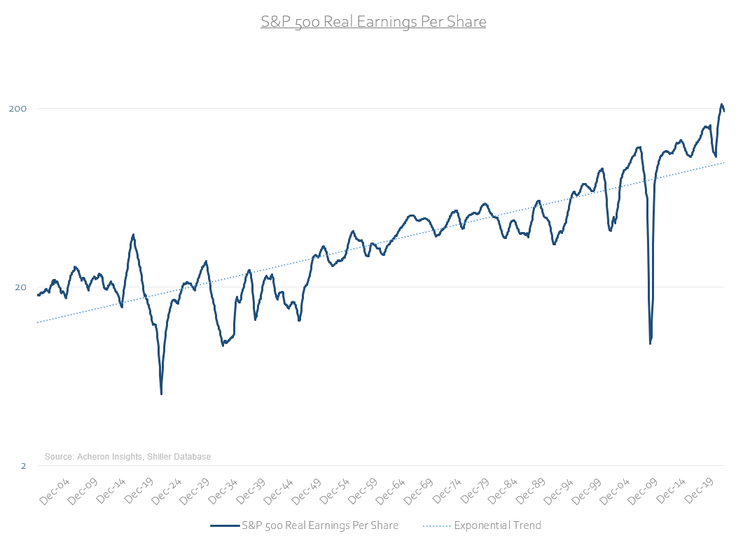
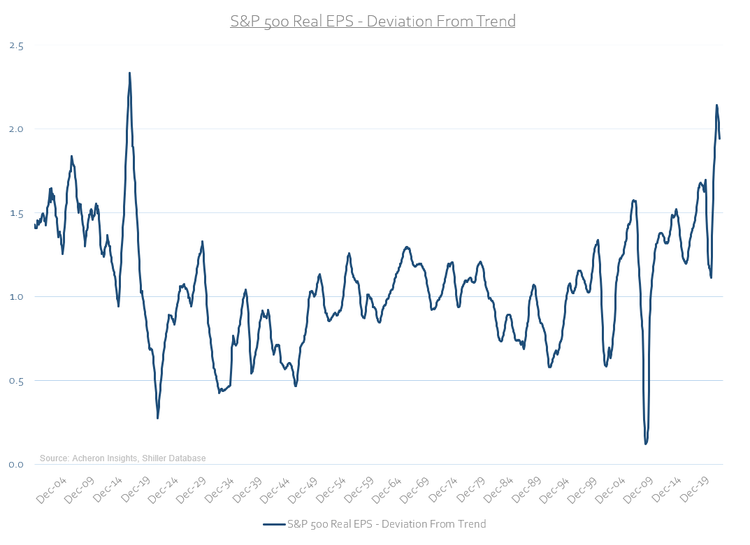
How far we see this reverse course over the next 12 months remains to be seen, but history tells us those periods of above-average earnings growth tend to precede periods of below-average earnings growth. I suspect we shall see earnings reflect lower over the next 12 months to an extent far greater than consensus expects.
Research Affiliates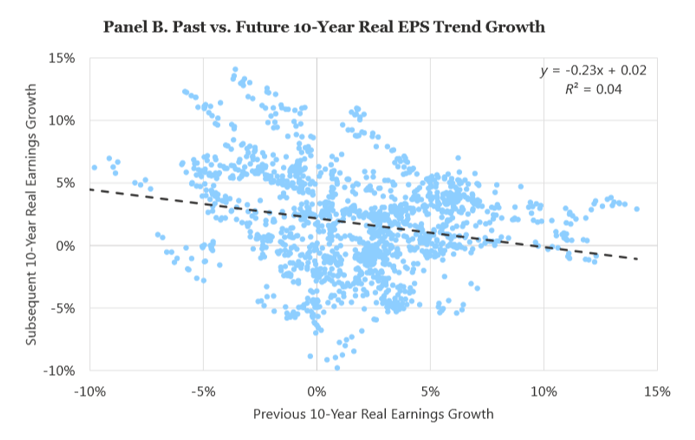
So, what are markets pricing in?
Whilst pontificating the outlook for the economy and corporate earnings is all well and good, none of this matters if the stock market has already priced in such outcomes.
The stock market is (at least somewhat) forward-looking, and as we can see below, has done a solid enough job pricing in the current decline in earnings thus far. An eye test suggests the broad market is pricing in roughly a ~20%-30% decline in earnings. Unfortunately, given the outlook for earnings per the leading indicators above, there is good chance earnings could fall anywhere from 30%-50% over the next 12 months. This is the downside risk for the markets but is likely a story for 2023.
Author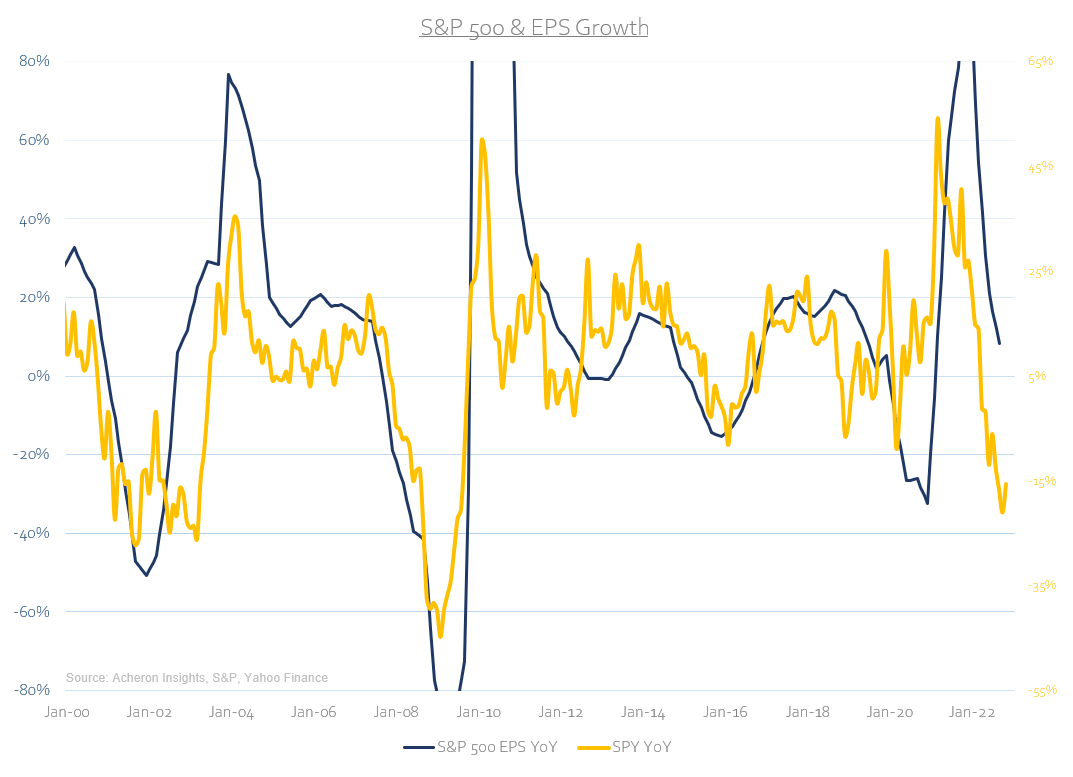
Similarly, from a business cycle perspective stocks have also done a good job pricing in the growth slowdown. However, with the forward-looking indicators for growth suggesting a sub-40 Manufacturing PMI is on the cards, it is likely too soon to be chasing rallies.
Author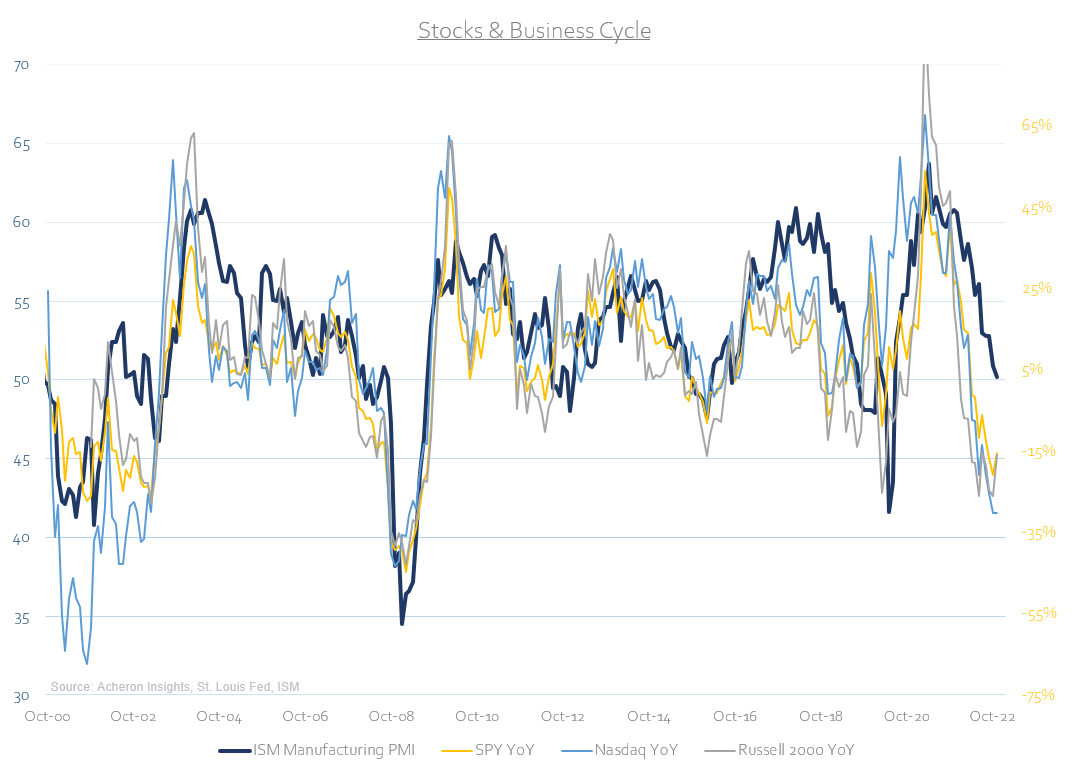
This is particularly true for high-beta areas of the market, as we can see below.
Author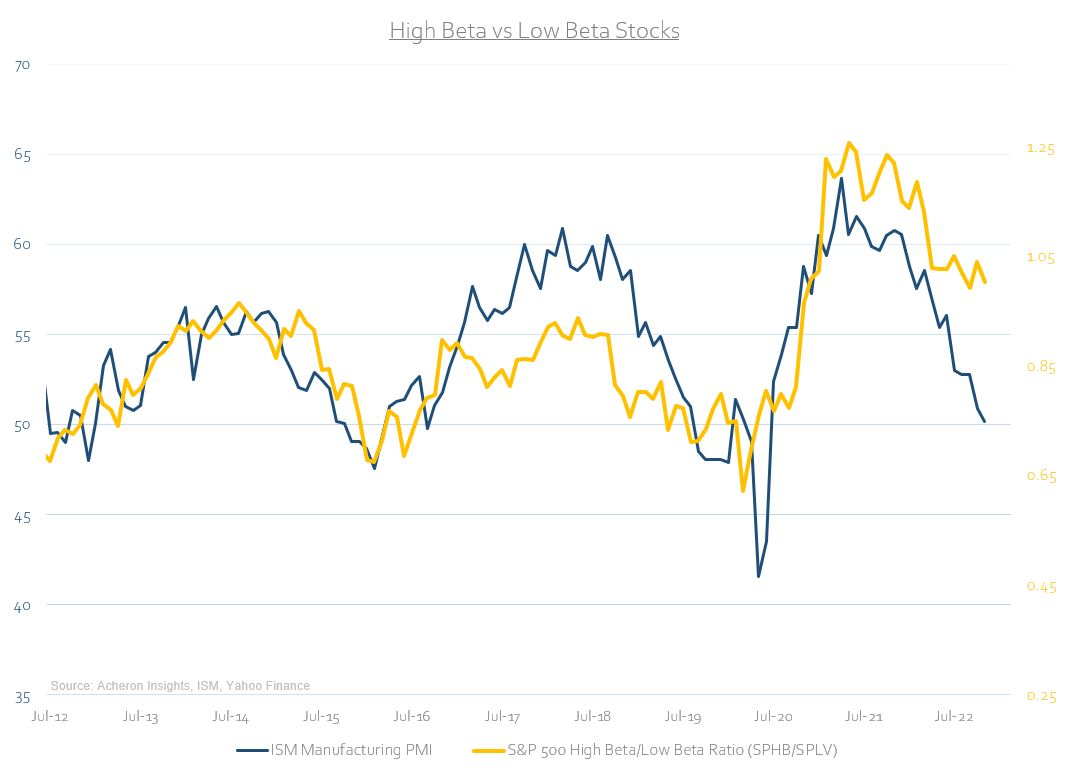
And what of the leading indicators of risk assets?
Indeed, the leading indicators of stocks and risk assets are confirming this notion. Firstly, and perhaps most importantly, the outlook for liquidity does not bode well for stocks. My preferred measure of liquidity is Excess Liquidity, which measures the growth of the real money supply in excess of economic growth, with the general idea being any excess will filter through to asset price inflation, generally leading by around 12 months.
Author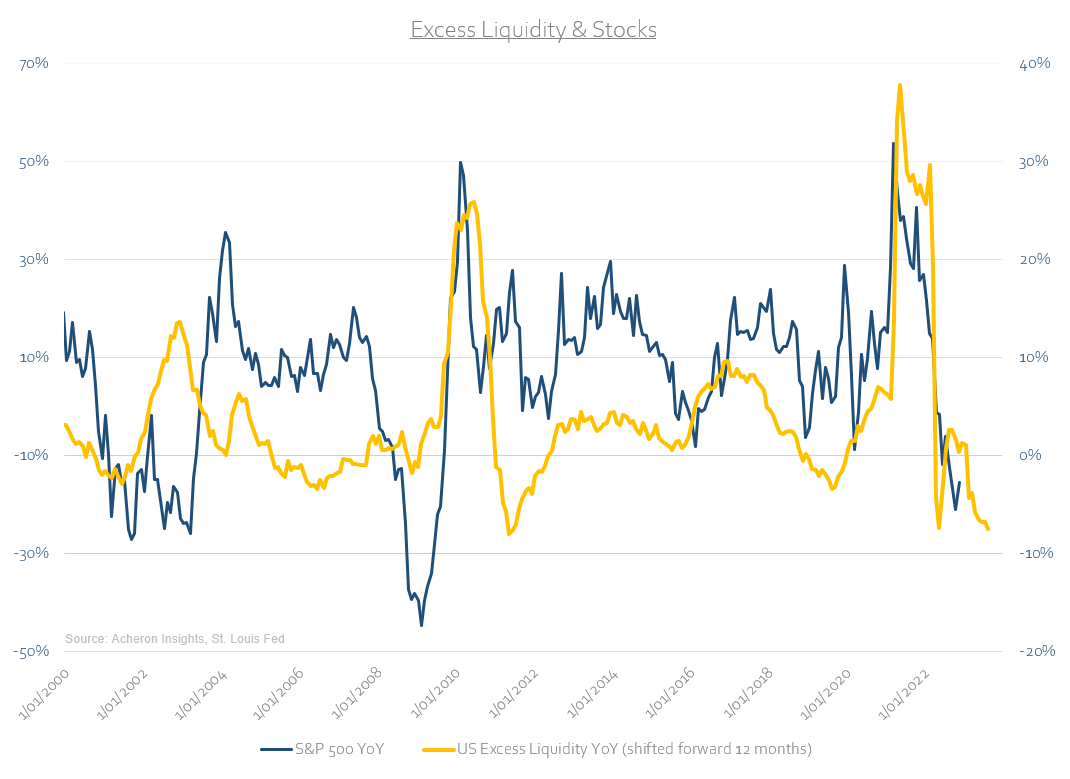
Similarly, tight monetary conditions do not favour high-beta stocks relative to their defensive counterparts. Rising yields have effectively unwound the TINA trade. Risk-seeking behaviour is not required when risk-free Treasury bills and other short-term papers are offering attractive yields, nor when financial conditions are tight. High-beta assets need to reprice lower still.
Author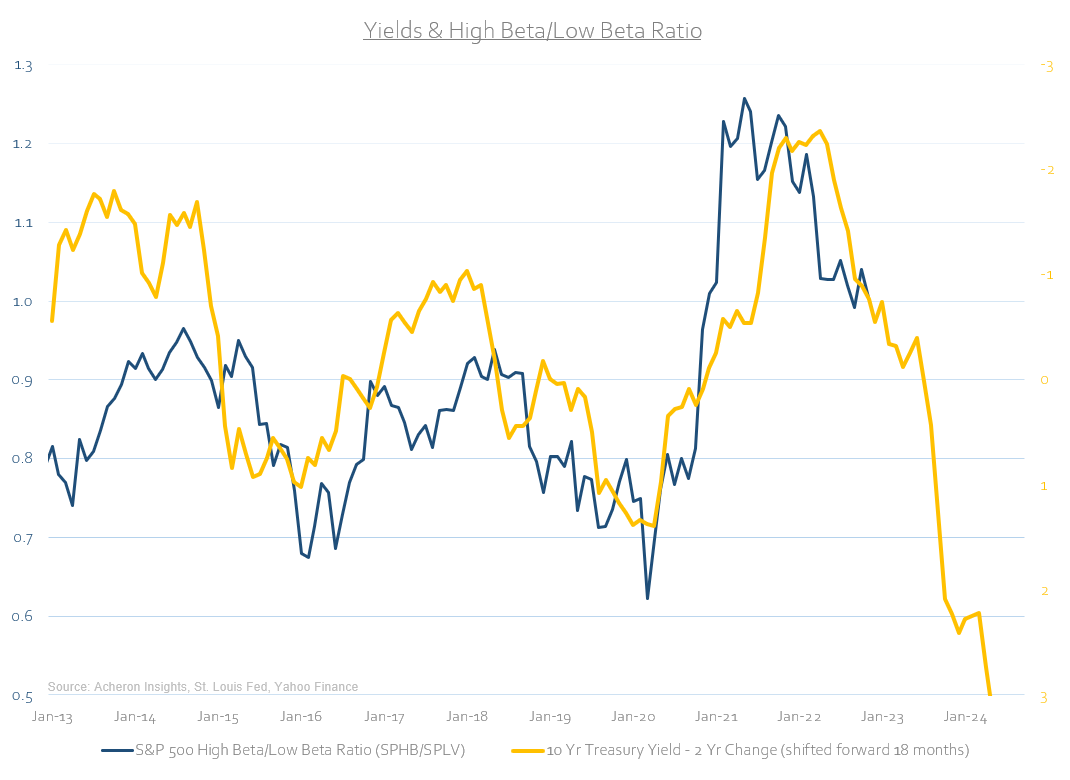
Whether or not we do see a blow-off rally to close out the year, the outlook for the market hasn’t changed. Now is not the time to be an overweight risk.
Be the first to comment