

rzelich/iStock via Getty Images
Thesis
Bitcoin (BTC-USD) has followed some predictable patterns during its past halving cycles, including after mid-halving events like the one this month. However, it’s showing signs of deviating from those patterns this cycle. The mid-halving event has historically been bearish for Bitcoin and that will likely weigh on sentiment again this time around, but Bitcoin’s short-term price action will remain difficult to predict. I continue to believe that Bitcoin has strong alpha potential for investors with a 3+ year time horizon.
Introduction
The number of new Bitcoin being created halves every four years, aptly referred to as a “halving” event. The last halving occurred on May 11, 2020, while the next is expected to occur around May 2024. That means that we are about halfway through the current cycle, a point which is known as the mid-halving event.
In this article, I will discuss why halving is important and how the mid-halving event has correlated with Bitcoin’s price action during past cycles. For those who want more background on Bitcoin and how its supply and halving works, you can refer to my previous articles where I personally contributed to the Bitcoin Core code base to research these topics:
The Importance Of Halving
Like many other assets, Bitcoin’s price is largely a function of its supply and the demand for it. When the block reward halves, it means that the amount of new Bitcoin coming into existence halves. All else being equal, the reduction in new supply should lead to an increase in Bitcoin’s price, and this correlation has been observed in the past.
Some Bitcoin bulls have mathematically modeled this correlation using what’s known as a stock to flow model. This model has historically been applied to physical commodities like gold and silver. The model simply divides the amount of a resource that’s currently owned by the amount that’s produced annually.
PlanB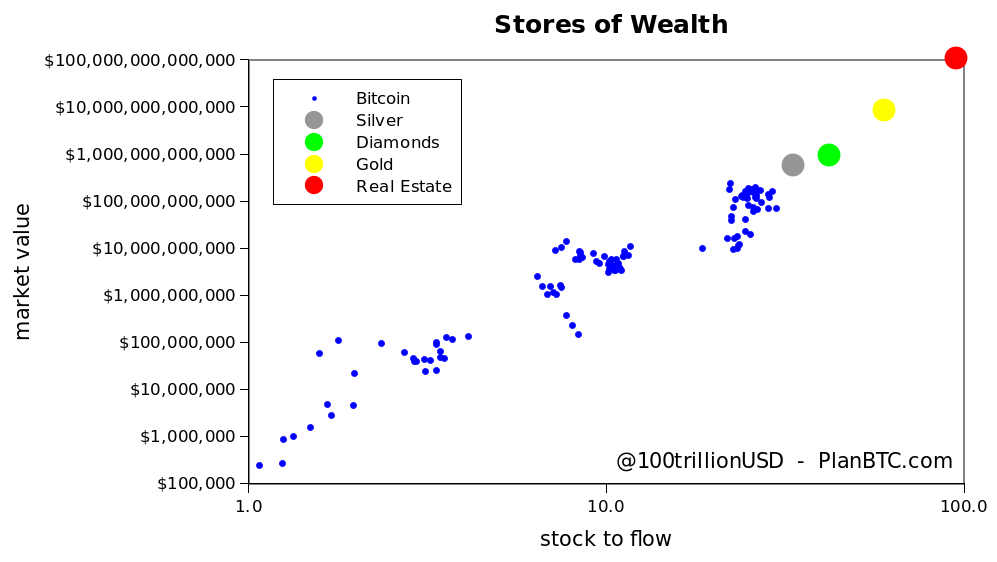
As shown in the chart above, the stock to flow ratio of various assets including Bitcoin is correlated with the asset’s market cap. Unlike other assets listed, however, Bitcoin’s stock to flow ratio changes over time; it approximately doubles every four years due to halving. In the past, this doubling of the stock to flow ratio has correlated with large increases in Bitcoin’s price.
Buy Bitcoin Worldwide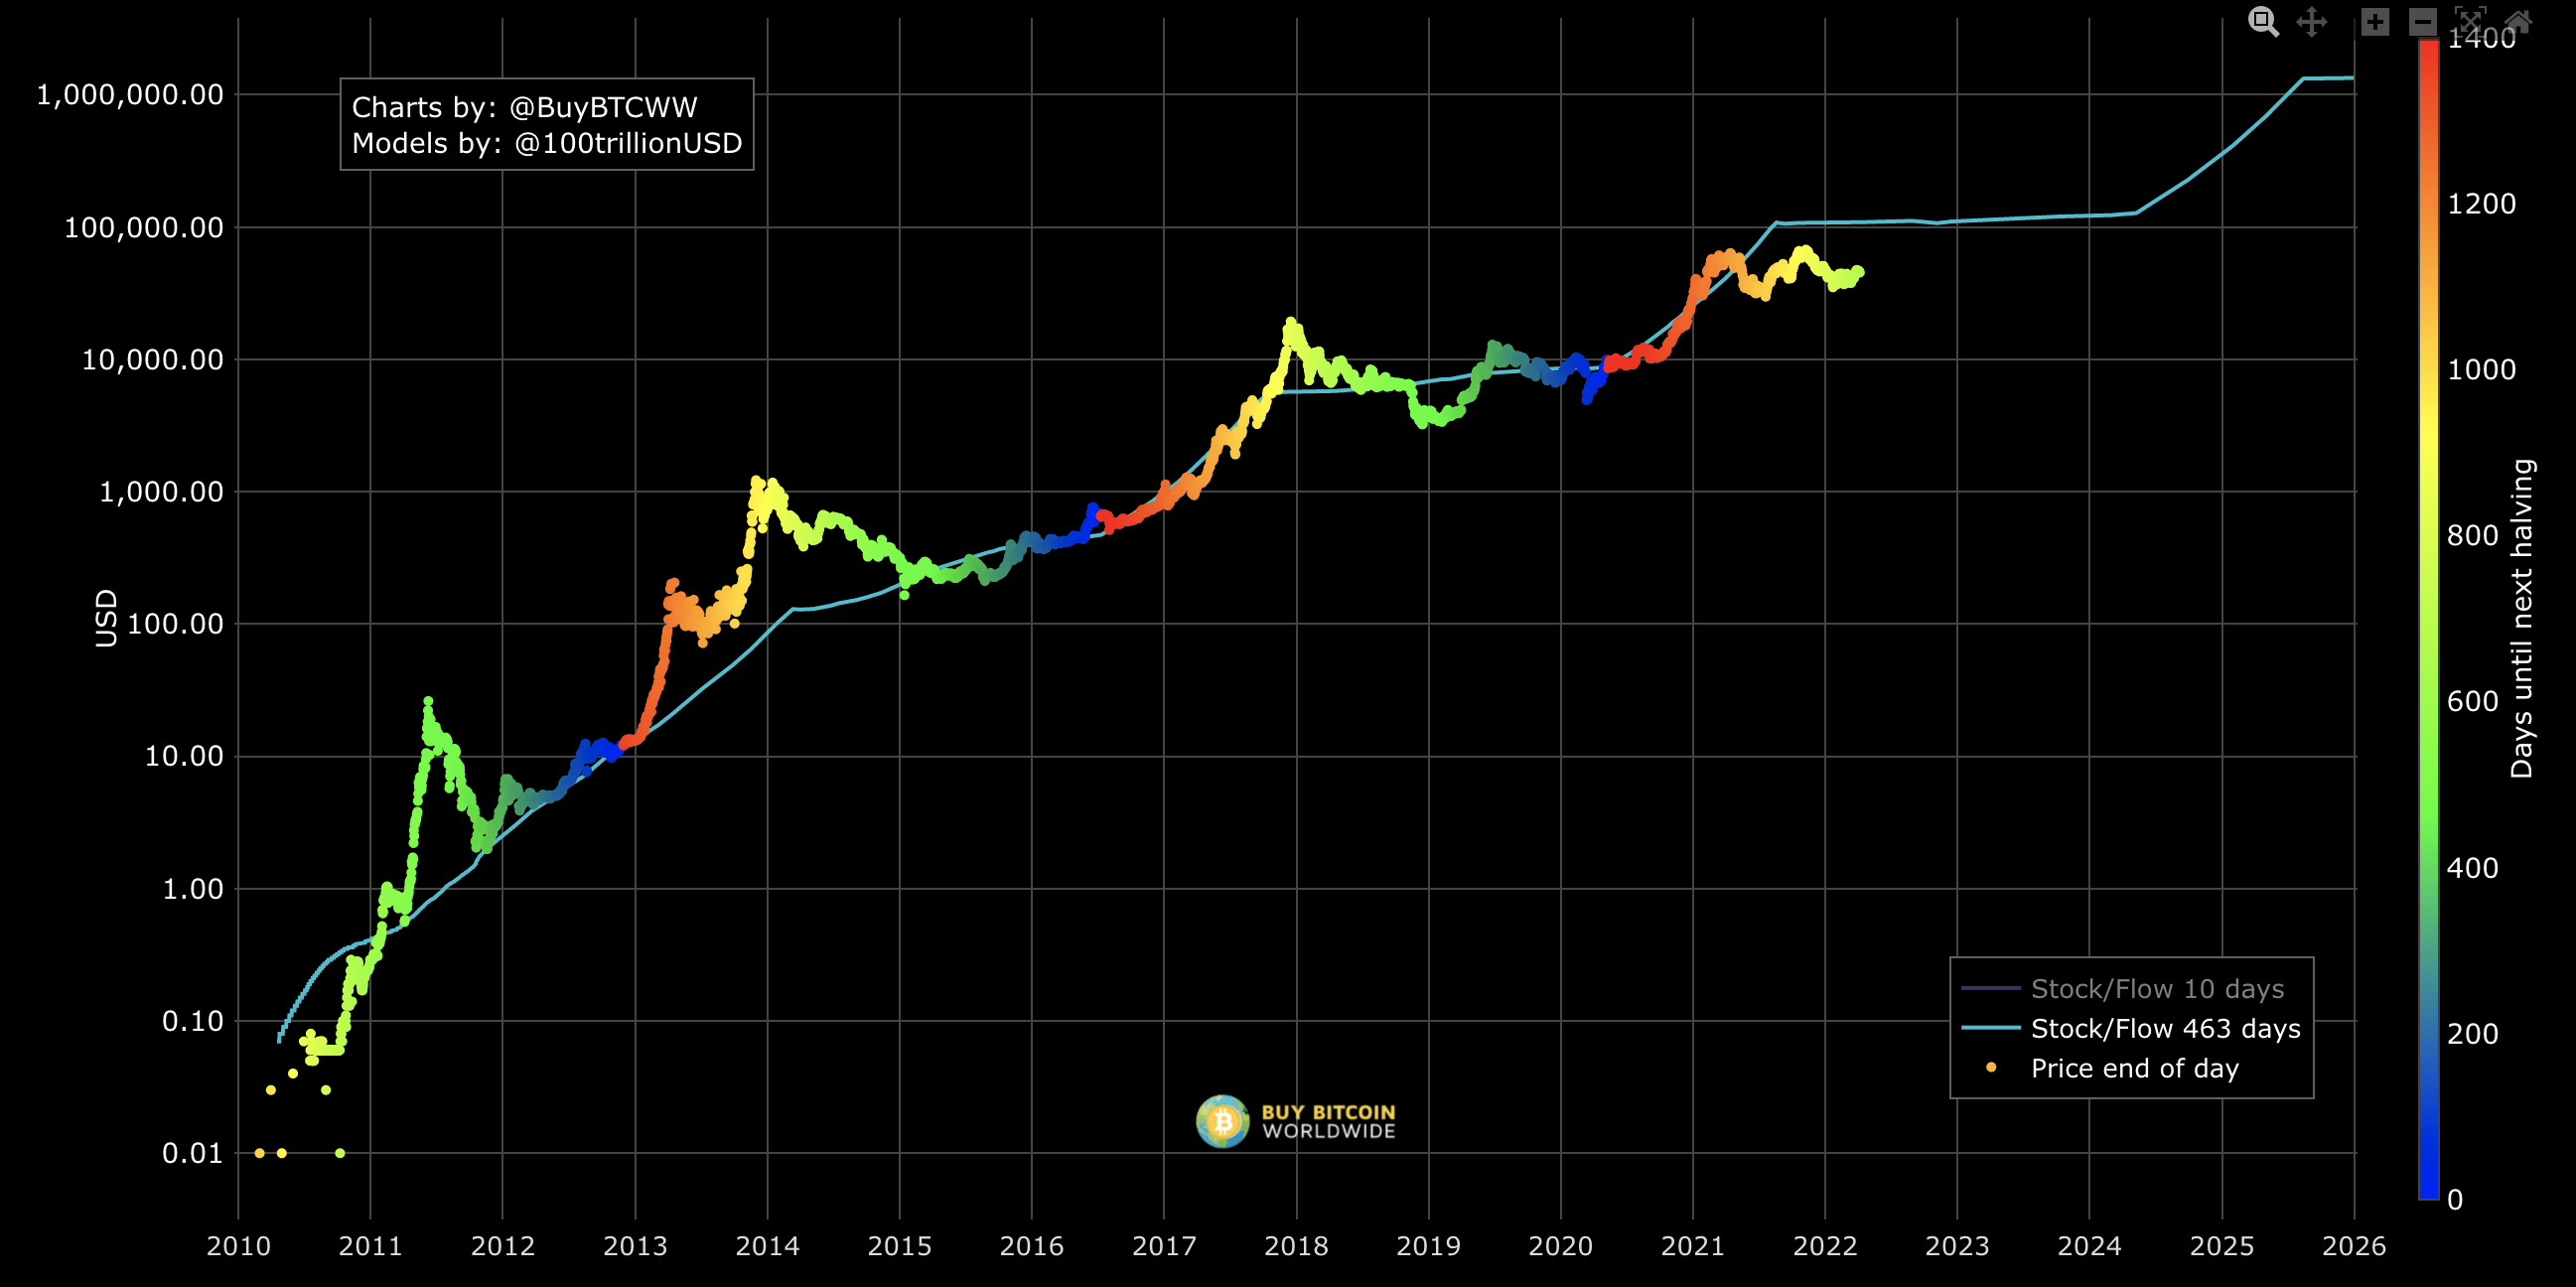
While this correlation has been tight in the past, it may be breaking down now. As shown in the chart above, Bitcoin is meaningfully trailing the $100,000+ price target that its past correlation with its stock to flow ratio would imply. The model admittedly becomes increasingly unrealistic over time, since Bitcoin’s flow will eventually reach zero, which will send its stock to flow ratio (and its modeled price) to infinity. While the hundreds of Bitcoin being created every day right now are certainly noteworthy, it will seem less important when, for example, 4 Bitcoin are created per year instead of 8. Nevertheless, the model is useful for quantitatively demonstrating the intuitive correlation between supply and price.
Lessons From History
Compiled By Author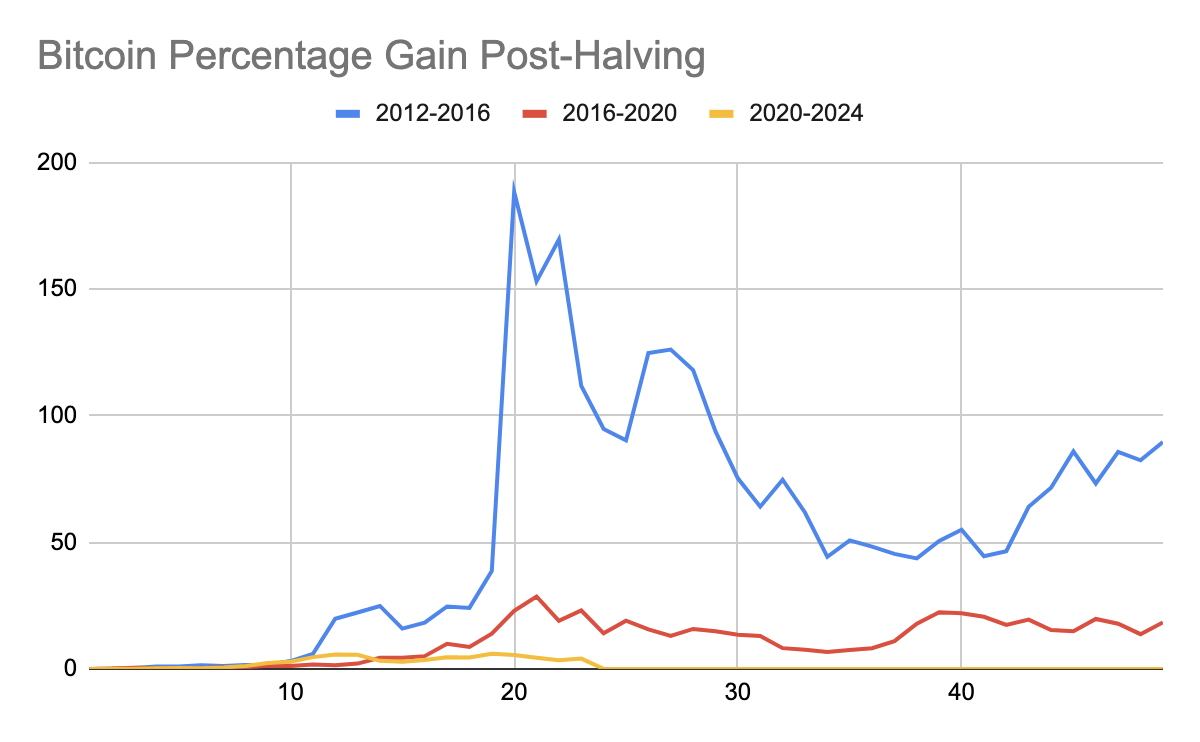
My graphic above shows Bitcoin’s chart in each of the past two halving cycles, as well as in the first half of the current cycle. The x-axis is the number of months since halving, and the y-axis is the percentage gain relative to the price at halving.
In each of the previous two cycles, Bitcoin’s price action in the third year of the cycle was bearish. During this time, Bitcoin fell 46% in the 2012-2016 cycle and 40% in the 2016-2020 cycle. Since we are at the mid-halving event, the third year in this cycle would refer to the next 12 months starting now.
Before worrying about another 40% drawdown, note that Bitcoin’s volatility has reduced with each passing cycle as its market cap increased and more institutional investors bought in. This cycle saw a smaller rally than past cycles, so it could see a smaller drawdown too. Here is another version of the chart, but with the y-axis adjusted to demonstrate the smaller movements of more recent cycles:
Compiled By Author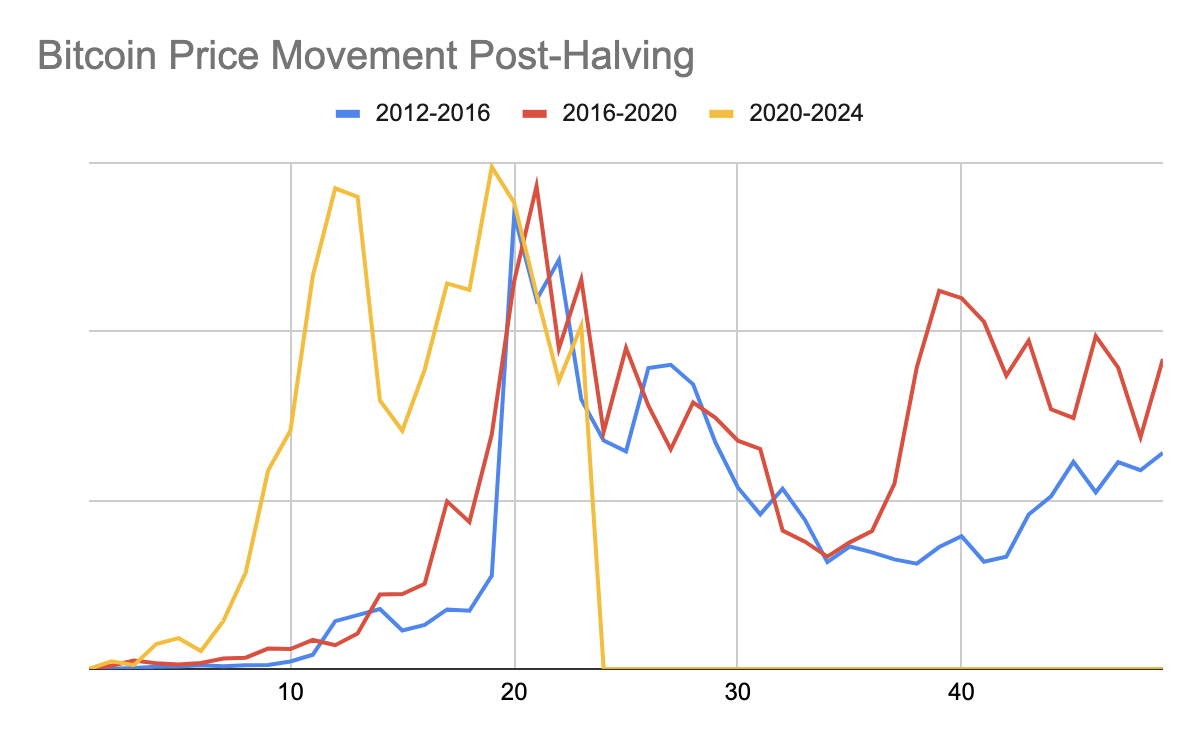
In this case, we see that the cycles from 2012-2016 and 2016-2020 followed a very similar chart pattern. However, the current cycle is anomalous because it shows a much earlier rally relative to the peak, which also occurred a couple months earlier than before. Nevertheless, Bitcoin has begun selling off recently, just as it did in previous cycles.
There are many theories as to why this cycle’s price action is different. One is that the halving events are becoming less relevant to the price action over time as the stock to flow ratio increases. Rather than trade as a store of value based on halving events, some have pointed out that Bitcoin is increasingly correlating with other factors. For example, it’s recently had price movement similar to that of risk-on stocks like those in ARK Invest ETFs. Of course, there are many other theories as well.
What It All Means
There is an infamous story of a researcher from last century who discovered that for a few years in a row, the top performing stocks in one year would go on to beat the market again in the following year. This pattern was so consistent that following it in future years seemed like free money. However, as soon as he published his research, the pattern failed to repeat again in any of the following years.
Although there are many possible causes of this change, one reasonable theory is that once people became aware of the strategy to buy the best performing stocks at the end of the year, they bid them up to unreasonable valuations before the year ended. With expectations already sky high, the stocks’ potential was already priced in and they were unable to outperform the market the next year.
We may now be seeing a similar phenomenon with Bitcoin. With two full halving cycles in the books, there is enough history for people to see clear patterns in Bitcoin’s price action based on its halving cycle. So rather than follow these patterns verbatim again, it is likely that peoples’ mere knowledge of them will prevent them from repeating. Especially if the importance of the halving cycle to Bitcoin’s price action is already decreasing.
For example, Bitcoin outperformed in the first year of this cycle relative to past cycles. Perhaps because people knew that Bitcoin usually rallied in the second year of the cycle, they bought in the first year to prepare for the rally. Unfortunately, those who bought at the point the rally started in past cycles would have bought near this cycle’s peak prices. This is a good warning for long term Bitcoin bulls to avoid timing the market based on past cycles; those who sell now in anticipation of a bearish third year could very well end up missing a rally.
Conclusion
History tells us many things about Bitcoin, and depending on which parts of history you look at, it’s easy to construct a bullish or bearish narrative about Bitcoin’s future and how the mid-halving event will impact it. On one hand, Bitcoin’s historic correlation to its stock to flow ratio indicates that it has the potential to double from its current price in this halving cycle. On the other hand, the year following the mid-halving event has been quite bearish for Bitcoin in past cycles.
The truth is that short-term price action is unpredictable. As for me, I prefer to focus more on the long term and I continue to keep about 5% of my portfolio in cryptocurrency related investments. Regardless of what Bitcoin does in the next year, the upside potential when looking 10 or even 3 years out is still very high. As I’ve discussed in my previous articles, the continued devaluation of fiat currency, the increasing interest in Bitcoin from larger investors/corporations/governments, and the increasing number of applications for blockchain technology are fundamental reasons to believe that Bitcoin has a bright future. These developments are much more predictable than any short-term price movements.
That said, because of the poor historical performance of Bitcoin after its mid-halving event, I prefer to DCA into Ethereum (ETH-USD) and select crypto stocks like Silvergate (NYSE:SI) instead of Bitcoin right now. Sentiment matters a lot for cryptocurrencies, and I worry that Bitcoin’s poor performance following its previous mid-halving events will weigh on sentiment in the short term. I see more short-term catalysts for these alternative crypto investments right now. I will probably start adding to Bitcoin again in the coming months, even though I can’t say for certain whether its price at that point will be higher or lower than the current price.
Be the first to comment