

Dzmitry Dzemidovich
Inflation climbed in September by 0.4% from August which was a big surprise for the market looking for a 0.2% increase. The headline annual rate at 8.2% was also above the 8.1% estimate. By all accounts, this was a terrible report with the implication that consumer price pressures remain structural and the Fed’s job of hiking rates is far from over.
Naturally, the initial market reaction was a deep selloff in stocks with bond yields spiking as the S&P 500 (SPY) opened nearly 2% lower. That said, stocks staged a heroic rally, impressively turning green by the late morning. We see several reasons to explain this dynamic that set up more bullish momentum going forward.
Finviz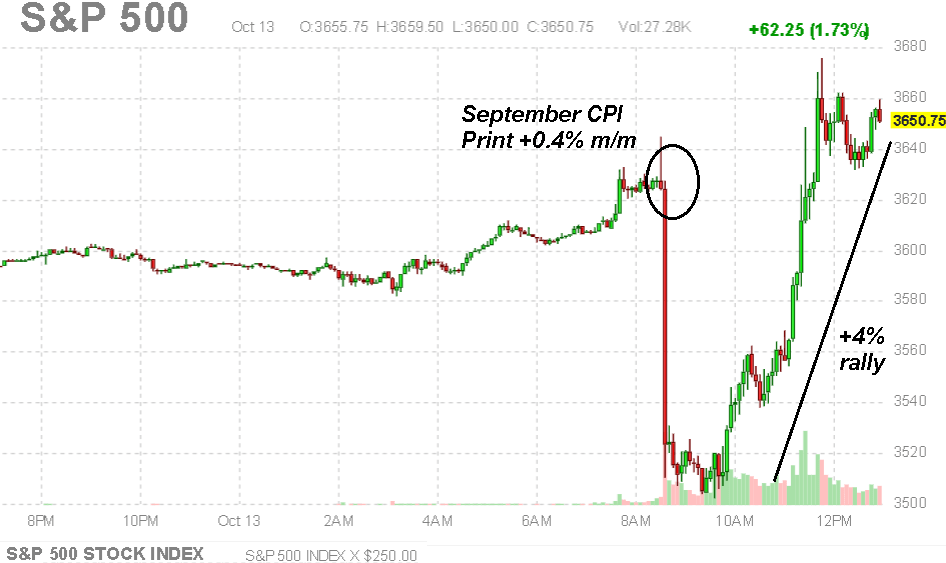
September CPI Doesn’t Change Anything
While headlines of the European Central Bank introducing a new policy model projecting a potentially lower neutral rate than market estimates, helped the market gain momentum, the bigger story here was a sense that the CPI report was a sell-the-rumor (last week) and buy-the-news type of event. What we saw with the S&P 500 rallying by more than 4% from the low was a short squeeze pain trade against bears that were pushing their luck hoping for another massive drop in stocks.
The first point is that even while the CPI came in hotter than expected, there is a case to be made that it doesn’t necessarily change what was already the baseline in terms of Fed policy over the next several months.
The narrative of higher rates for longer with an aggressively hawkish monetary policy had already been the consensus going back to the last month’s August CPI report, further reinforced at the September FOMC and even last week’s labor market update. The calls for another 75 basis point rate hike at the next Fed meeting have simply been reaffirmed. Notably, the action in rates was relatively muted on the day with the 2-year and 10-year U.S. Treasury yield (IEF) trading flat.
We know the economy is facing headwinds with an outlook for weakening growth with an impact of higher rates, but at this stage, the difference of a few basis points in the CPI is not going to make a difference. By this measure, stocks found some footing with a sense that the disappointing indicator was likely already priced in given the recent weakness in stocks. The initial drop was an overreaction to an indicator where a surprise higher has lost importance.
Hot Inflation Now Means A Sharper Drop Later
The other factor to consider becomes apparent digging through the underlying inflation data published by the Bureau of Labor Statistics. In our view, there are a few components of the CPI that appear stubbornly high, but likely have room to trend lower going forward.
BLS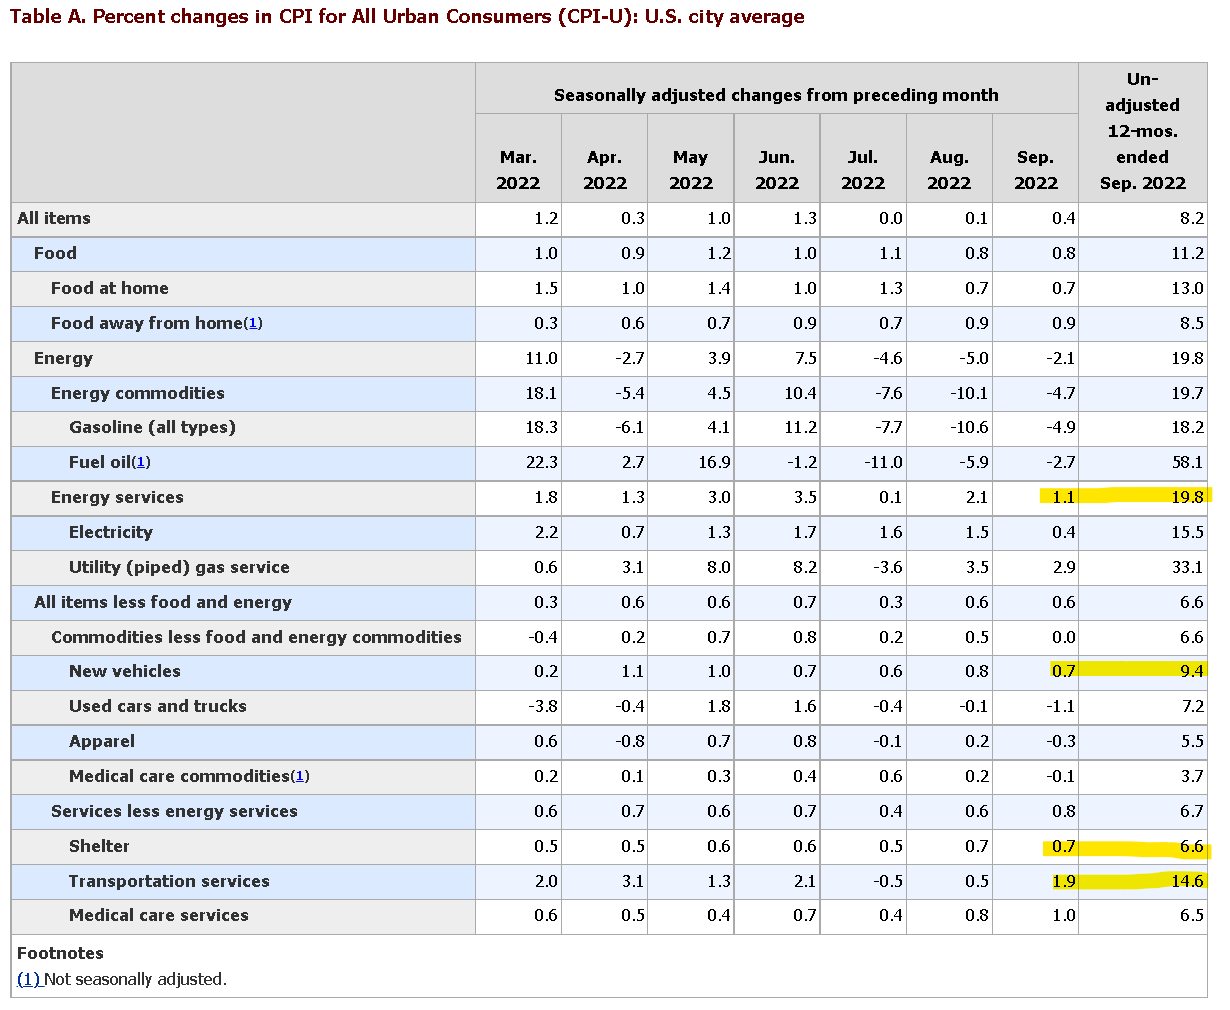
The setup here goes back to the impact of higher interest rates all year and the lagged transmission effect. Shelter, for example, which captures housing and rent prices climbed by 0.7% m/m in September which goes against other data suggesting a broader slowdown in the housing market. It only becomes a question of when falling home prices will begin to be reflected in the CPI.
We can make a similar connection to the category of New Vehicles which increased by 0.7% m/m even as used care prices took a leg lower by 1.1%. Indications are that easing supply chain disruptions in the automobile industry including from the chips shortage are set to improve, while weaker demand amid a global slowdown will eventually help cool off new car prices.
There were also some head-scratchers in the September data. Even as oil (USO) and natural gas prices are down sharply from their highs in June, apparently gas utilities and electricity within Energy Services remain hot. By the same line of thinking, it’s odd that prices for Transportation Services, which includes airline tickets, accelerated in September even as gasoline and fuel oil corrected lower. It’s possible the October data better captures these price trends through a lag.
The point here is to say that while the data for September was bad overall, the door is open for consumer prices to make a sharper correction into 2023. This would be driven by the combination of higher interest rates, softer demand pressures, easing supply side conditions, along with what becomes more difficult comps. In other words, stocks rallied on the report by already incorporating longer-term expectations.
Stocks Play By Their Own Rules
It’s important to recognize that “the stock market” and the real economy are often two distinct realities. By all accounts and the Fed’s projections, unemployment is set to climb higher with economic conditions slowing going forward. At the same time, stocks have been trading lower on this messaging which has become the consensus over the last several months.
The environment of extreme pessimism becomes conducive to a reversal higher rally as sellers become exhausted. That’s likely what we saw with the CPI report essentially not bringing anything new to the table.
Finviz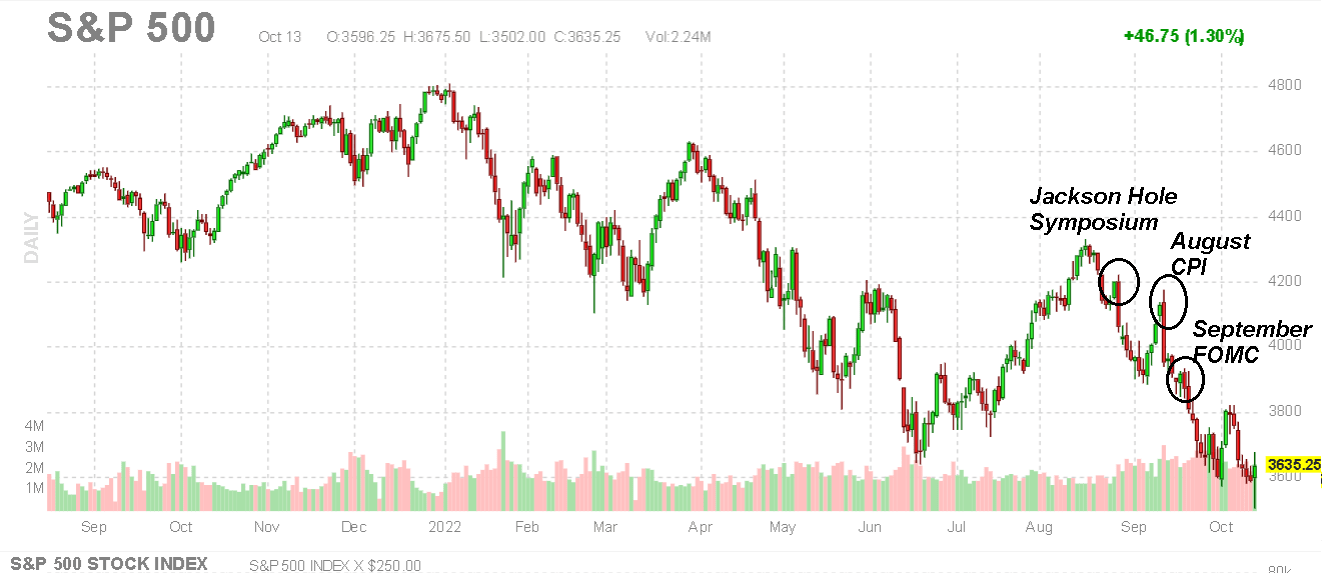
What the stock market bulls have in their corner is a deeply discounted market where earnings growth remains positive and valuations are attractive. According to FactSet Research Systems (FDS), the consensus is for 2023 EPS in the S&P 500 to climb by 8% to $241.02, maintaining some momentum from the 7% increase in 2022. These figures consider aggregate published Wall Street estimates for the underlying S&P 500 companies.
Even as macro conditions are difficult, it’s clear that many market leaders and large-cap blue chips in particular can maintain profitability. That’s the case with PepsiCo, Inc. (PEP), which just reported its latest quarterly results beating estimates while raising guidance. With Q3 earnings season set to hit full swing next week, low expectations set up a powerful bullish catalyst for the market to rally higher.
FactSet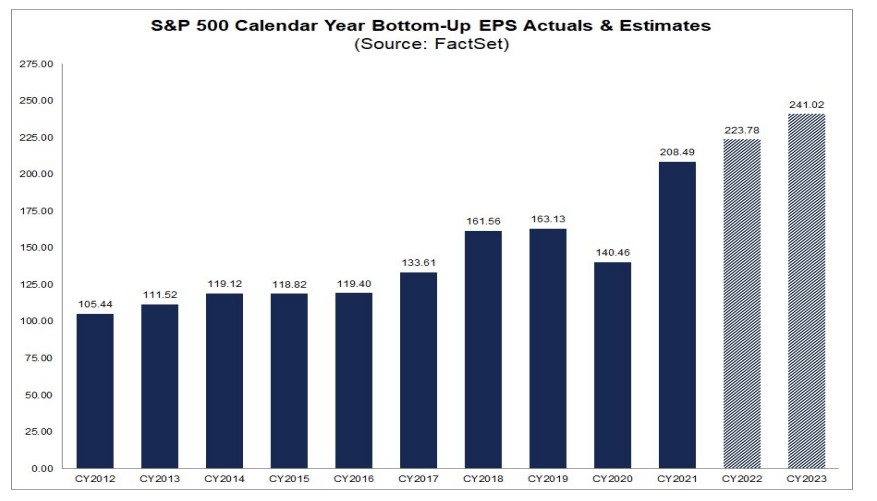
The other side to the discussion is valuations which have been pushed to near multi-year lows given the market selloff. Based on the forward 12-month earnings outlook for the S&P 500, the market is trading at a P/E near 15x compared to a 5-year average closer to 19x.
The big assumption we need to make is that those earnings forecasts materialize which would make the market simply cheap at the current level. In practicality, even if we take a more conservative approach and assume 2023 earnings just stay flat relative to 2022, the market would still be undervalued.
The point here is to say that it becomes harder and harder for the bears to keep holding stocks down even as earnings have been otherwise resilient. The risk, of course, is that operating and financial conditions for companies deteriorate materially further, but it hasn’t played out yet despite the rising interest rates.
FactSet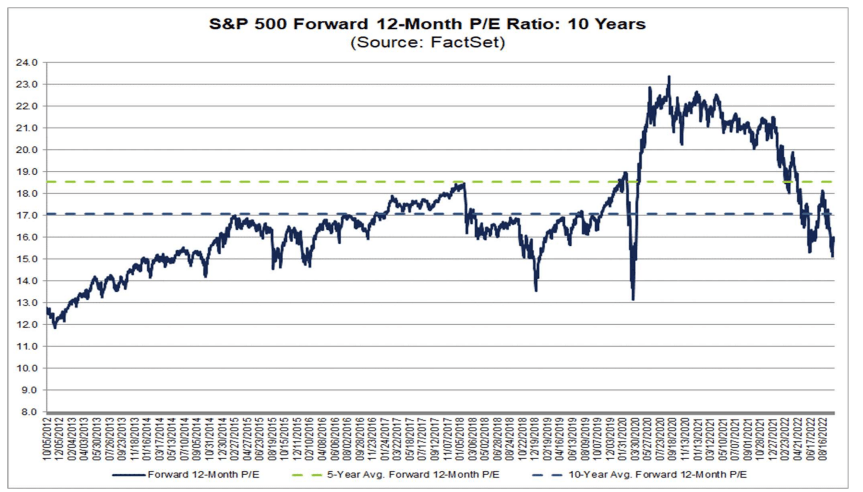
What’s The Trade?
Recognizing what remains significant macro uncertainties, we believe it’s a great time to buy the dip in stocks and add exposure to risk assets. What’s been encouraging to us over the last few months is the apparent resiliency of the economy despite the high inflation and rising interest rates. The Fed can keep hiking, but that doesn’t mean a “hard landing” or apocalyptic recession is a certainty.
The rally today provides the opportunity to kick the inflation can into next month where it’s still possible the CPI surprises lower, balancing out the hotter-than-expected trends in August and September. The Fed can hike again at the next FOMC on November 3rd, but it will hardly come as a surprise. More favorable inflation data through 2023, will help market sentiment improve supporting more upside in stocks.
The bullish case for stocks is that macro conditions evolve better than expected going forward. Tech is one place to start. For both long-term investors and short-term traders alike, beaten-down mega-cap names provide a layer of fundamental quality through strong balance sheets with a positive long-term outlook.
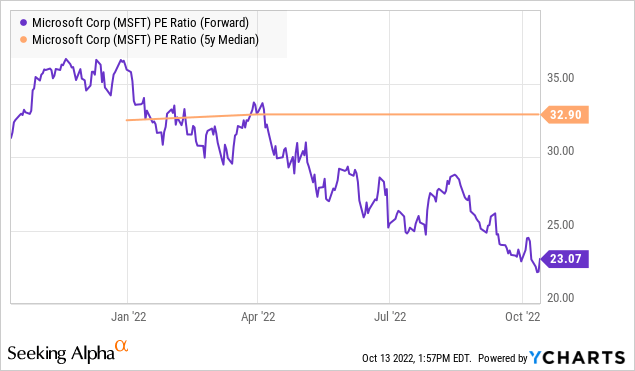
Microsoft Corp. (MSFT) is one of our favorite stocks, trading at a historically low P/E of 22x compared to a 5-year average for the metric closer to 33x. This is in the context of an outlook for annual earnings growth to average 15% over the next three years. The stock highlights a broader trend among mega-cap leaders that are discounted compared to historical growth premiums. Microsoft, arguably one of the strongest companies in the world, has several levers to pull that can keep it resilient even in a weaker macro environment.
Going back to the S&P 500, today’s low at 3,502 now becomes a critical level of support the bulls will need to hold. To the upside, 3,800 is the next resistance point and can work as a first upside target. A break above 4,200 would put the bulls firmly back in control.
In terms of risks, the wildcard in the discussion is energy prices along with the ongoing Russia-Ukraine conflict. While there is room to be bullish on oil and gas, significantly higher prices from here would undermine the outlook for inflation declining. We also want to keep an eye on the bond market and credit spreads as a measure of financial system stability.
Finviz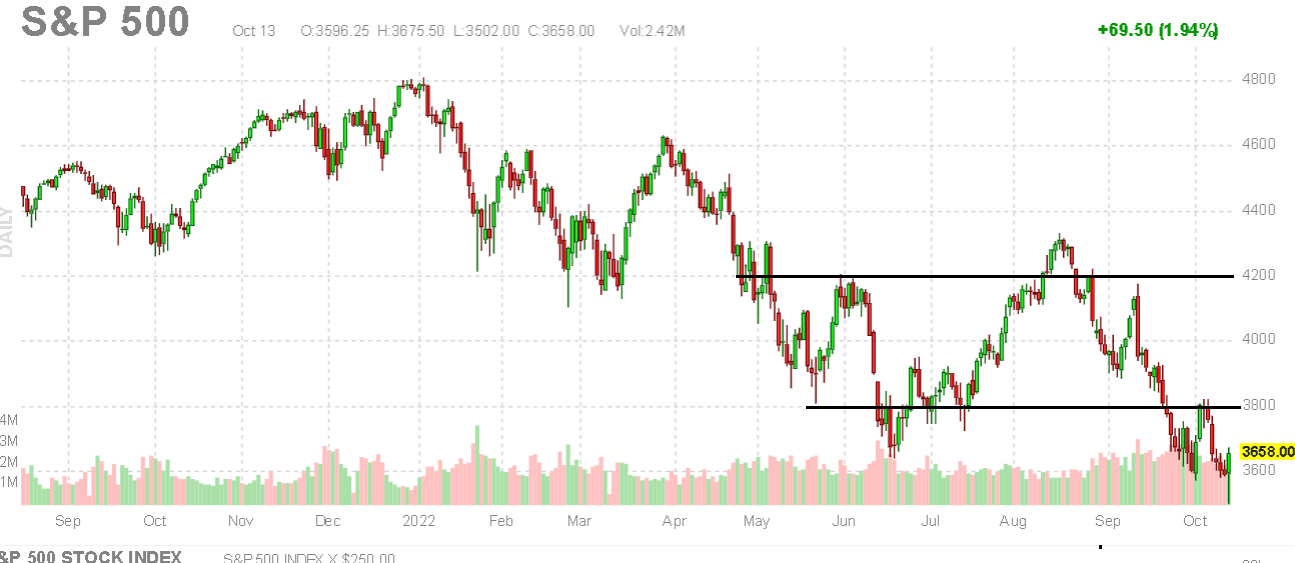
Be the first to comment