

Yuji Sakai
Dr. Michael J. Burry, famous for his role in shorting the housing market during the 2008 financial crisis, has recently made some bold claims and predictions, and seems to be backing them up by moving his positions extensively.
Recently, his hedge fund, which has approx. US$292M in assets under management (AUM), reportedly closed all but one small position in a small cap stock. In this article, we will discuss some recent economic data that seems to support Dr. Burry’s thesis on why stocks could be headed lower.
Closing Out Nearly All Positions
Compared to Scion Capital’s previous filing with the SEC, it appears that Michael Burry has closed all of his previous positions, which totaled just over US$201M. This included his positions in Alphabet (GOOG, GOOGL), Booking Holdings (BKNG), Meta Platforms (META), and even covered his US$35M of Apple (AAPL) put options.
Scion Asset Management 13F (Q1) (SEC)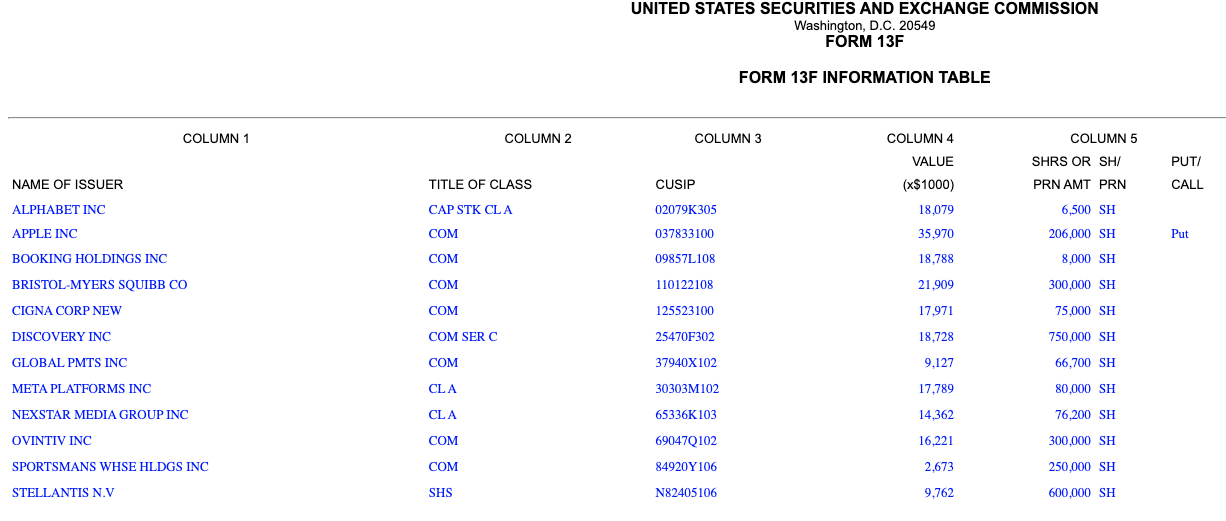
However, his latest filing, published today, surprised quite a few investors, as he holds only a small position in GEO Group (GEO), a real estate investment trust (“REIT”) primarily focused on investments in private prisons and mental health facilities. This has been reported by many media outlets as his “big bet,” even though the position is worth only US$3.31M, which is only about 1.13% of Scion’s estimated liquidity.
In other words, Michael Burry is either almost entirely in cash or could have a net short position in the current market. This is because fund managers do not have to report short positions, as per Investopedia:
Funds are only required to report long positions, in addition to their put and call options, American Depositary Receipts (ADRs), and convertible notes. This can give an incomplete and even misleading picture, because some funds generate most of their returns from their short-selling, only using long positions as hedges. There is no way to distinguish these hedges from genuine long positions on 13F forms.
Scion Asset Management 13F (Q2) (SEC)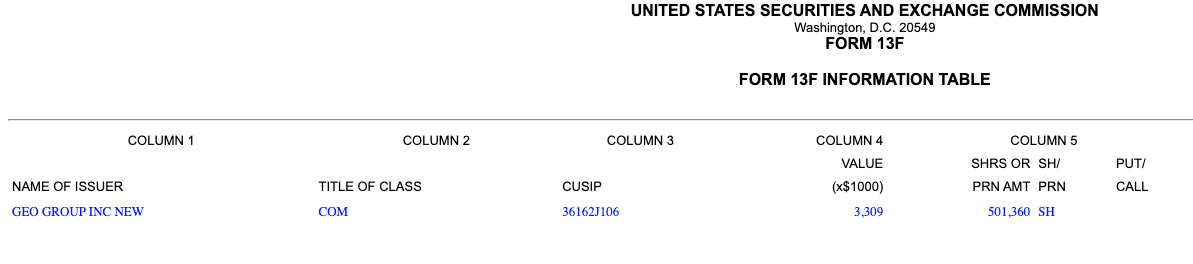
Either way, we can see that Dr. Burry is certainly supporting his bearish stance with his trades in his fund. The small position in Geo Group, on the other hand, may be due to a multitude of reasons.
From our point of view, this move was primarily based on the valuation of GEO, which is trading at only 6.48x EV/EBITDA, compared to the REIT sector at an average multiple of 26.81x. Although GEO’s growth has remained relatively flat in recent years, the company is trading at a Price to CFO ratio of only 3.4x.
Beyond the ultra-cheap valuation, it cannot be dismissed that it is still a riskier investment due to the nature of the business, and it still has a significant amount of debt on its balance sheet. For a fully detailed valuation, read this article by a fellow author.

Macroeconomic Data Doesn’t Lie
In our last piece on macroeconomics, which included Michael Burry’s observation on the build-up of inventories, he talked about a “Bullwhip effect.” An effect that may leave us with far more inventory than expected, due to bad signaling/ inefficiencies in the supply chain.
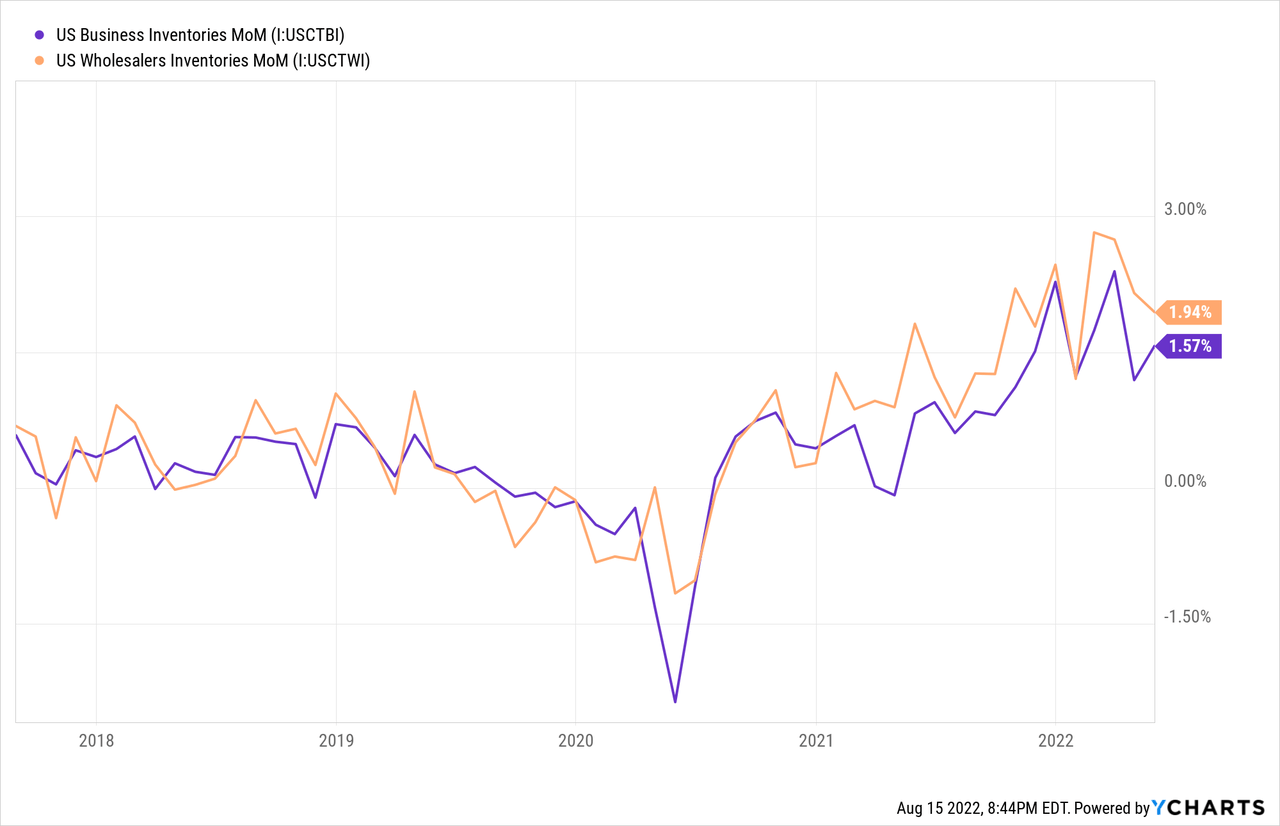
For example, after the inventory shortages the economy faced last year, producers may have increased capacity “just in case” because they saw an increase in demand and preferred to overproduce. In an economy where demand remains strong, this would not be a problem. But in fact, we are still seeing inventory build-up at the moment. The chart below shows the MoM increase in inventories, which still needs to be looked at on an annualized basis (x12).
The problem, primarily, is that we find ourselves in an economy that is destroying the purchasing power of consumers due to inflation. This is because inflation is outpacing wage inflation, so households are going into more debt. Plus, this is not the best time to go into debt, since the Fed is raising interest rates and the cost of borrowing credit is set to become much more expensive.
In our previous piece, we also explained that we thought inflation had peaked, and we may already be seeing the first signs of that. The CPI came in at 8.5% this month, compared to last month’s 9.1%. We think the combination of aggressive monetary policy (hiking rates) from the Fed in a slowing economy, combined with massive stockpiles and layoffs, could give the economy a hard time.
Bloomberg Terminal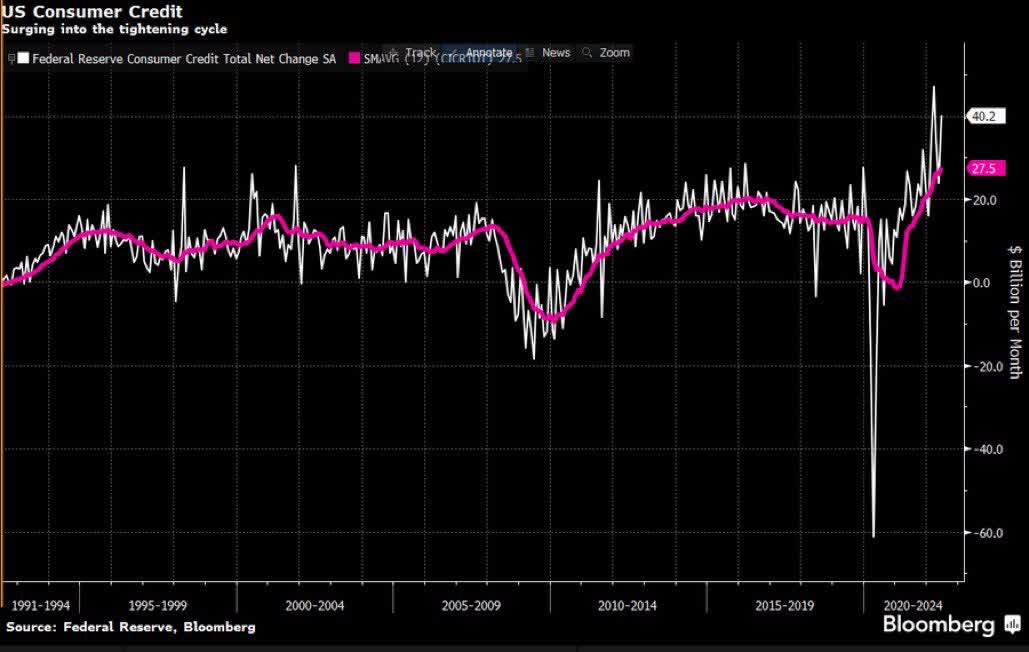
This could eventually lead to disinflation later this year, with companies having to cut margins due to low demand and a continued build-up of inventories. So far, companies have been able to pass on the inflation mainly to their consumers, but we think this is going to change in the second half of this year. In our opinion, Michael Burry also alluded to this in a recent tweet about the Q2 earnings season:
These earnings reports and by Jove the whole season have a “Last Hurrah” feel.
Yesterday, interesting data was also released by the New York Fed, but seemed to be overlooked by the general media. The NY Empire State Manufacturing Index, based on data from a survey of 200 manufacturing executives in New York State, fell -31.30% versus the expected +8%. It was one of the lowest polls ever, going back to May 2020 or the 2008 financial crisis.
New York Fed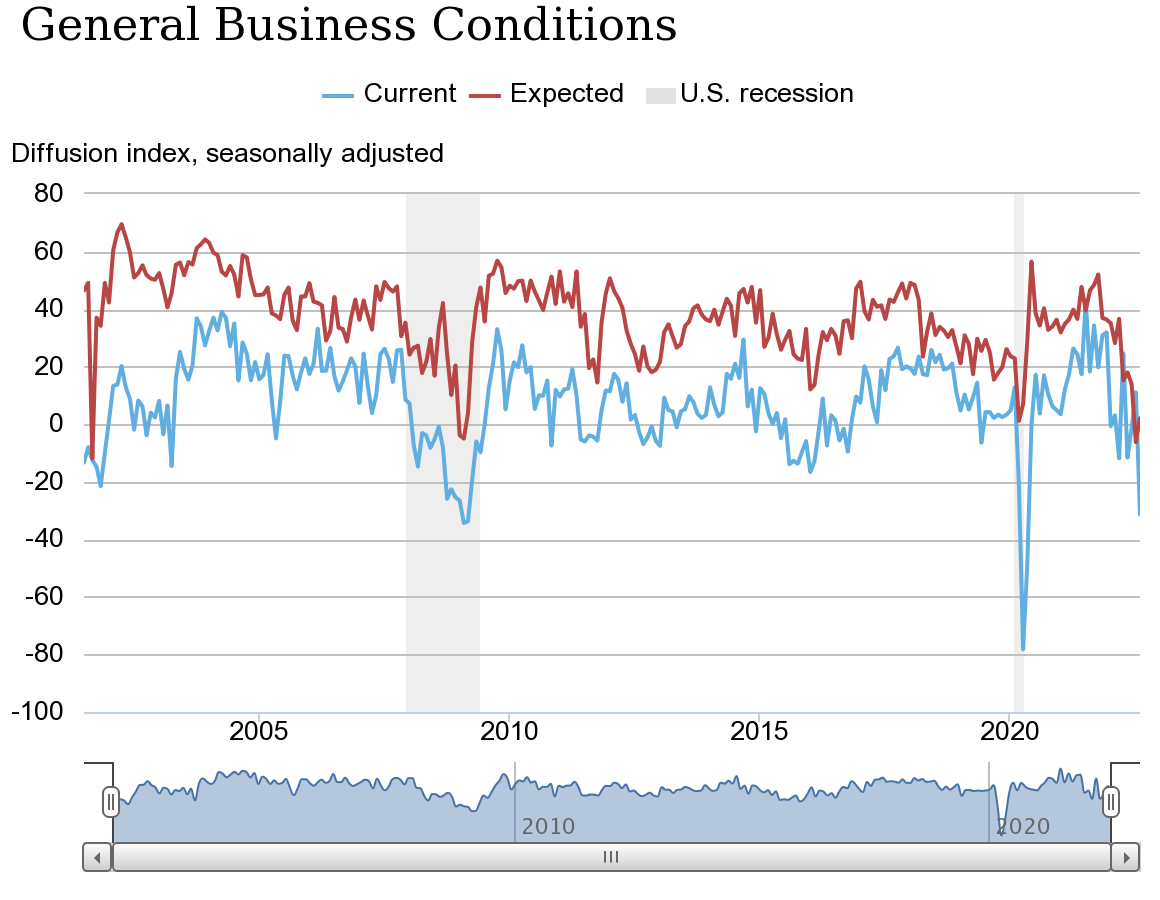
New orders plunged -29.6%, while shipments crashed -24.1%. Non-executed orders also fell -12.7%, while inventories increased by +6.4%. While inflation was still high, the index for prices paid fell. It is noteworthy that companies did not expect much improvement in business conditions over the next six months. We therefore believe that this data is perfectly in line with our previously stated thesis.
So, where is the market moving?
The market may have risen in recent weeks as inflation has hopefully peaked and Wall Street has priced in a slowdown in rate hikes as inflation cools. But what Wall Street does not seem to have priced in yet is even the slightest possibility of an earnings recession.
Even BlackRock admitted yesterday that corporate earnings forecasts have not factored in any slowdown. They stated that “they see corporate profits deteriorating amid a rotation in consumer spending and a sputtering rebound,” which is why they remain cautious on equities.
They also believe that this rally is unsustainable, as they do not see the Fed turning around until next year. The shift in spending from goods to services that they see could do even more damage to the economy, as we have already talked about the current detrimental accumulation of inventory. Most of the earnings in the S&P 500 are also tied to goods.
Previous Inflationary Peaks (Bloomberg Terminal)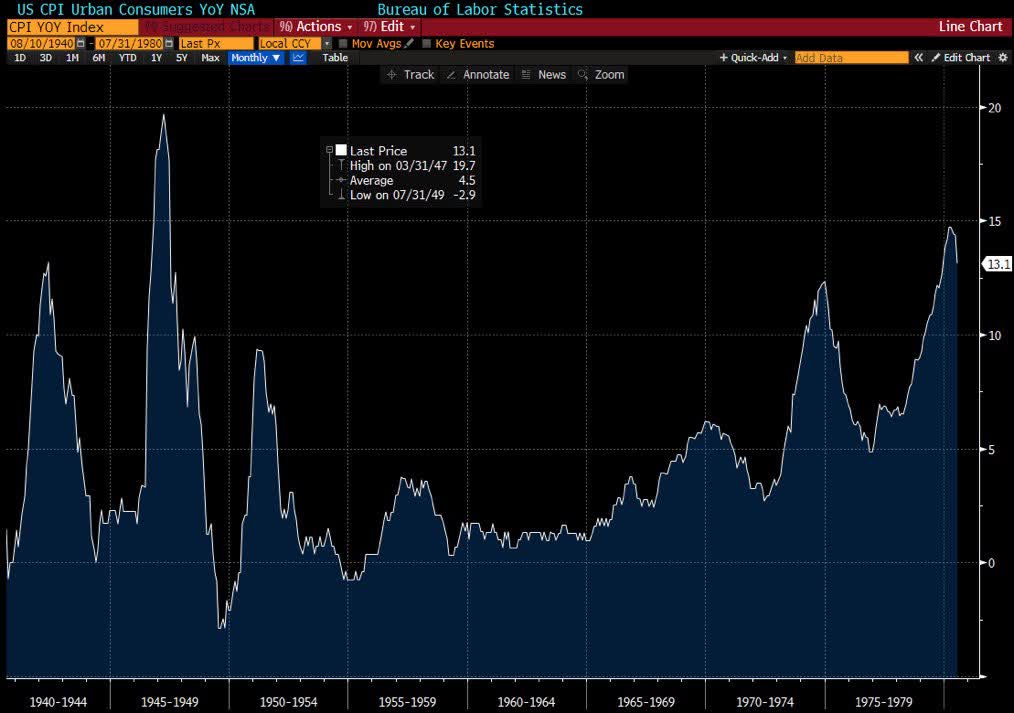
We believe that this initial downturn has already pulled the P/E ratio of the S&P 500 down significantly, closer to its baseline. But what may be far overlooked these days is the earnings side of the P/E ratio, as earnings have remained flat or increased slightly over the past few quarters.
However, as earnings fall, the weighted average price-earnings ratio of the S&P 500 goes up, making stocks more expensive. Even right now, without earnings compression, the price-to-earnings ratio of the S&P 500 stands at a multiple of 21.71. Historically, the S&P 500 has traded at an average of about 16 times earnings.
Perhaps the only indicator that is still surprisingly strong is the U.S. labor market. Without the strong labor market, the U.S. would surely already be in recession after the 2 consecutive quarters of negative GDP growth it has just experienced. In July, the unemployment rate fell to 3.5% from 3.6% in June the previous month. This is despite the fact that several major players in the technology sector have announced hiring freezes or layoffs.
The Bottom Line
As in 2000, the Nasdaq Composite experienced many bearish rallies of more than 20, 30 or even 40% before finally bottoming out at -78.40%. We are not suggesting that it is the same this time, but rather that valuations may be too frothy and that the risk of an earnings recession is not priced in at all.
In our opinion, there is a good chance that Michael Burry has a net short position, or is also hiding in cash to buy shares at a cheaper valuation later this year, if his thesis turns out to be correct.
Bloomberg Terminal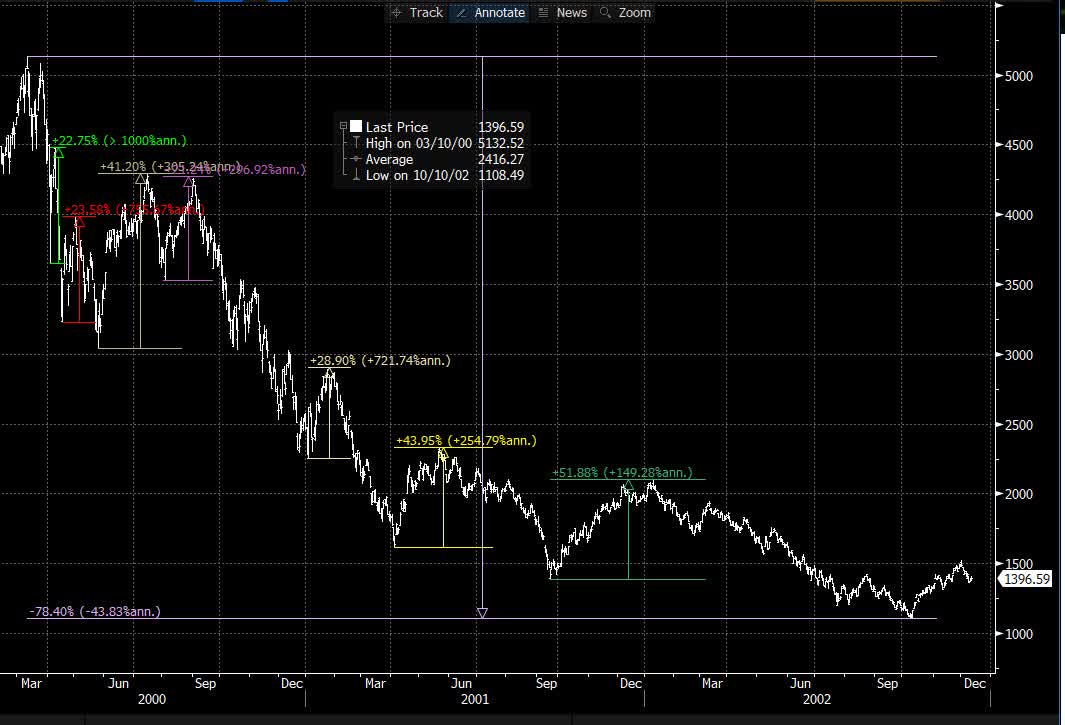
We remain cautious about buying stocks and think that the previous lows could be retested very soon, by the end of this year, if earnings are off slightly or begin to show signs of slowing growth. In the worst case scenario, if inflation continues to hover stronger than expected, the fed may have to continue to raise interest rates into an earnings recession, if the labor market allows it to do so.
And since the labor market is a lagging indicator, it is possible that the Fed is already too late when it sees a significant deterioration in the labor market and just continues “hiking” until something breaks, due to being “data-dependent.” After all, their goal is price stability and maximum employment. This perfectly paves the way for the Fed to continue to aggressively raise interest rates.
Be the first to comment