

Khanchit Khirisutchalual
Latest Economic Data
In light of an increasingly hawkish Fed, we are reviewing the economic data of late in order to sharpen our pencils, especially with respect to inflation and the economy.
In the US, Core CPI came in hot last month at 0.6% (vs 0.3% expectations). That raised forecasts for Fed hikes, and spooked investors to the tune of a near 5% hit to the S&P 500.
Last Friday, US sentiment numbers were reported.
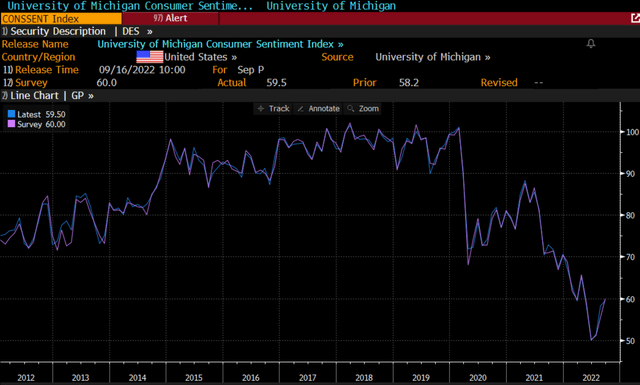
Sentiment Figures (Bloomberg)
Consumers look increasingly antsy.
Overseas, Europe and Asia are particularly weak. Revolving China lockdowns do not seem to be at an end. In the EU, we have been hard pressed to see how they avoid a recession in the coming months. German industrial production is down, and the German weekly economic activity index shows steady contraction, at negative levels since the invasion of Ukraine.
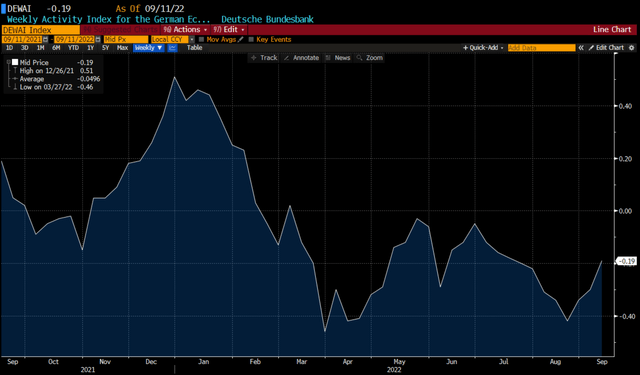
German Industrial Activity (Bloomberg)
The UK and France are also seeing industrial production declines (down 0.3% and down 1.6% respectively in July month over month, and also down year over year). Both are reporting flat GDP figures.
This is a good chart that illustrates the predictive power of the two-year Treasury with respect to Fed Funds.
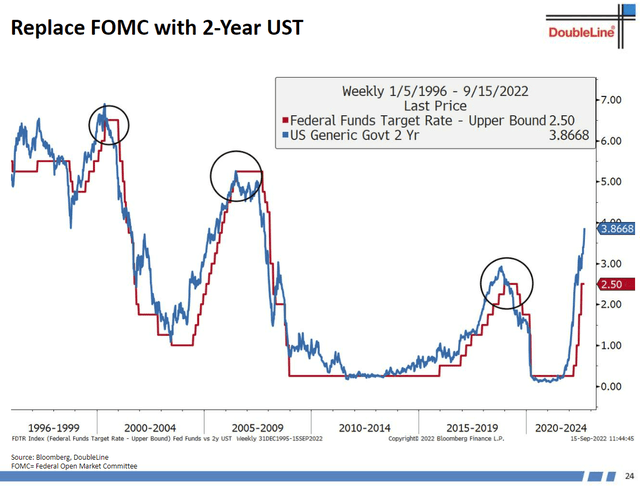
Bloomberg, Doubleline
Bond guru Jeffrey Gundlach (and most intel we see) thinks the Fed will hike from 2.0 to 2.25% now to a peak of 4.0 to 4.25%. That is 75 basis points this week, followed by two more 50 basis point rate hikes in Q4 (give or take).
The two-year has been dead-on in predicting where Fed Funds ends up.
Here is the problem (as we see it). The Fed is only halfway to its likely 4% Fed Funds rate, on the premise of high CPI data. But while year-over-year inflation looks high, that is entirely backward-looking data.
The month-over-month data look extremely benign. CPI, including the very important food and energy categories, was only up 0.1% in August. And it was up 0.0% in July.
The biggest driver of CPI has been shelter costs (aka owner’s equivalent rent), roughly 1/3 of the index. Excluding food and energy, shelter costs are ~40% of the CPI index. Our view is that the survey-driven results on which the Fed relies are wholly inadequate, and of course also backward-looking.
Here is a view of new single-family home sales.
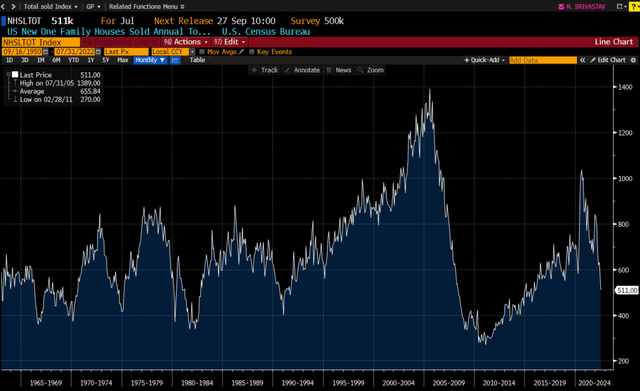
Single Family Home Sales (Bloomberg)
Most describe the housing market as already in recession. Prices directionally are not heading higher, as 30-year mortgages at 6% have all but “frozen” the housing market. Our homebuilder contact is now cutting his balance sheet as quickly as possible, unloading land and houses as the environment weakens.
Per Morgan Stanley, months of home supply has jumped from 2.1 months in January to 4.1 months today. This is an interesting bit of data too.
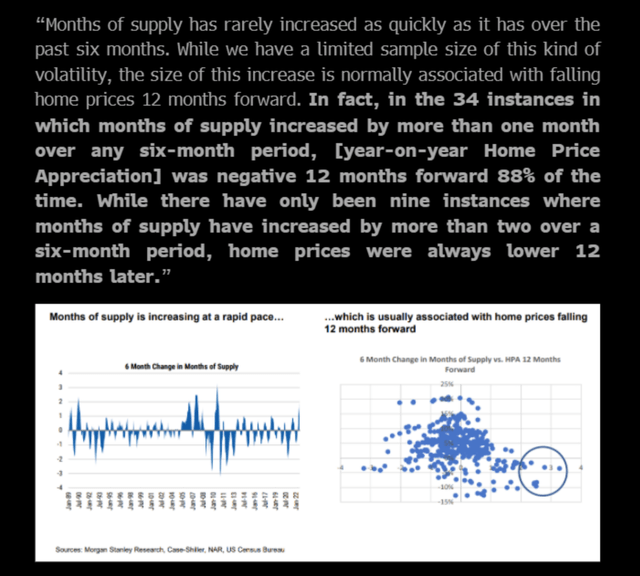
Months supply (Morgan Stanley)
The odds look very high that home prices will be flat or down a year from today. The argument that we are structurally short housing still is true, so we don’t see a collapse of the kind we witnessed in 2009 to 2012. Morgan Stanley expects housing prices to range from down 3% to up 3% in 2023.
That may be optimistic, however. Redfin data illustrates home prices down 6% from their peak a couple of months ago as well.
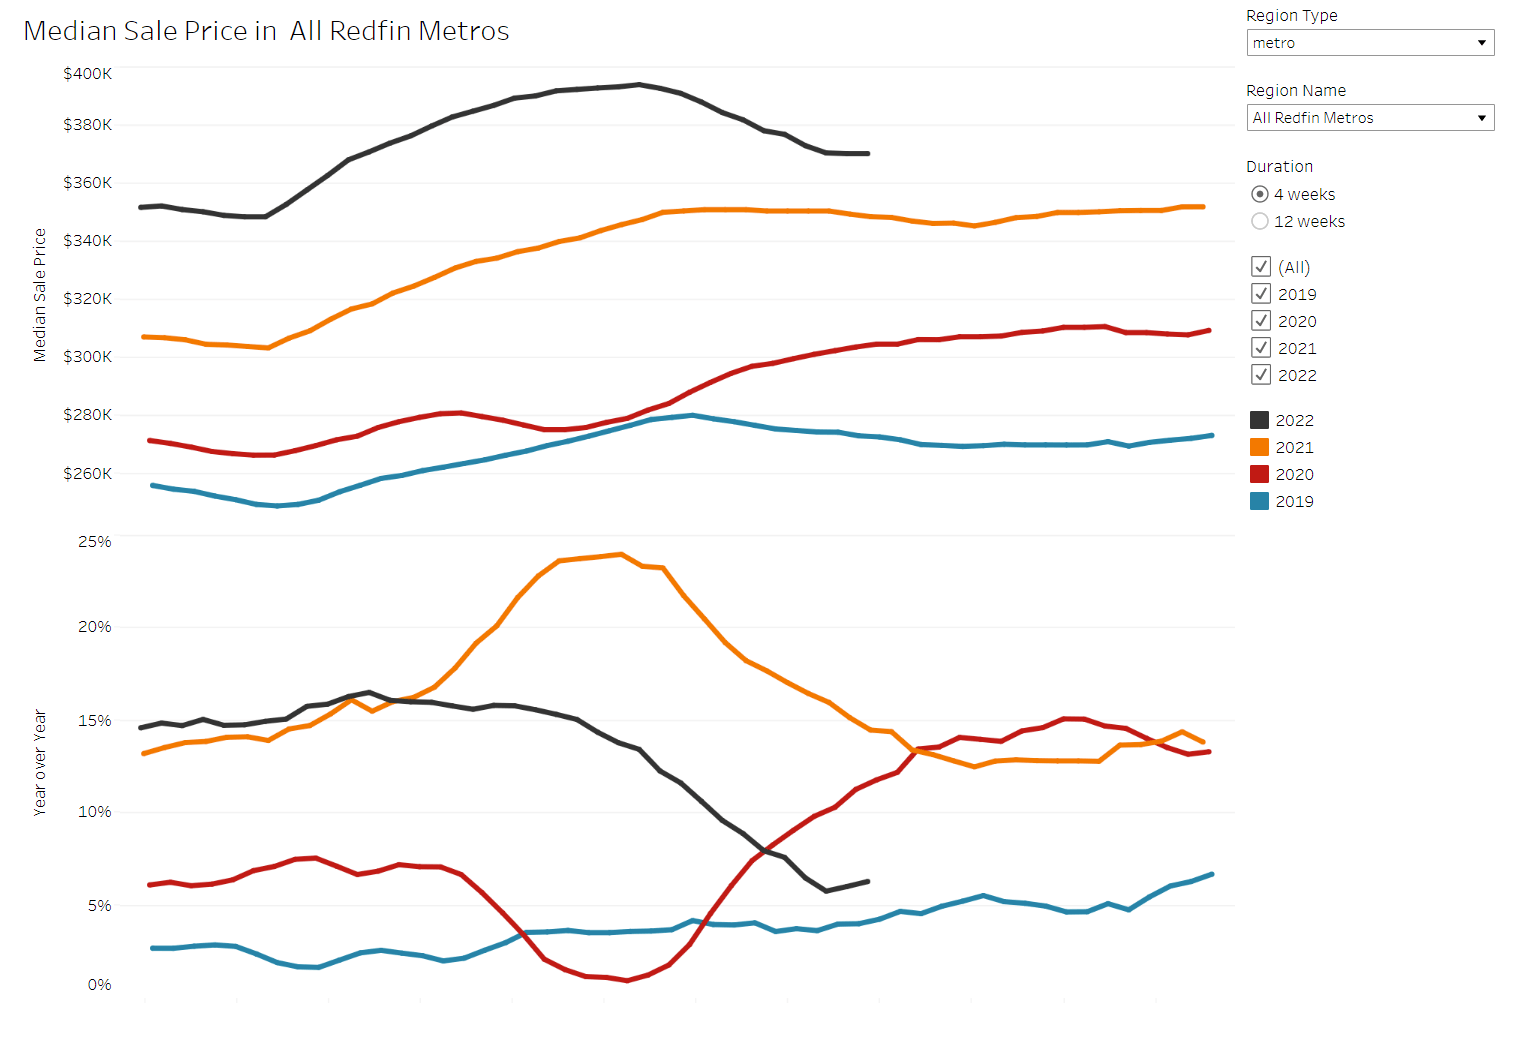
Home prices (Redfin)
As for actual rents, they are also rolling over rapidly.
On Wednesday, Redfin reported asking rents in the US. National rents hit a peak month-over-month figure of 1.6% last year, but currently, rents are only up 0.4% month over month. That is a 4.8% annual run rate obviously, far lower than the peak annual rate of 19% back in March.
The press release stated that “rent growth is likely to keep slowing as rising interest rates continue to cool the economy.”
Here is a chart of the Rent Index from Zillow.
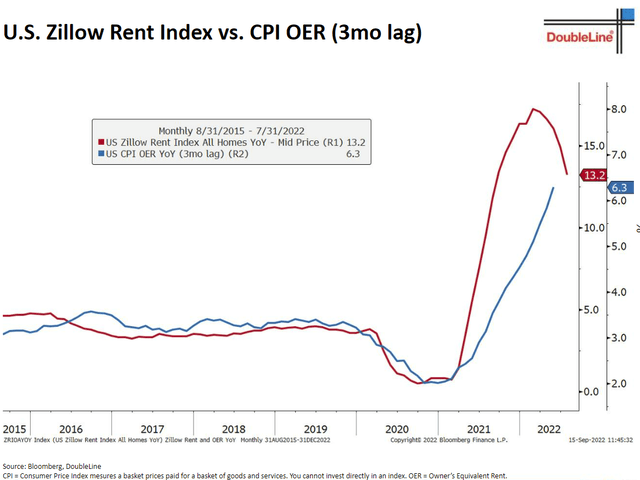
Bloomberg, Doubleline
Last week, Starwood Capital billionaire Barry Sternlicht discussed the rental market. Starwood is one of the largest owners of apartments in the country. Here are his remarks from CNBC.
In short, he agrees that rental prices are dropping fast (that is, growth is dropping; we are not seeing actual declines in rental prices yet). While comps are tough and rental prices will look high on a year-over-year basis through the end of the year, the reality is that rental prices and home prices are no longer contributing to CPI growth going forward.
Sequentially it seems likely that month-over-month rent growth declines from 0.4% to 0.2%-0.3% quite soon. That obviously annualizes to 2.4% to 3.6% rent inflation.
Similarly, wages are dropping too, with month-over-month wage growth dropping to 0.3% in August from 0.5% in July.
PPI was negative in August too, down 0.1% month over month.
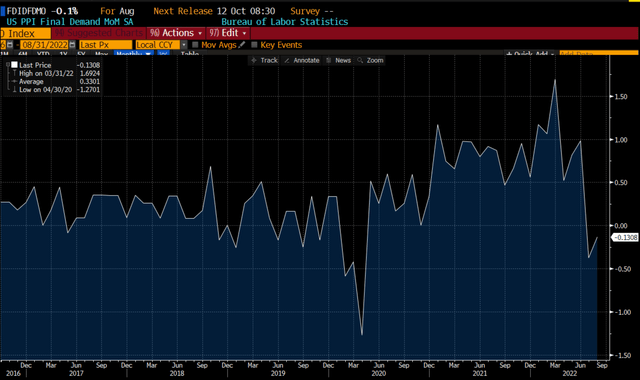
PPI (Bloomberg)
Used auto prices also are weakening.
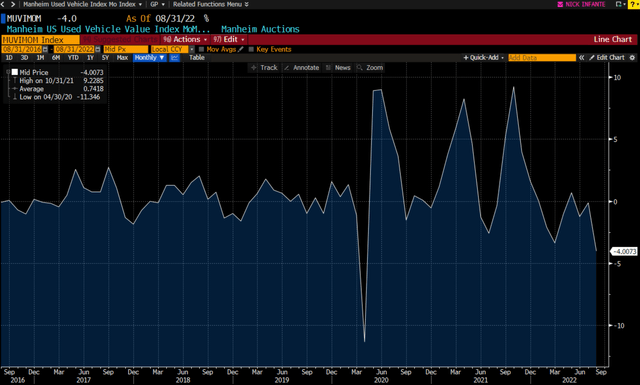
Used car prices (Bloomberg)
Used car prices fell 4.0% in August compared to July.
Forward GDP estimates from the Atlanta Fed show GDP growth declining in Q3.
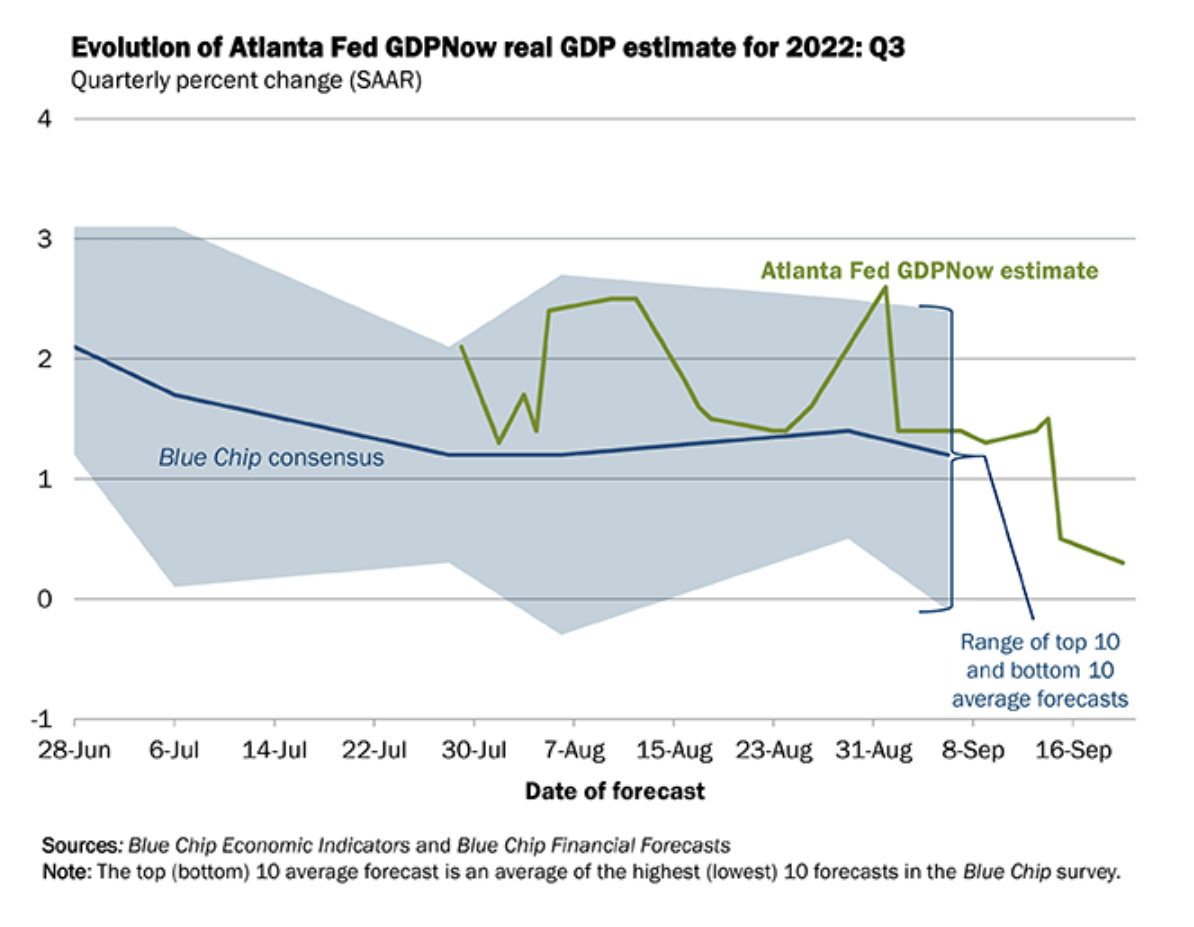
Atlanta Fed GDP estimates (Atlanta Fed)
Forward breakeven inflation expectations also have continued to decline. In fact, they have plummeted. In two years, real money is betting that inflation falls to under 2.5%.
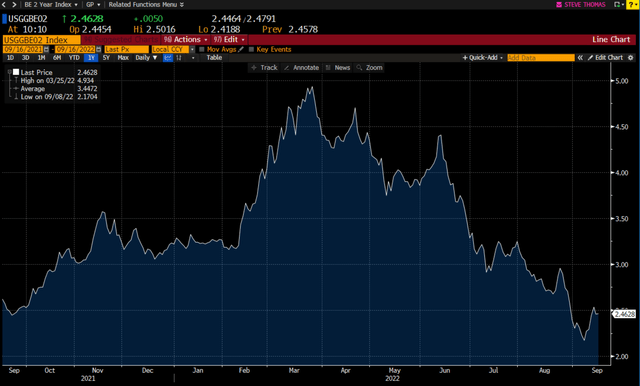
Inflation expectations (Bloomberg)
And on a one-year basis, the market suggests that inflation drops to 2.35%. (Note: these figures are calculated by subtracting the real yield on inflation-linked securities, TIPS, less the yield on similar-maturity Treasuries.)
Based on what we see, the odds of the CPI falling rapidly, especially in Q4/early 2023, are quite high.
So, with the Fed at max hawkishness, we again see a policy error in the making. Inflation could fall even lower than breakeven levels.
Investment Considerations
We have been optimistic about the US economy, particularly as consumer balance sheets appear strong. Delinquencies on credit card balances appear very low by historical standards.
Below are 30-day delinquencies of Discover Financial (DFS).
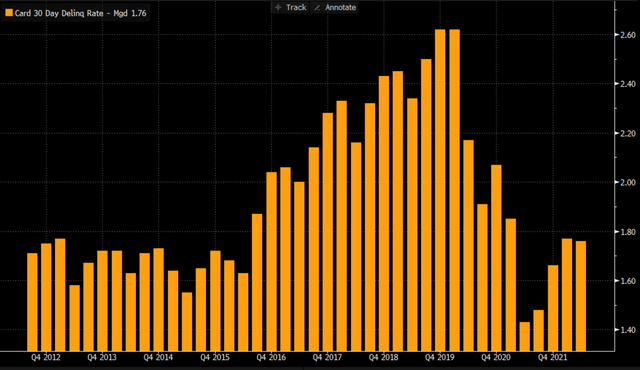
DFS Delinquency Data (Bloomberg)
If the Fed remains overly hawkish, as they appear to be right now, then the odds of a recession will continue to increase. Right now US recession odds are at 50% (per Bloomberg). Earnings revisions ala FedEx (FDX) could become more and more common.
The yield curve is screaming recession, as the 2-10 spread (difference between the 2-year and the 10-year Treasury yields) is quite negative.
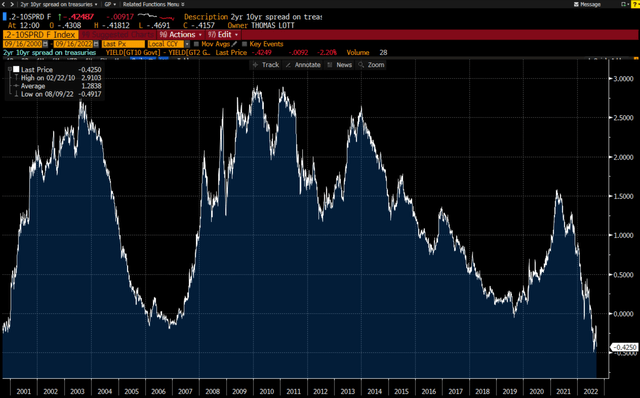
2s-10s Spread (Bloomberg)
Looking back, in the second quarter, we saw zero indications of any weakening in the US economy apart from a slightly negative GDP figure. That was driven more by government spending declines year over year than consumer spending weakness (which comprises 70% of GDP).
Companies seemingly across the board remarked that they saw no indications of a slowdown. That said, FedEx may be a canary in the coal mine. In their press release last week, FDX reported disaster results that were impacted by global volume weakness that “accelerated in the final weeks of the quarter.” On top of that, FedEx Express results were hurt by “macroeconomic weakness in Asia and service challenges in Europe.” The company remarked that the speed of volume weakness was surprising, both here and internationally.
The press release indicated that they expect conditions to worsen in Q2 (quarter ending November 30).
With the S&P 500 down ~20% year to date, we think a lot of bad news is priced into equities. Owning highly cyclical names, consumer discretionary stocks, or stocks without pricing power continues to look risky. Tech of course continues to crash (a falling knife I am not willing to catch). Value looks set to outperform growth for several years perhaps.
Our Defensive portfolio is 32% in cyclical industries (mostly owing to our MLP and financial exposure). That is a tad lower than the S&P, but much lower than the Russell at 53%. Given our view that banks appear priced for recession already and energy looks to be in structural shortage, we are sticking with our bets there. We put our Defensive portfolio together for subscribers at the end of last year (given the bubble conditions we saw out there in both growth stocks and bonds). So far in 2022, this portfolio is up 2% through August.
We highlighted seven different bonds last week that are low duration, and in our view, easy low-risk trades. If we are right that inflation likely rolls over quite rapidly in the near future (one month, 3-6 months?), then going out on the curve and buying duration is really where we want to be.
We have in the past remarked that we would be buyers of duration when the 10-year hit 3.5% to 4.0%. Well, today we are at 3.50%. Inflation fear is hitting extremes, despite data suggesting it is already flat and likely to fall on a sequential basis. I have deployed about 4-5% of my capital into a variety of longer-duration preferreds and bonds with a goal to add more if we get to 4% on the 10-year.
As a side note, credit-driven recessions are far different than inflation or Fed-induced recessions. Delinquencies and weakening credit are a reality of any recession, but when underwriting standards are strong and equity levels high (in housing, commercial real estate, etc.), creditors with problems need only sell assets (instead of defaulting).
We think bank loan loss provisions may move higher, but by far less than stocks suggest.
As we wrote in our chats last week:
I was just going through Financial Institutions (FISI), a well-run regional bank. It has a 4.65% div yield (a record ex March 2020 and the GR), trades 6.5x earnings forward 12-month earnings estimates (6x TTM), never cut the dividend, ever, and historically trades 12x forward earnings. Market seems to be implying a 45% decline in earnings (based on current price/12x earnings). They have doubled EPS since 2015 and have a miniscule $6.5mm of 30 day+ delinquent loans on their balance sheet out of $3.7 BILLION. Historically excellent underwriters. Reserves are $42mm today, or 7x NPLs (usually anything over 1.5x is solid). In 2020, non-performing assets hit 0.3% of loans at the worst, which implies 11mm of loan losses. Compared to reserves of $42mm, this is priced for a worse than pandemic scenario. Stock has de-rated from 10x this year to 6.5x earnings. People say the market is expensive, but beneath the big caps, stuff is insanely cheap. This bank has not had a money-losing year in its 25 years of Bloomberg history. Look at this valuation chart (forward P/E multiple). In 2008 and 2009, loan losses hit 0.83, which implies $31mm of losses. Compared to $42mm in reserves, seems this bank is priced already for a great recession. People say the stock market is expensive, but I still see dozens of high quality, small cap/mid cap names like FISI that nobody cares about, being given away.”
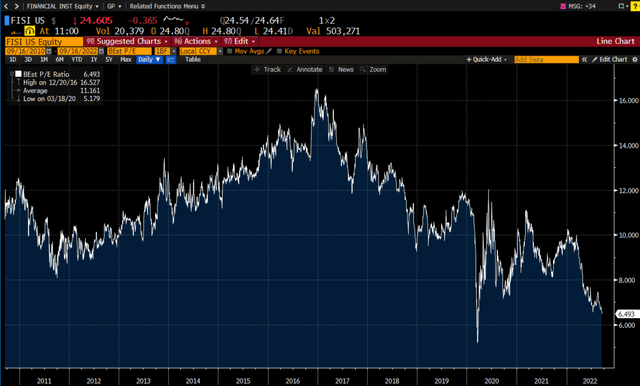
FISI P/E Chart (Bloomberg)
Amazing that in 2012, FISI traded at 9-10x earnings when the S&P was at 12x. Now the S&P trades at 17x and FISI trades at 6.5x. Growth at the company has been solid over the years, and we cannot see any logic behind the stock beginning to re-rate lower in 2017 (likely just capital flows chasing growth and technology stocks).
Among preferreds, there is a good chance that solid credits yielding 6-7% will drop back to perhaps 4-5%, give or take. In price terms, to take one example from below, CMS 4.2% preferreds are trading at 68c on the dollar (a 6.1% yield). If yields drop back to 4.2% again, this bond has 35% upside (maybe it takes two years, we don’t know exactly).
We would highlight these.
FCNCA Series A Preferreds
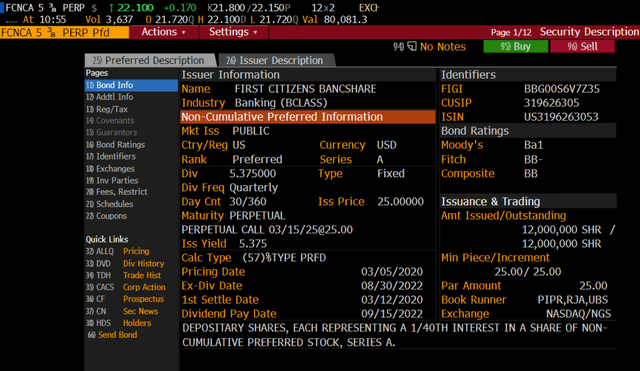
FCNCA preferred description (Bloomberg)
At a 6.1% yield to worst, we note just a year ago these preferreds were trading over $27, a 2.1% YTW.
Signature Bank Preferreds (SBNYP).
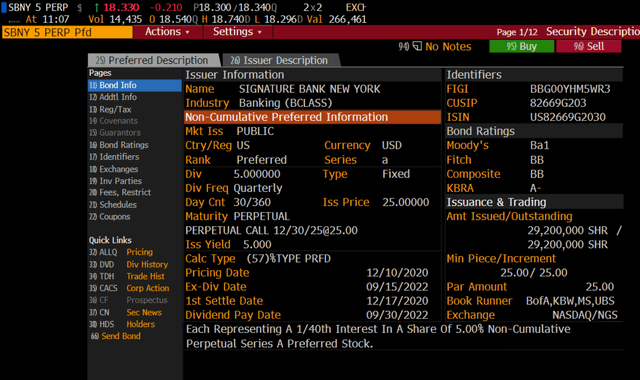
SBNY Preferred (Bloomberg)
We bought very small here in the $19 range a few months back and have mentioned it before. At $18.33 (73c on the dollar), these are down from a $26 high. A recession may create some fear here, but at a 6.8% yield, we like the risk-reward. The stock appears even more compelling.
Brookfield Renewable 5.25% Perpetuals
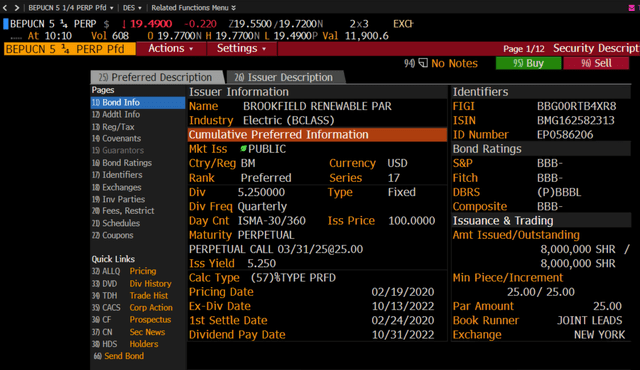
Brookfield Renewables (Bloomberg)
These are investment-grade bonds in a non-cyclical industry. These Brookfield perps yield 6.7% and traded at $26 for most of 2021. That was a 3.8% YTW, meaning that the bonds have widened by almost 300 basis points.
CMS Energy 4.2% C Perps are trading at $17.50 and yielding 6.1%. They traded between $24 and $25 for most of 2021 (they were issued in June). It is an investment-grade non-cyclical with solid management. We wrote up the stock last year.
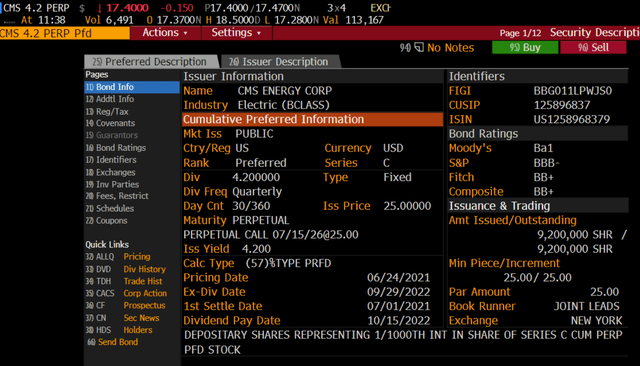
CMS Preferred (Bloomberg)
There are other high-quality ones too: JPM 6s (JPM PRC) probably get refinanced when yields return to earth. They trade right around par from $28.50 a few months ago. Same story with SF 6.25s (SF PRB’s). They are trading just under par ($25), are callable in March 2024, and probably will get taken out.
Note that most perpetual preferreds are TRADING vehicles only. Nobody lives forever and at current coupons, many of these may stay outstanding for years and years. So, at some point in a year or three, when these normalize in price, they will be sells.
The last time we wrote up a bunch of preferred ideas in May 2020, I personally ended up buying nine different issues, all of which were nice 10-20%+ gainers in just a few months. We wouldn’t expect that kind of outcome; it may take a bit longer. If we have a recession, and then these fall a bit more, followed by the Fed easing, then they will end up rallying quite a bit. The eventual path is of course unknown.
Long Duration Equity Trades
While expensive tech stocks are considered the longest in terms of duration, we find valuations still too high. We have written up Google multiple times and continue to recommend it, but see continued excess valuations as the norm (with EV/EBITDA multiples for the Nasdaq still 10% above 10-year averages).
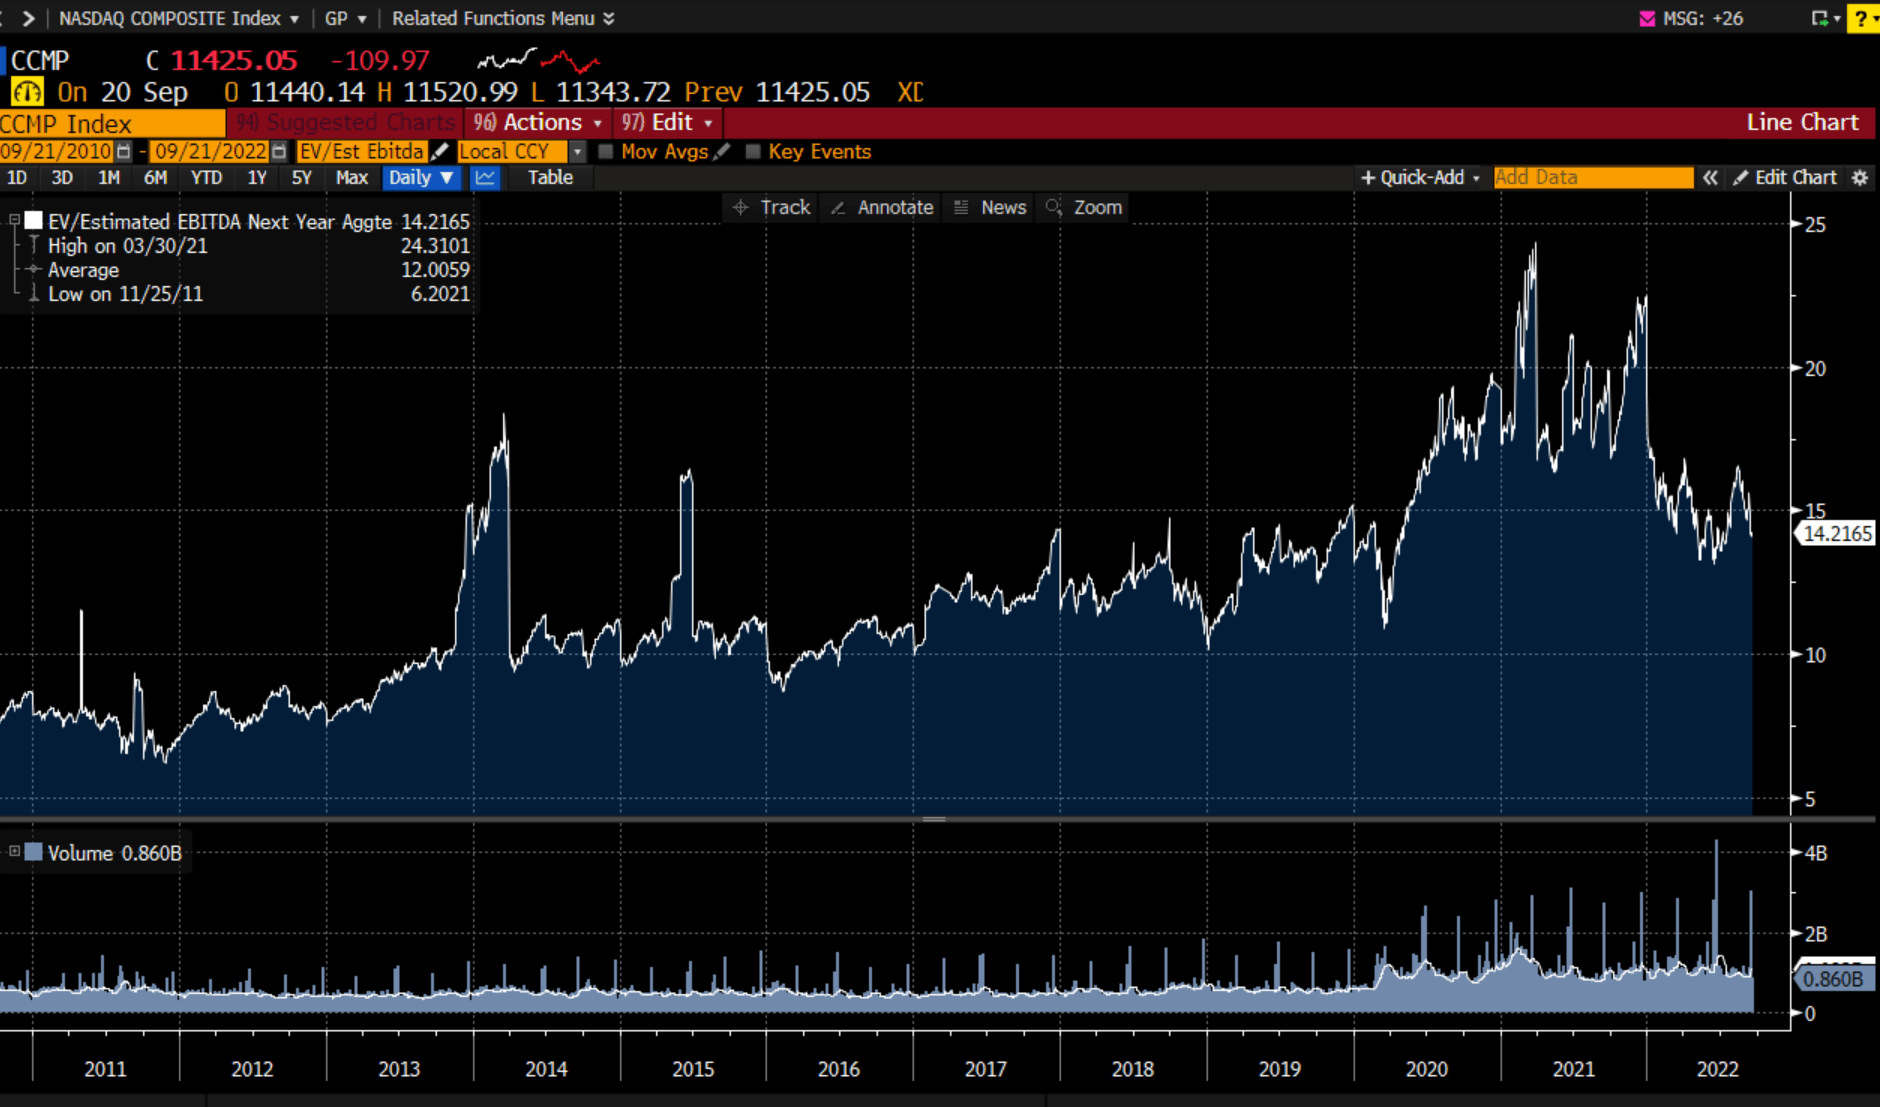
Nasdaq forward EV/EBITDA multiple (Bloomberg)
We plan to become more constructive 10% lower give or take.
REITs have been killed this year as yields have moved higher. The iShares U.S. Real Estate ETF (IYR) is down 21% year to date, worse than the S&P 500. While apartment REITs look like sells now (given the trend in rents coupled with still high inflation valuations), many fixed lease names look quite interesting.
Highwoods (HIW). We were early on this name, but at 8-9% cap rates, the margin of safety is huge. We wrote up HIW here. I added shares in the low $30s.
Realty Income (O). Our favorite REIT W.P. Carey (WPC) has been an outperformer, up 4.6% year to date. That is vastly better than the market or the REIT index/ETF. We would consider lightening and adding to O instead now, as it has more duration (i.e. more fixed, longer-dated leases) than WPC. At 15.75x forward P/AFFO, Reality Income is 2.75 turns cheaper than its 10-year, long-term average of 18x FFO.
American Tower (AMT) I still hold. It could drop from 25x to 22x FFO. But it is a high-quality tower lessor with both inflation-adjusted and fixed-type leases.
Utilities still look expensive to us, but we plan to own high-quality CMS Energy (CMS) for ages.
Conclusion
The odds are building that inflation will drop substantially in either late 2022 or in the early months of 2023, especially if the Fed hikes rates as expected. Our view is that economies are already weakening, with almost all categories of goods and services likely to see prices stabilize. Housing, autos, rents, energy, and other commodities are all showing signs of actually dropping, which should push CPI down. Base effects made inflation look quite high in 2021 (as prices collapsed during the pandemic in early 2020). Now the opposite will begin to occur in roughly Q1 2023.
Fed hikes usually take six months before they filter down into consumer behavior. The kind of Fed hikes we are seeing will really impact the economy in early to mid-2023. Housing already is in its own recession. We still cannot say whether we have a broader recession or not, but inflationary-driven recessions in the 1970s resulted in earnings falling 15% peak to trough.
That kind of hit seems priced into many high-quality names already, with most trading below long-term average P/E multiples.
I am taking some of my cash and putting it to work in a few longer duration preferreds. If we have inflation declines and a weak economy/recession, then yields likely fall back to 2% on the 10-year, and high-quality credit will outperform.
Risks to Inflation
Survey-driven CPI data. The Bureau of Labor and Statistics surveys homeowners and asks them what they think their homes could be rented for. Surveys may not reflect reality, as we saw last month with shelter costs per CPI up 0.7% month over month. Real data suggests home prices fell and rents grew 0.4%. It is anybody’s guess when this normalizes, but generally, there appears a lag in survey figures and actual rents/home prices.
Food costs. Agricultural commodities have rolled over from their summer peaks. Here is a chart of the Invesco Agricultural Commodities ETF (DBA). It tracks 11 different commodity prices.
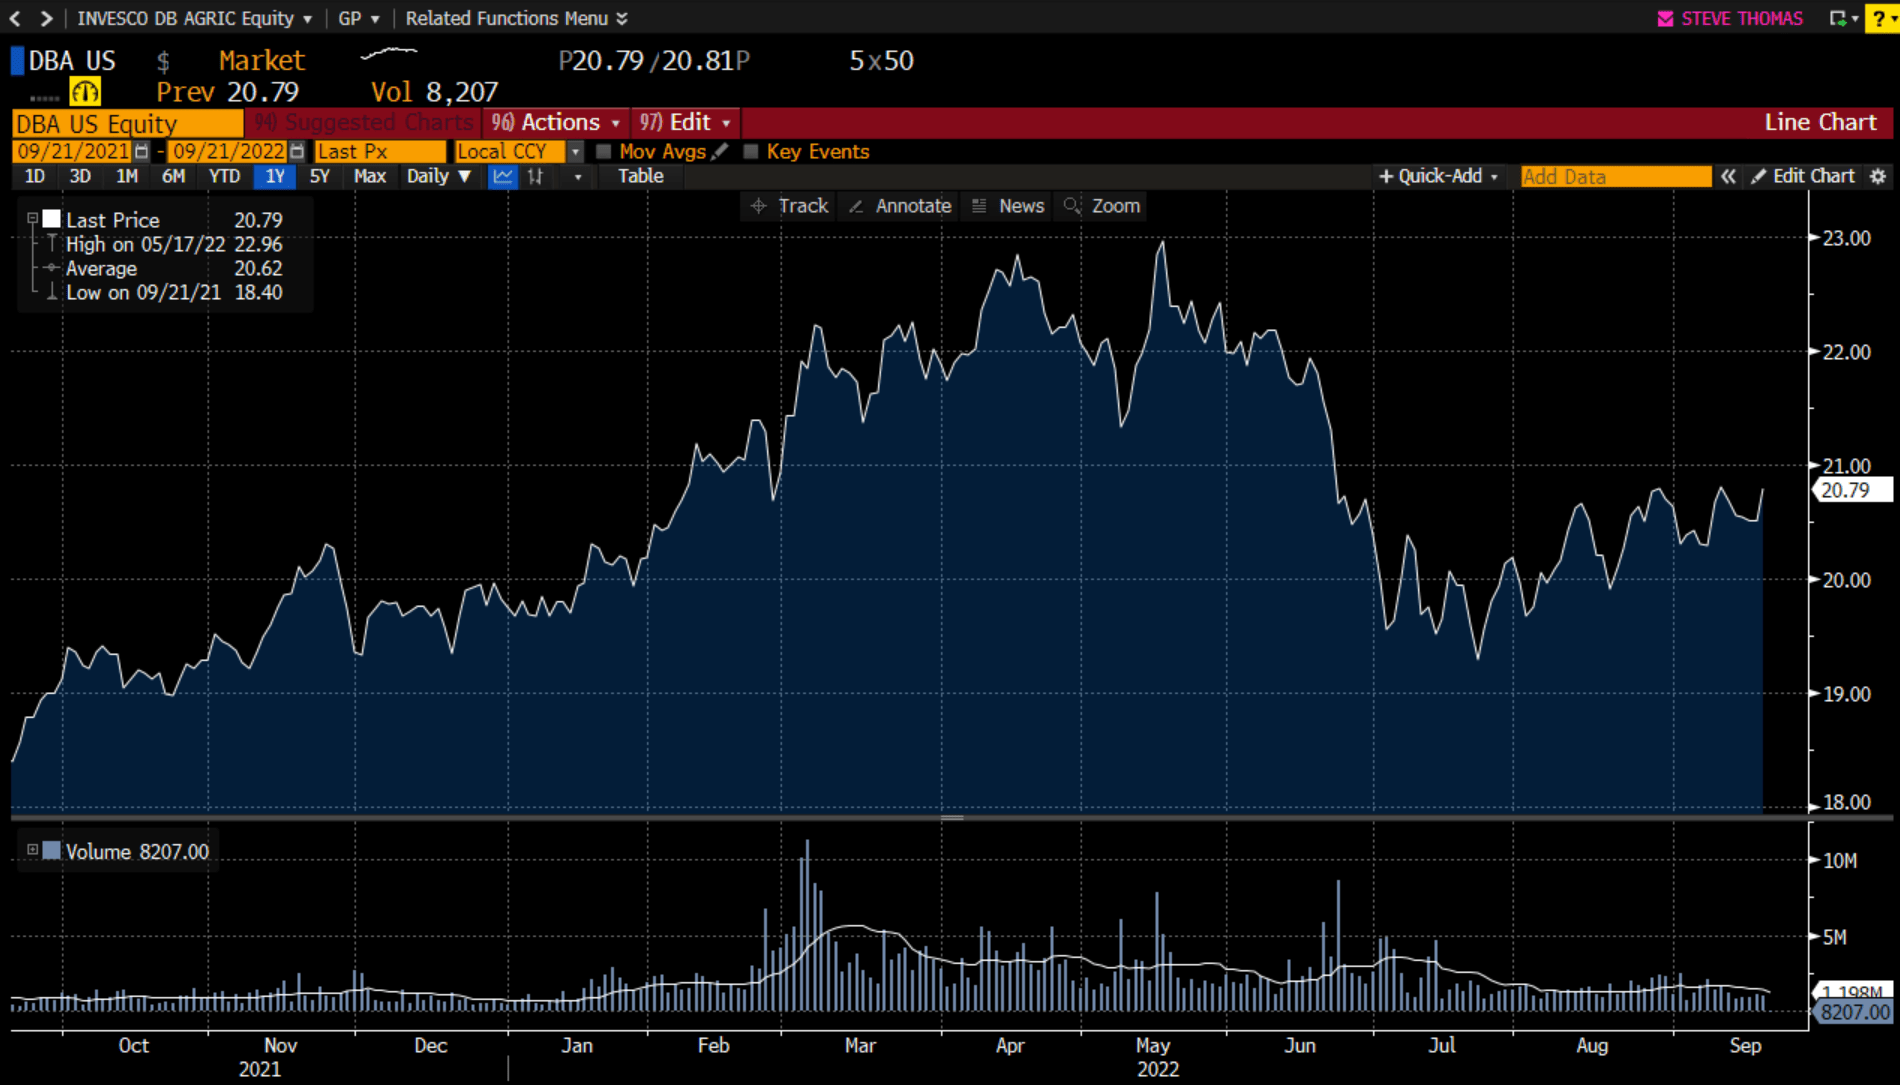
Food Commodity ETF (DBA) (Bloomberg)
Still, Ukraine grain shipments are under Russian threat and could be hindered after the November deal allowing exports expires.
China. The risks to supply chains appear to be improving, but rotating lockdowns threaten supplies of many products. That risks further shortages and inflation pressure.
Be the first to comment