


Stewart Sutton/DigitalVision via Getty Images
ZIM Integrated Shipping (NYSE:ZIM) is a niche name in the shipping field, noted for its asset-light structure and digital focus. ZIM has some intriguing qualities which could pay off in the long run, but given the current risks in store, I would be hesitant to get on board.
Here are a few reasons why I’m wary-
Adverse macros
Given the supply chain disruptions of recent years, a lot of businesses still think there is further upside for inventory builds which would be good for shipping volumes; see, for instance, the image below, which focuses on the American market, where the inventory to sales ratios for businesses, wholesalers, and retailers are still below the pre-pandemic range and look like they have further room to expand.
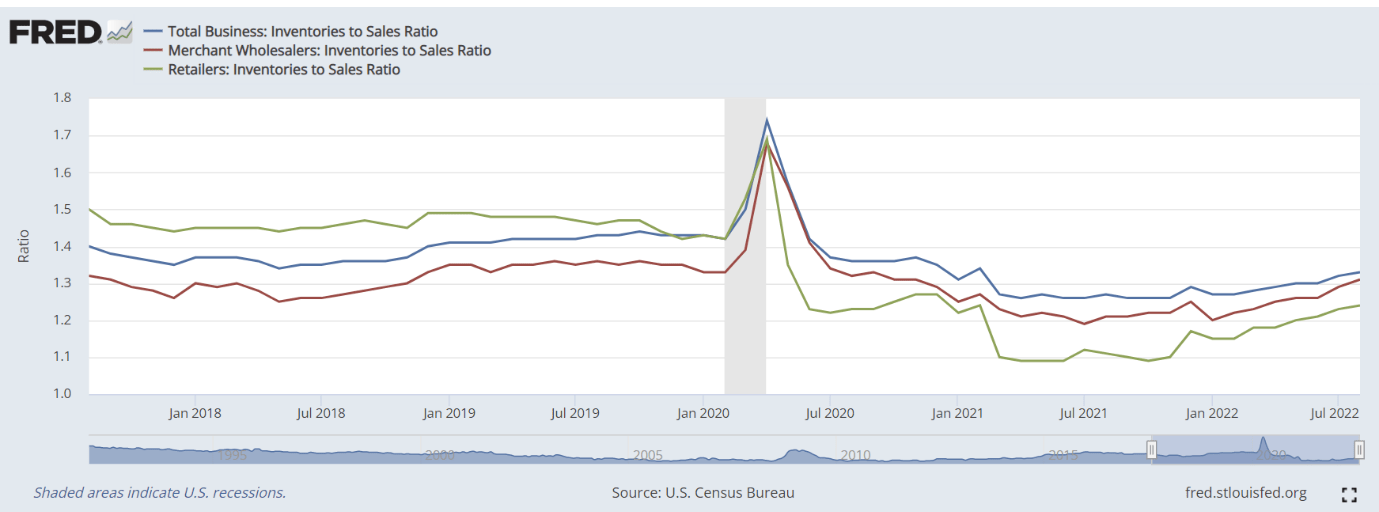
FRED
Nonetheless, I suspect this expectation for normalization of the ratio by way of higher inventories could be overstated, as fast-growing recessionary conditions- not just in the US, but- across the globe suggest that demand appetite will likely dwindle. The IPSOS Global Consumer Confidence Index which measures sentiment in the world’s most advanced economies is in a bad way, and crucially, the Expectations Index is at its lowest point since Dec 2020. If customers aren’t prepared to spend, what is the incentive for building inventories?
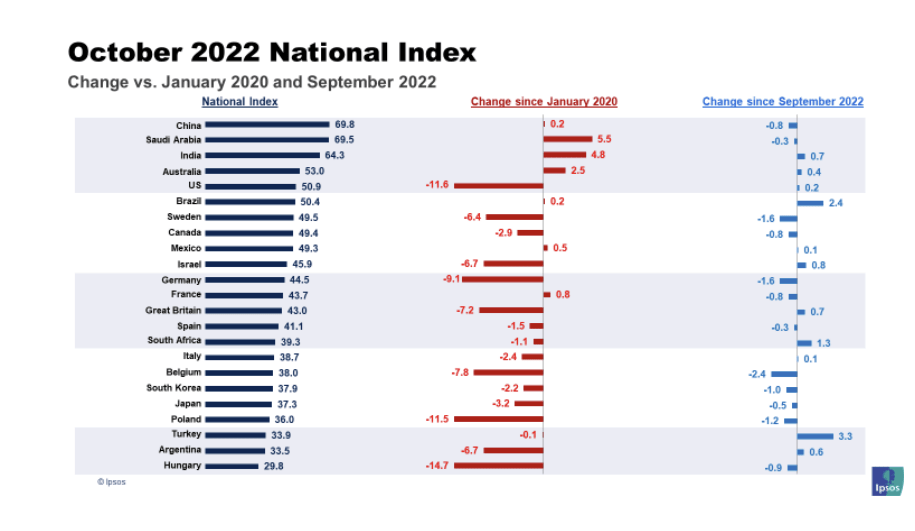
IPSOS
All in all, in 2023, global GDP growth will likely slow to 2.7% from 3.2% in 2022, but note that growth in merchandise trade will come in at an even slower pace of only 1.2%.
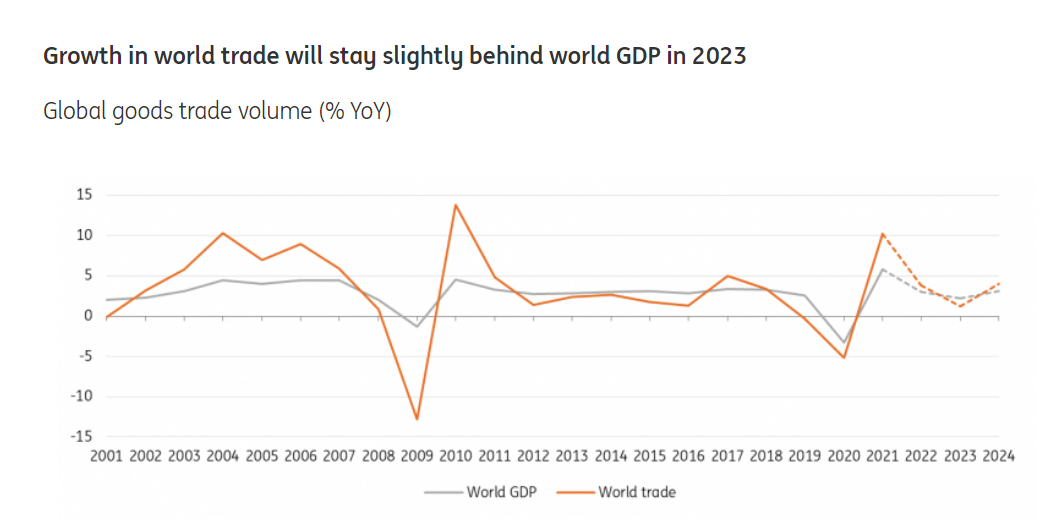
ING
Meanwhile, the theme of heightened vessel delays which was quite pronounced last year and was integral in supporting strong freight rates continues to ease off. At the turn of this year, the global fleet unavailable due to delays stood at ~14%; in recent months it has dropped to less than 8%. ZIM of course remains particularly sensitive to movements in the spot rate, quite unlike some of its larger peers who have the benefit of locking in a large chunk of long-term contracts. For instance, between the Far East and the US West Coast, the spread between spot and long-term market rates was closer to $3000 per FEU. The global container freight index has been in a freefall since February and recently dropped below the $3500 per 40ft mark. I suspect there could be greater downside pressure here given the significant shipping capacity that is expected to come on board from next year.
ZIM also has significant exposure to the intra-Asian markets (In H1-22 it accounted for 32% of ZIM’s total volumes, second only to the Pacific region) but I don’t think the market has begun to factor in the weakness that has beset this region as well. For much of this year, cargo movement in this region has held up reasonably well on account of the RECP agreement but certain pockets there, particularly from India to Central/North China, Singapore, etc. have seen rates come off by 30-50% from levels seen in late August.
Deteriorating Financials
In H1-22, ZIM delivered solid results, where revenue grew by 73% YoY and the adjusted EBITDA grew by an even greater figure of 115% YoY. Considering the adverse macro conditions discussed in the previous section, coupled with the high base effect which kicks in from Q3. Last year, in Q3-21, ZIM had generated $2.1bn of EBITDA, representing mammoth growth of nearly 700% annually. It’s fair to say that ZIM won’t be revisiting those H1 thresholds any time soon.
After generating well over $2bn of EBITDA per quarter for the last four quarters now, consensus estimates show that the EBITDA run-rate could drop to less than $1 billion ($815m to be more specific) by the end of this year. What’s worrying is that this is unlikely to be temporary and the degree of negative operating leverage will continue to play out until FY24 at the very least.
Consider how consensus expectations are positioned over the next two years; in FY22, ZIM will likely finish the year with $12.7bn of sales and an EPS of $40. This would imply 2.6% bottom-line growth on 18% topline growth; next year it gets worse with -80% de-growth in EPS vs -53% de-growth in sales. By FY24, you’re only looking at an EPS figure of $2.93 (implying -64% de-growth in EPS), with a 5% decline in sales.
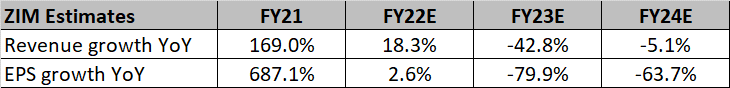
YCharts, Seeking Alpha
There’s a school of thought that believes that ZIM is cheaply valued (Forward P/E of 8x based on the FY24 EPS), but think twice about what you’re getting into here. This is essentially a business that will witness consistent earnings declines for the foreseeable future, with an FY24 EPS that will likely be less than a tenth of what it was in FY21.
A lot of investors also gravitate to ZIM for its stupendous yield, but given the pace of negative operating leverage in store, and the potential EPS compression, I’m not sure the company will have ample elbow room to maintain the same level of payouts that we’ve just seen.
I’m also queasy about engaging with a business where debt levels (including capital leases) have surged to the tune of $4.5bn from the pre-pandemic range of $1.3-$1.5bn per year. With the business cycle having turned adversely, the added financial leverage is less than ideal, particularly when you consider that free cash flow generation too will likely come off in a big way, considering the weakening trend of freight rates.
Unappealing Technical Landscape
The price action on ZIM’s weekly chart is also looking discouraging and suggests further weakness ahead.
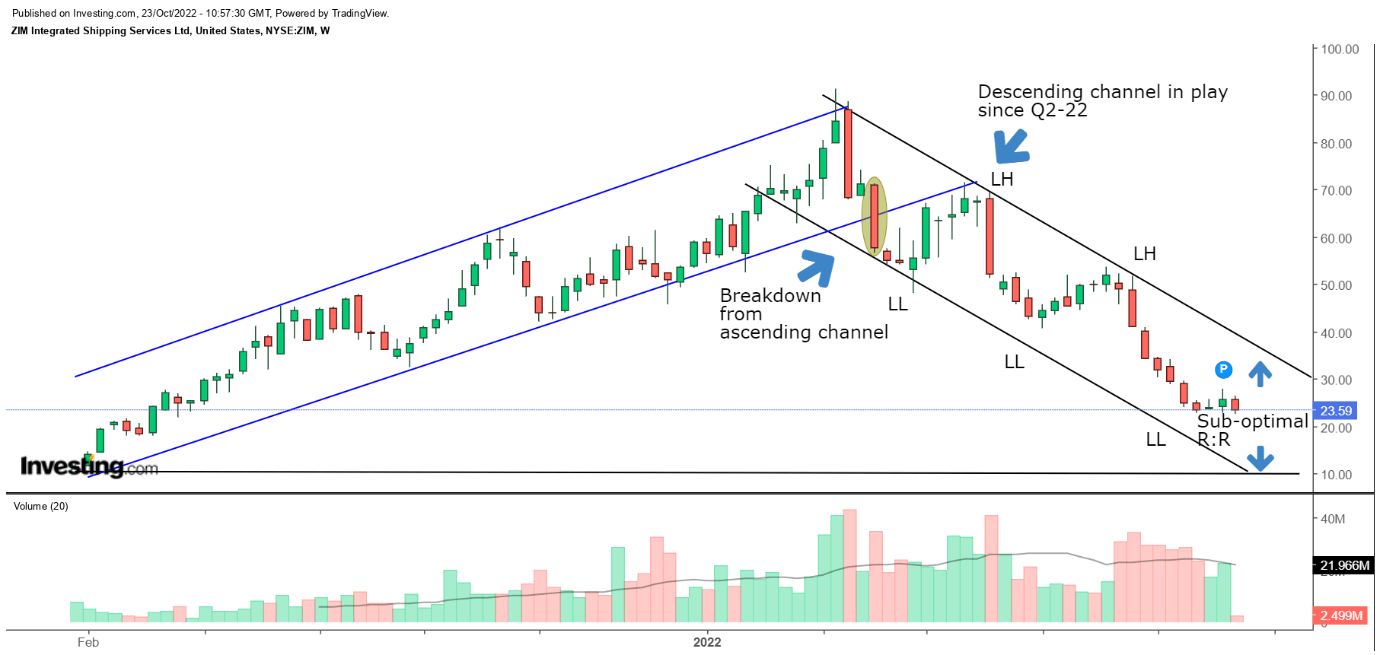
From its listing date until mid-March this year, ZIM’s stock had been trending up in the shape of an ascending channel. We then saw a breakdown from this channel in early April, and since then we haven’t seen any respite from a series of lower lows (LL) or lower highs (LH). Based on what we’ve seen so far, it looks like we’re in the midst of a V-top pattern.
At current price levels, the risk-reward for a long position doesn’t look too appealing, as it’s a long way from the lower boundary of the channel which also coincides with the listing price zone. Admittedly, in the last three weeks, we’ve seen some flattening out of the price action, but even if one were to see an upward thrust from these levels, it’s difficult to make a case for ZIM breaking past the upper boundary of the descending channel boundary which is close to the $30 levels.
Investing
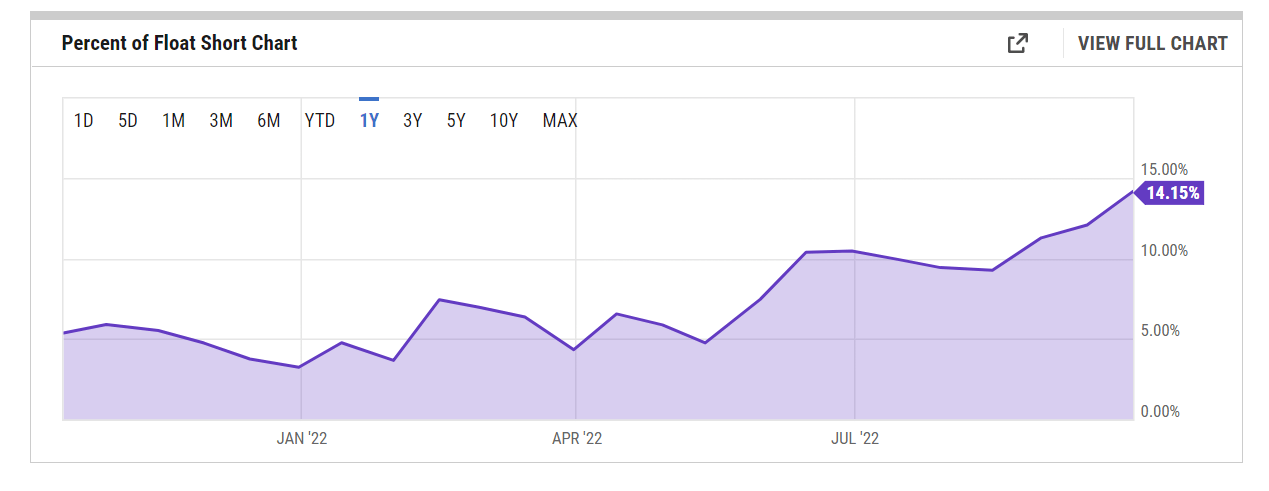
It also doesn’t reflect well on a stock when short-sellers continue to pile on, even as the price drops to lower levels. Since May, the level of float that is short has tripled from levels of 5% to levels of 15.4% as of mid-October. Clearly, the force is with the bears at the moment, and it would be prudent not to get in the way.
YCharts
Be the first to comment