

Marlon Trottmann
Introduction
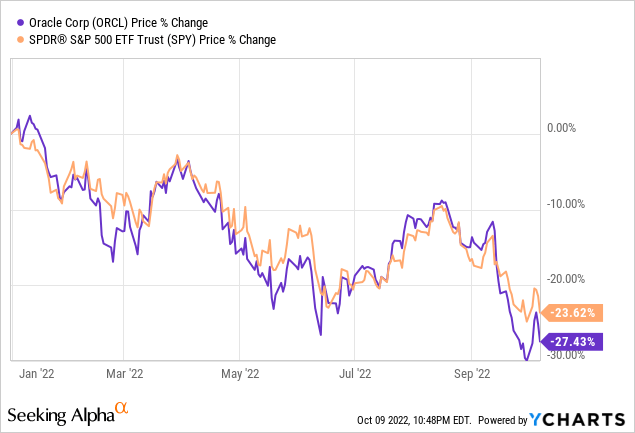
Oracle (NYSE:ORCL) is an American computer technology company that is mainly known for their cloud systems and database management systems in the Systems Software Industry. We can see that year-to-date, ORCL stock is underperforming the broader market and they have lost as much as 27.43% of market value while SPY declined by 23.62%.
After first analyzing the company’s financial performance, I do not believe this is an optimal buying opportunity for ORCL right now with reasons such as mediocre financial growth, valuation providing minimal upsides, and more. Investors, in my opinion, should “Hold” and wait for a better buying opportunity in this stock. Let’s begin with an overview of what has occurred so far in the company activity analysis.
Company Activity
Oracle recently released fiscal 2023 Q1 on September 12th, and it has some mixed financial results. In case you missed it, here is a quote from their filings page that I found helpful in recapping the company’s performances thus far:
Total quarterly revenues were up 18% year-over-year in USD and up 23% in constant currency to $11.4 billion. Cloud services and license support revenues were up 14% in USD and up 20% in constant currency to $8.4 billion. Cloud license and on-premise license revenues were up 11% in USD and up 19% in constant currency to $0.9 billion. For the first quarter of fiscal 2023, Cerner contributed $1.4 billion to total revenues.
I then looked into Oracle’s Financials section and compiled the history of 2 important metrics: Normalized Diluted EPS and EBITDA. Oracle is a mature company and they have steadily grown EPS at a moderate 10-year 4.77% CAGR (calculations from May 2013 to May 2022). I also calculated the 10-year CAGR on EBITDA from the same time period to result in a meager 1.39% CAGR. These growth rates are mediocre for a company in a growing industry, and I am unsure if Oracle will keep pace with the industry. For example, if we take a look at the top companies in the Systems Software Industry, we can see Oracle hovering around the 14th to 15th position in growth, performance, etc. To further put this into perspective, Oracle has lagged behind the System Software Industry’s growth rates. According to NYU Stern’s historical data, the broader Software System & Application Industry has grown at a 23.04% 5-year CAGR with regards to net income which is far below Oracle’s growth rates mentioned above.
Normalized Diluted EPS (Seeking Alpha) EBITDA (Seeking Alpha)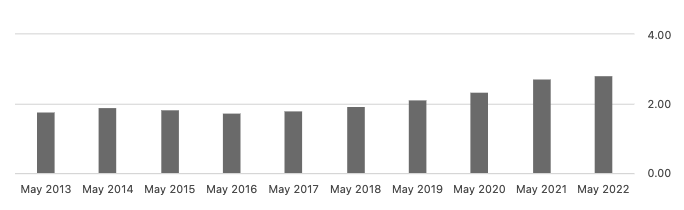

In addition to slow growth, there has been significant insider selling activity within the past 4 years. Insiders have bought $3.18 million while they sold nearly $1.48 billion in the time frame mentioned above. This is somewhat troubling and I believe that this could signal poor insider confidence within the company.
MarketBeat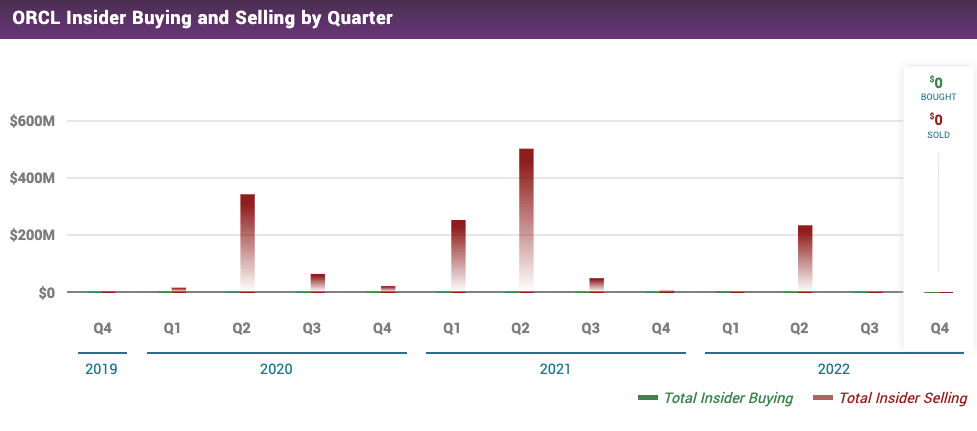
But, there are positives to note here. In Oracle’s Q1 10Q, I noticed that management has been repurchasing shares in the past months and has a large buyback program of nearly ~$9 billion. Investors would be pleased to note their commitment to shareholder value, which would ultimately provide some support for the stock price. Here is a quote below on more details of these stock buybacks below from the 10Q:
Our Board of Directors has approved a program for us to repurchase shares of our common stock. As of August 31, 2022, approximately $8.9 billion remained available for stock repurchases pursuant to our stock repurchase program. We repurchased 7.5 million shares for $559 million during the three months ended August 31, 2022 (including 0.3 million shares for $26 million that were repurchased but not settled) and 94.0 million shares for $8.0 billion during the three months ended August 31, 2021, under the stock repurchase program.
Dividends Appear to Have Stable Recovery
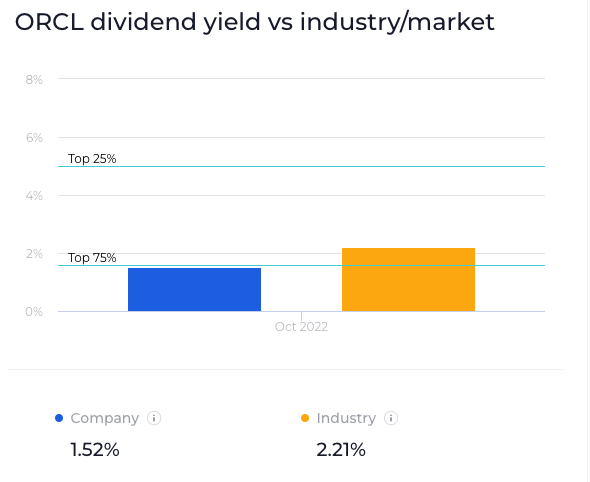
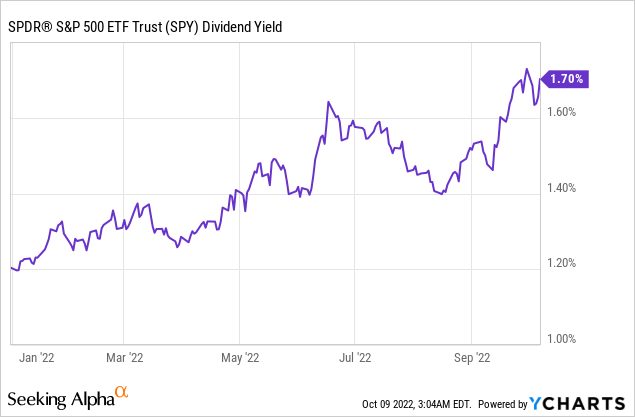
Currently, Oracle has an annual dividend of $1.28 per share at a 1.79% annual yield. This yield is higher than SPY’s 1.70% but under the industry average of 2.21%. The company’s dividend program means the company falls short of the top 75% of dividend-paying corporations in the United States. Additionally, the company’s EPS of $2.66 is more than enough to cover the annual dividend per share, leading to a sustainable payout ratio of 48.12% (derived by dividing annual dividend per share over EPS). Dividend yield rates additionally have seen recovery from the 2015 value and have grown back at a 15% 7-year CAGR since, providing investors with constant dividend growth for the last decade.
WallStreetZen WallStreetZen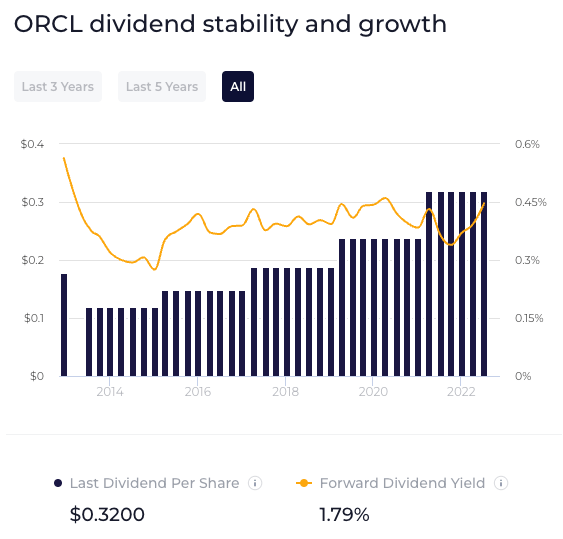
Stock Valuation
Oracle offers stable dividend payouts compared to its lumpy Free Cash Flow metric; thus, I valued the stock using conservative assumptions for the Gordon Growth Model (‘GGM’). The GGM valuation approach works by assuming a constant sustainable dividend growth rate and discounting it back into the current stock price with a required rate of return. This is all summed up into this equation: “value of the stock” = “dividend per share” divided by “discount rate – dividend growth rate”. It is worth noting that GGM frequently undervalues stock prices in general since dividend growth is conservatively expected to remain constant.
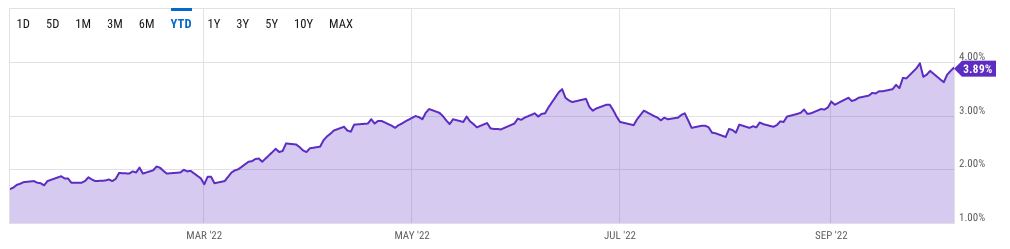
Knowing this, I first based my model on an annualized $1.28 dividend per share calculated by adding the preceding four quarters’ $0.32 dividends (price history via Seeking Alpha). Then, I reasonably derived a discount rate of 5.9% from the cost of equity based on a 3-year levered-beta of 0.5. I estimated that dividends will grow in-line with inflation to be conservative, which I estimate from the 10-year treasury yield chart below. Plugging these three key values into the equation above, I found that the model yielded an intrinsic value of $63.68 per share, reflecting a minimal 0.6% upside over the current price of $63.68.
Google Sheets YCharts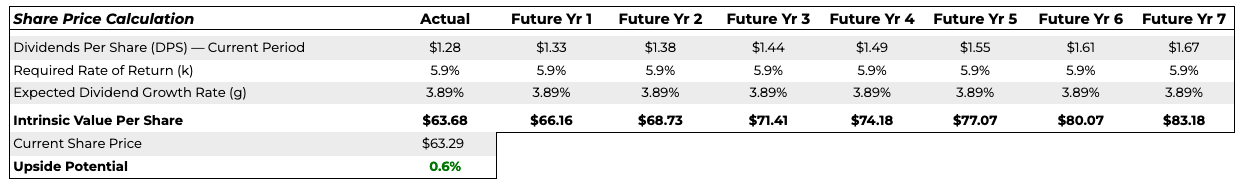
Risk Headwinds
The biggest risks that stand out for Oracle are the rising competitive landscape within the Software Industry and the harsh effects of the Federal Reserve’s Monetary policy. We have been observing more and more well-known technology companies significantly investing in sectors where Oracle was dominating in, and, as a result, Oracle was unable to maintain its competitive positioning. It is evident that the other companies above the company all together can cut losses and cause the company to spend more cash. Here is a graph and a quote from an article from Ibisworld summing up the recent activities:
“There are 16,431 Software Publishing businesses in the US as of 2022, an increase of 10.4% from 2021”
Ibisworld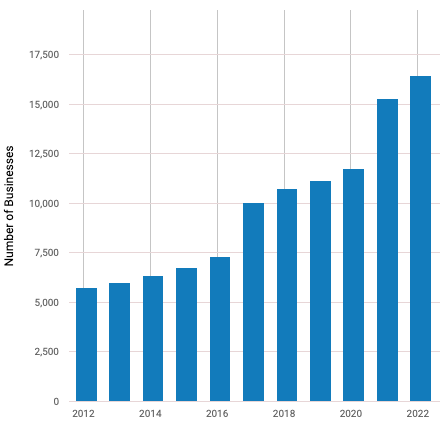
In addition, the overall macroeconomic landscape caused by the Federal Reserve’s attempts to taper down the inflation rates still makes it difficult for companies especially like Oracle to operate in. Inflationary rates have been leveling out to roughly 8.3%, but these rates still are the highest it has been in the past 5 years.
TradingEconomics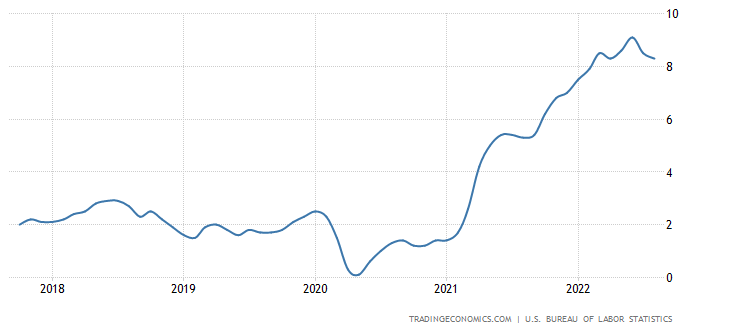
Competitor Comparisons
The last part of my thesis revolves around Oracle’s competitive positioning and its comparison with competitors in the Systems Software Industry. I created a simple table below to compare Oracle’s financial performances (with data from Yahoo Finance) to similar competitors that income investors may seek out as an alternative such as Microsoft (MSFT), Adobe (ADBE), and more.
As a result, this table of P/E, P/S, and EBITDA yielded moderate results to say the least. When compared to industry giants like Adobe and Google (GOOGL) (GOOG), Oracle has a far cheaper P/S and P/E valuation. Not to mention, ironSource Ltd. (IS) (the top-ranked stock in the Systems Software Industry on Seeking Alpha) still has a higher P/S and P/E ratio. But, Oracle’s EBITDA is comparable to its competitors as they provide a higher EBITDA than Adobe, ironSource Ltd, SAP (SAP), and more. Overall though, competition in the industry is fierce and similar companies have the possibility to pressure and cut Oracle’s market share. With all of this, though Oracle is cheaply valued relative to peers in the industry, competitive pressures are still a concern to note.
|
Company |
Ticker |
P/S |
P/E |
EBITDA (Billions) |
|
Oracle |
ORCL |
3.95 |
12.76 |
18.4 |
|
Microsoft |
MSFT |
9.48 |
24.69 |
97.98 |
|
Adobe |
ADBE |
7.98 |
18.32 |
6.73 |
|
|
GOOGL |
4.75 |
16.34 |
96.89 |
|
ironSource Ltd |
IS |
6.25 |
14.51 |
108.25 M |
|
SAP SE |
SAP |
3.55 |
14.39 |
6.3 |
|
Cisco Systems Inc |
3.27 |
11.40 |
15.9 |
Conclusion
Again, I do not believe that ORCL Stock is an optimal purchase right now. Oracle historically has been growing at below industry average rates—this is reflected in EPS 4.77% 10-year CAGR and EBITDA 1.39% CAGR compared to the Software System & Application Industry 23.04% 5-year CAGR. My conservative Gordon Growth Dividend model resulted in a valuation price of $63.68 which is only a slight 0.6% upside from its current market price. I also think that competitive pressures and inflationary risks all together can be a serious headwind for Oracle. I will reassess my thesis following Oracle’s 2023 fiscal year Q2 earnings announcements or when the macroeconomic environment improves, but for now, with all the reasons discussed above, I recommend a “HOLD” on ORCL stock.
Be the first to comment