

Auris/iStock via Getty Images
Demographics are one of the most important factors when analyzing the economy.
Demographic trends are incredibly powerful when analyzing long-term trends in economic growth, inflation, and by association, trends in interest rates and other asset prices.
When talking about demographics, what do we really mean? The discussion of demographics usually centers around two main factors: The population’s growth rate and the population’s composition or age structure.
The economic process at EPB Macro Research involves careful study of secular or long-term economic trends, factors that influence growth and inflation over 3-5 years or even longer, and cyclical economic trends or the shorter-term fluctuations in growth over the 6-18-month window.
EPB Macro Research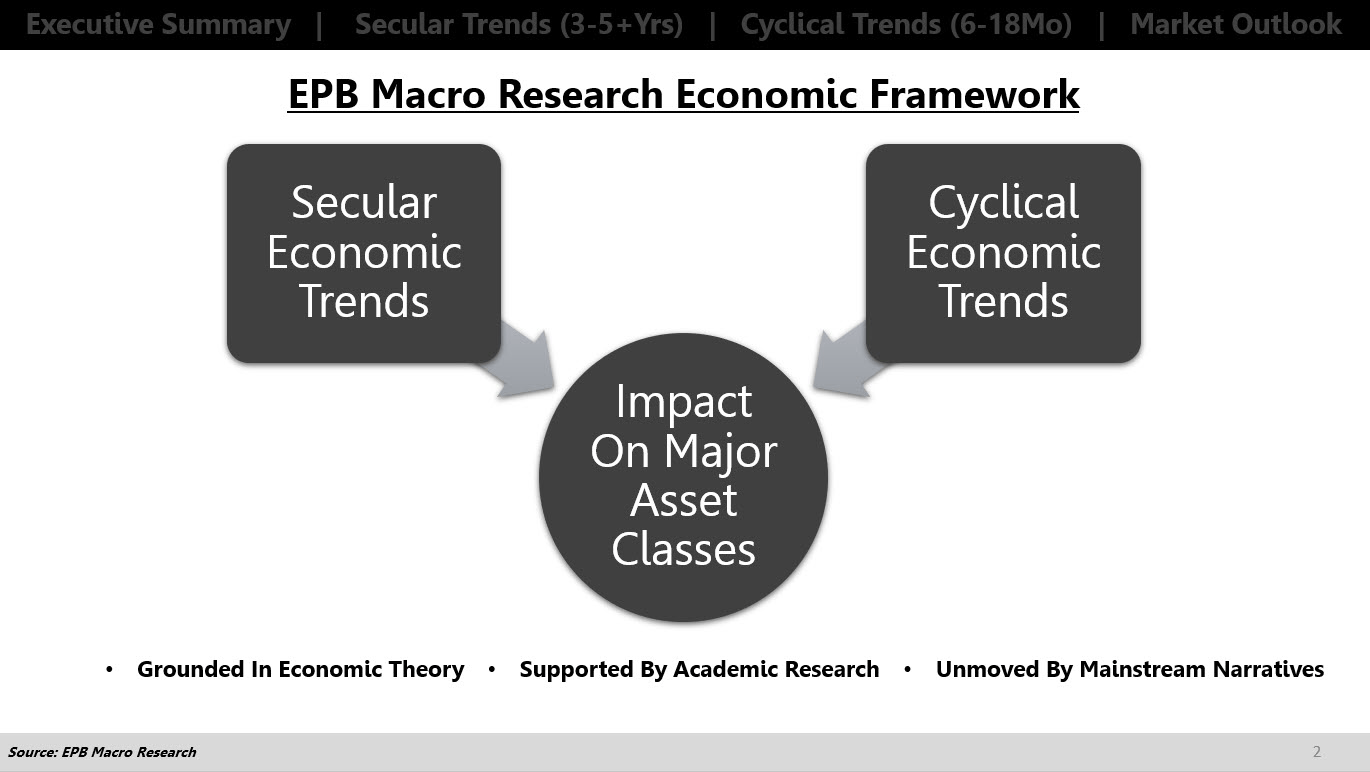
Demographics are a very long-term variable, so we’re only discussing how demographics impact secular or long-term economic trends. Demographics are not predictive over the short-run and shouldn’t be used when discussing the one-year or even two-year view.
When we look out over five years, the famous saying is that demographics is destiny.
Let’s dive in and understand why demographics matter so much for long-term analysis and can be the most predictive variable.
To start, we have to look at total population growth. Economic growth is a function of population and productivity or how many people are working times and how productive those people are.
When population growth declines or turns negative, there are fewer people, so unless you have a significant surge in productivity, economic growth is pulled down.
The 2021 census showed that population growth in the United States fell to the lowest level in more than 120 years.
Census Bureau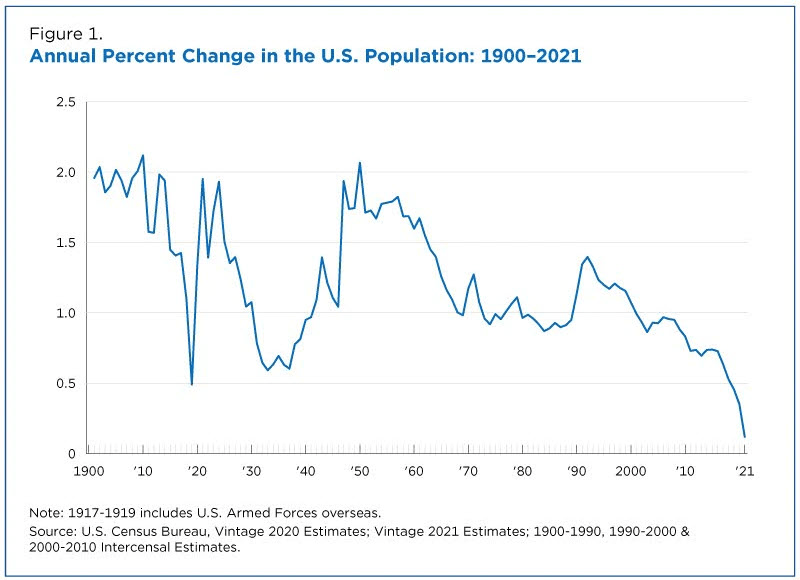
More so than total population, we really want to know the labor force growth because these people are of working age and contribute the most to economic output.
BLS, UN, EPB Macro Research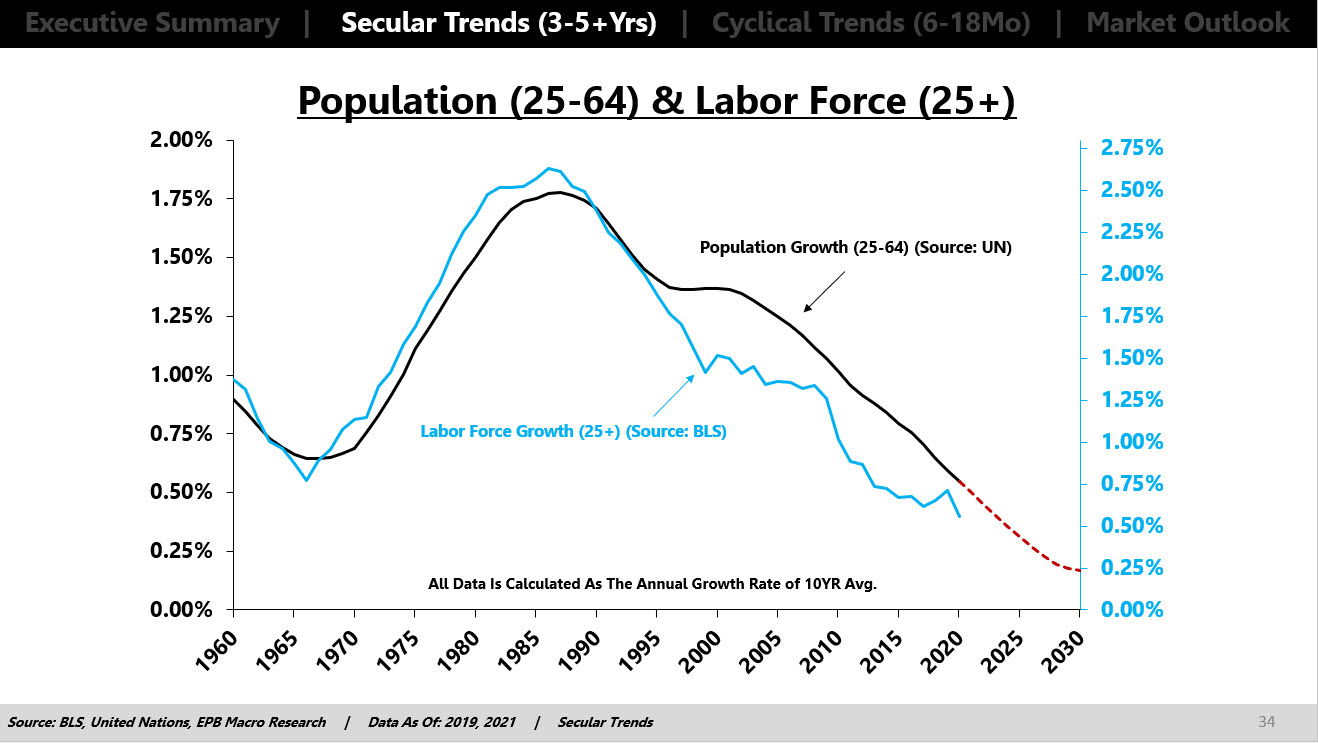
It’s not a shock that population growth and labor force growth are tied at the hip. In the United States, according to UN projections, the growth rate of the 25-64-year-old cohort, the segment that makes up the lion’s share of the labor force, is going to trend lower and close to 0% over the next decade.
If we look at the long-term or 10YR growth rate of the labor force, we can see that it’s tied to the long-term trend in nominal GDP growth. Not every quarter or every year, but over 5-10 years, the growth rate in the population and thus the growth rate in the labor force is like gravity on total economic growth.
BLS, BEA, EPB Macro Research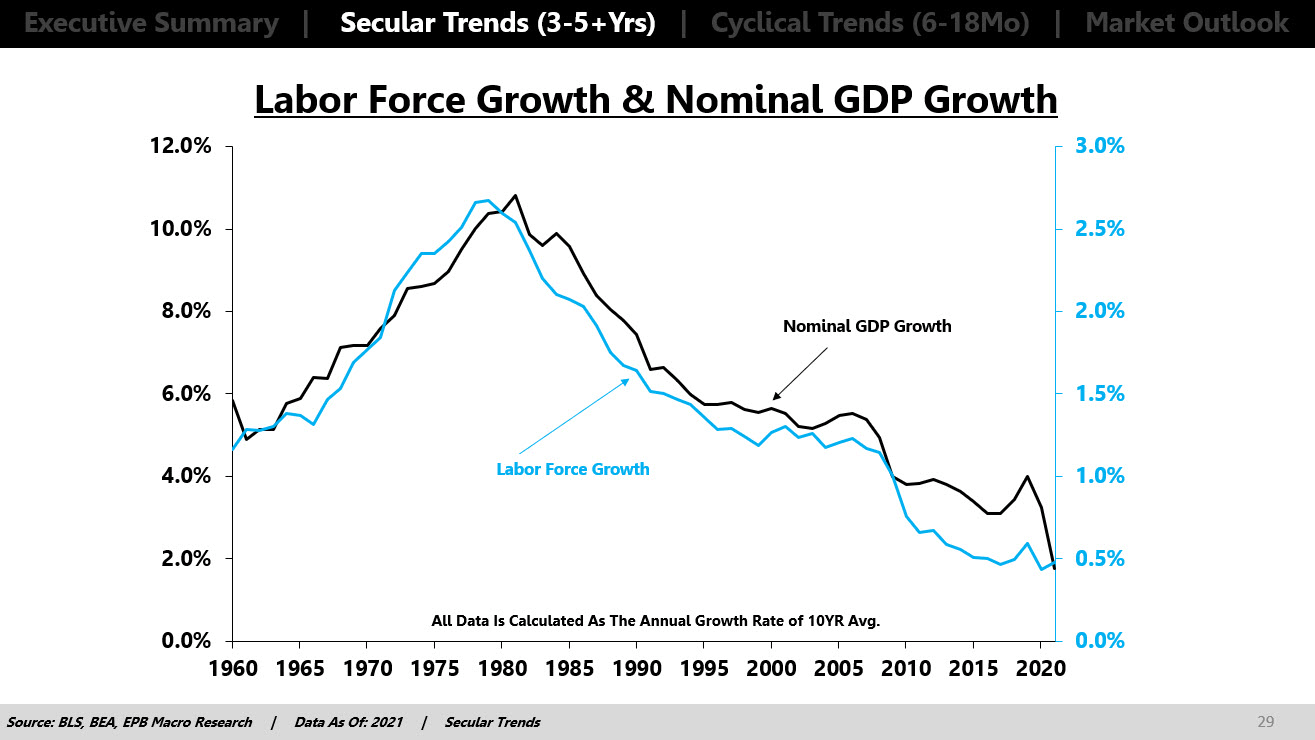
The long-term trends in labor force growth also are closely tied to long-term trends in inflation. Again, not every quarter or every year but over a decade, if population growth declines, then the labor force growth declines, and excess capacity is exposed in the economy, which pulls down the rate of inflation.
BLS, EPB Macro Research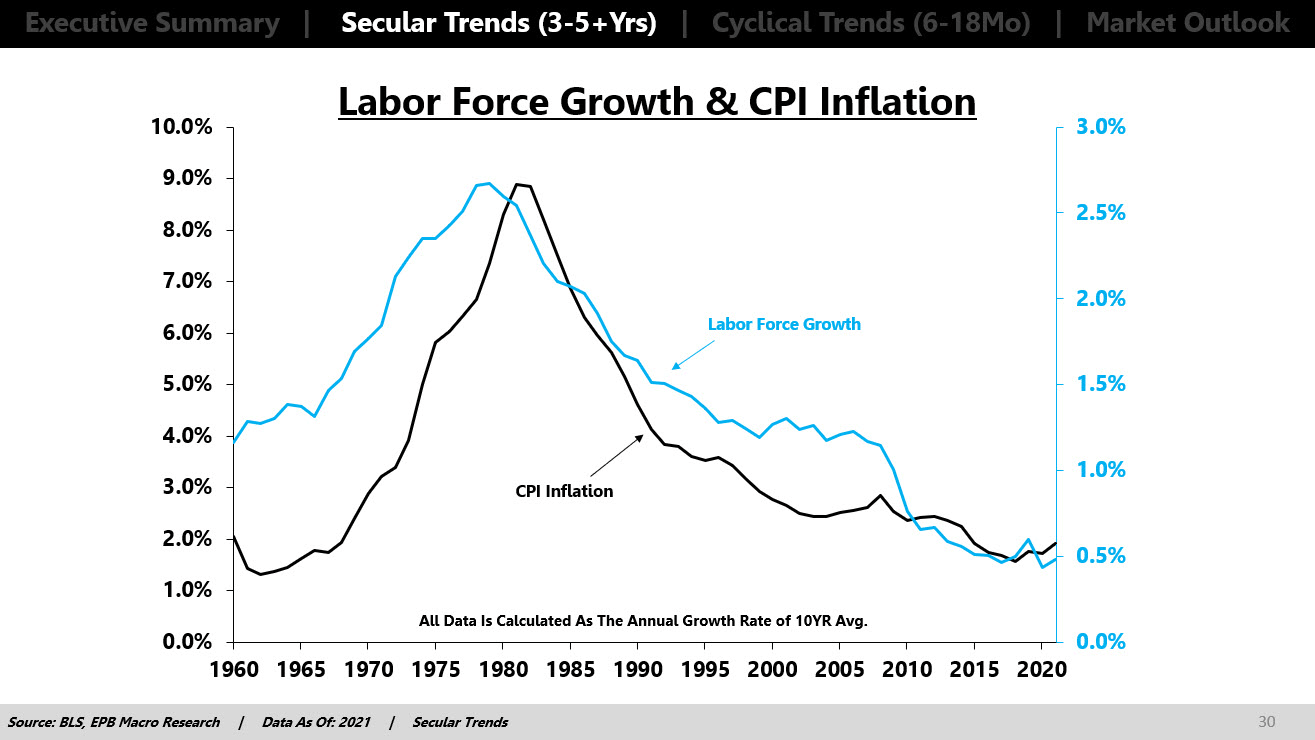
Some people think that an aging population is inflationary, but that’s a theory, as it has never been proven in any economy of the world so far.
Since the growth rate in the labor force or the working age population is tied to nominal growth, and nominal growth drives trends in interest rates then we can use long-term demographic trends to understand the future direction of interest rates.
The long-term trend in labor force growth is tied to the Fed Funds rate. If labor force growth is declining and the economy is getting weaker, then the economy needs lower interest rates. It can’t handle higher interest rates.
BLS, Federal Reserve, EPB Macro Research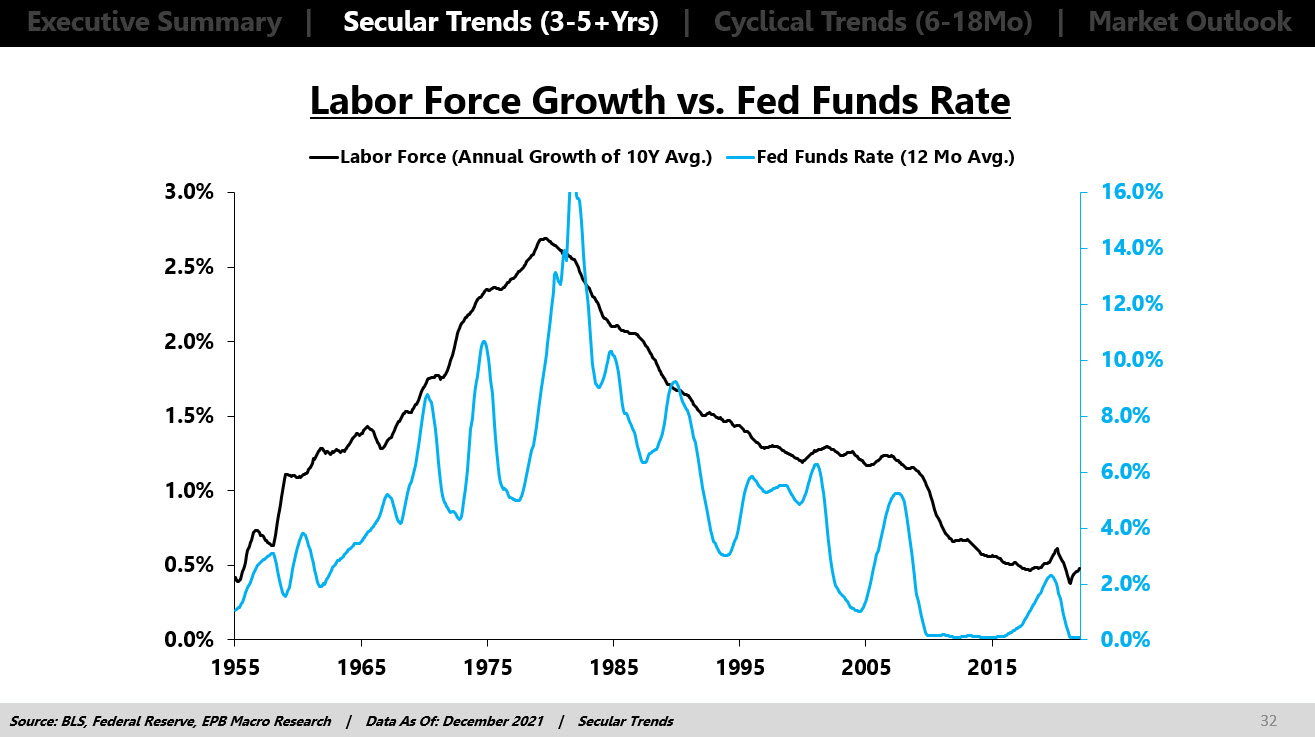
The same thing is true with long-term interest rates. We see that the long-term trend in labor force growth is tied to the trending direction of long-term interest rates, so if we know that labor force growth is going to fall in the future, then it’s going to be very hard for the economy to sustain higher interest rates.
Can interest rates go up in any given year or two years? Sure. We’ve seen that happen a handful of times since 2009, but it just can’t be sustained given the demographic gravity.
BLS, Federal Reserve, EPB Macro Research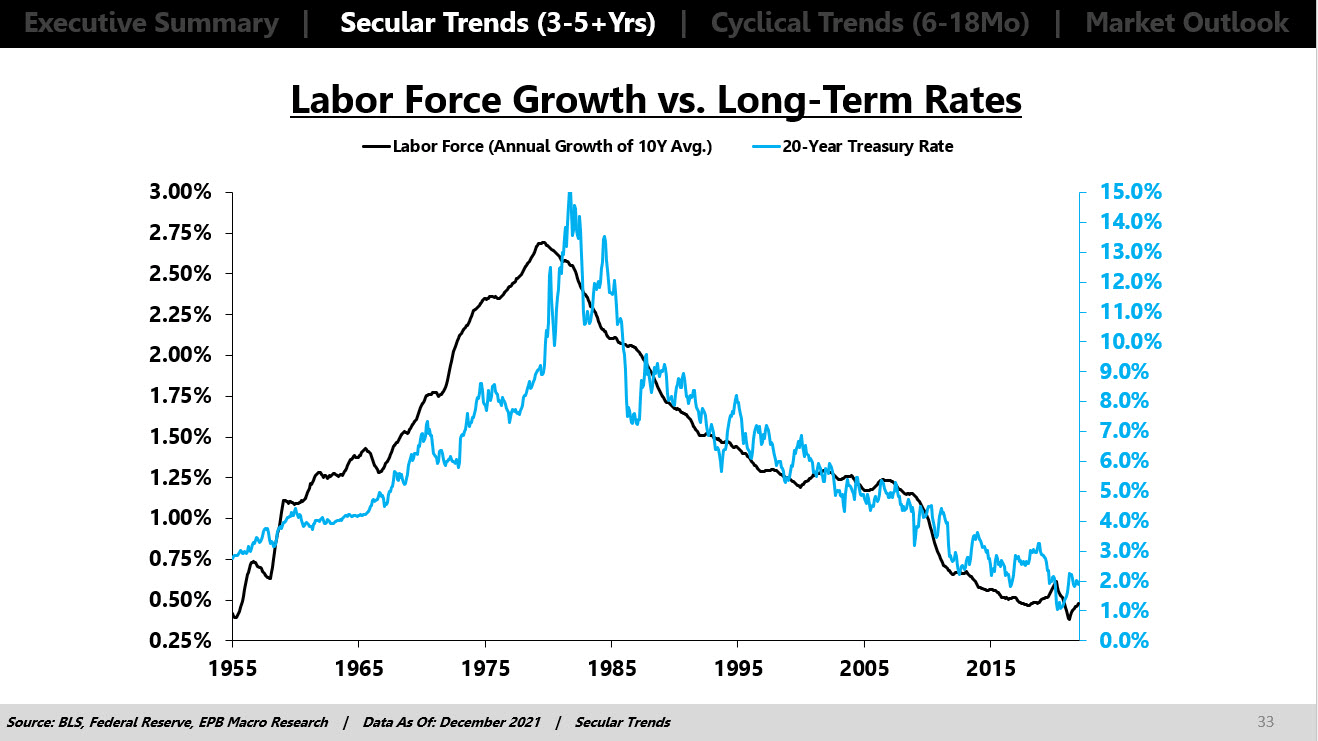
OK, so we know that the actual growth rate of the population impacts economic growth because it impacts the growth rate of the labor force, but what about the age composition?
The average rate of consumption follows a very predictable pattern based on age. From 25 to 54, average consumption increases, and as you age, you tend to consume less on average.
BLS, EPB Macro Research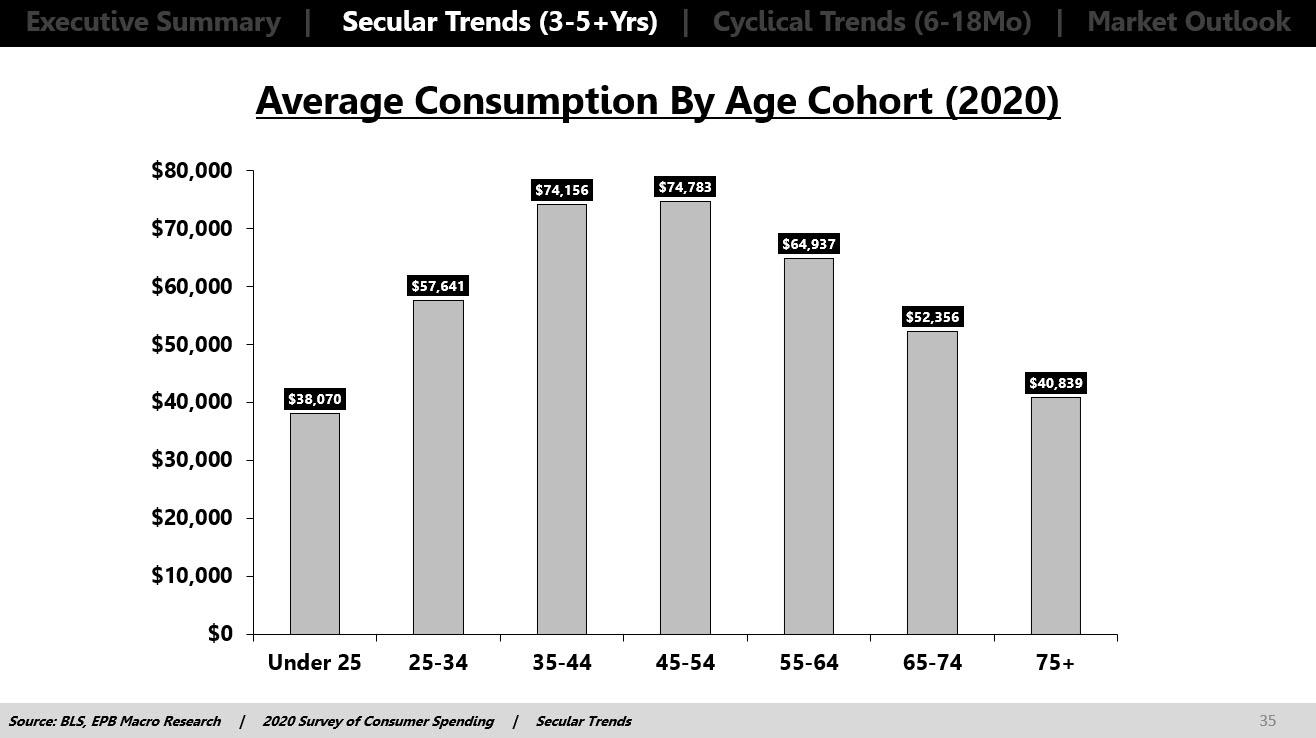
So an economy wants a super high growth rate of people aged 25-64, moving upwards in their consumption patterns. They are consuming more each year. As you age and start to consume less, the economy needs to produce less, and you need less production and less labor, which reveals excess capacity.
The US economy had vibrant growth from 1970 through the early 2000s for several reasons, but a major reason is that the best cohort for growth, the 25- to 64-year olds, were becoming a larger and larger share of the population. The US had more people moving upward in their consumption patterns than people moving down.
UN, EPB Macro Research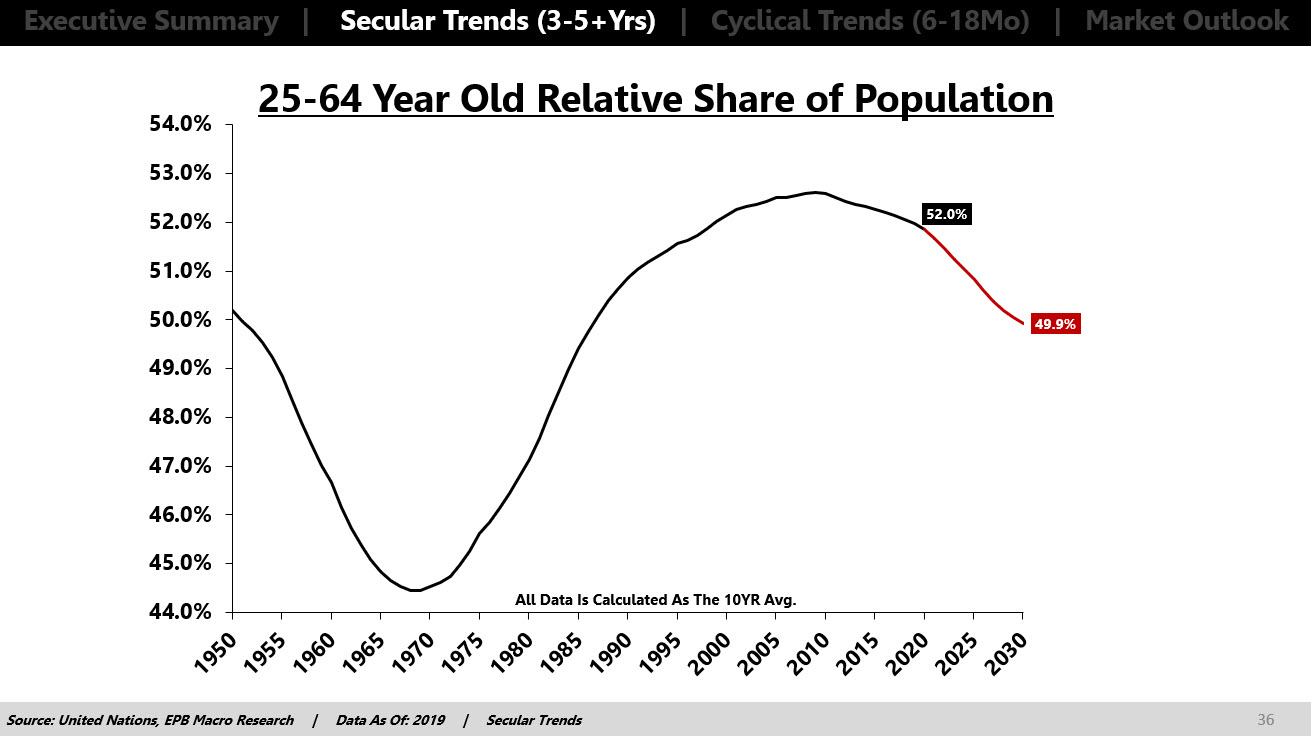
After the mid-2000s, this ratio flipped, and the share of this high consumption cohort started to decline, so more people were moving down the backside of the consumption curve. This is one primary reason why the post-financial crisis period had very weak economic growth.
Even more importantly, housing and durable goods or housing and vehicle consumption are the engines of economic growth, and this consumption peaks even earlier in the 35-44-year-old bracket.
BLS, EPB Macro Research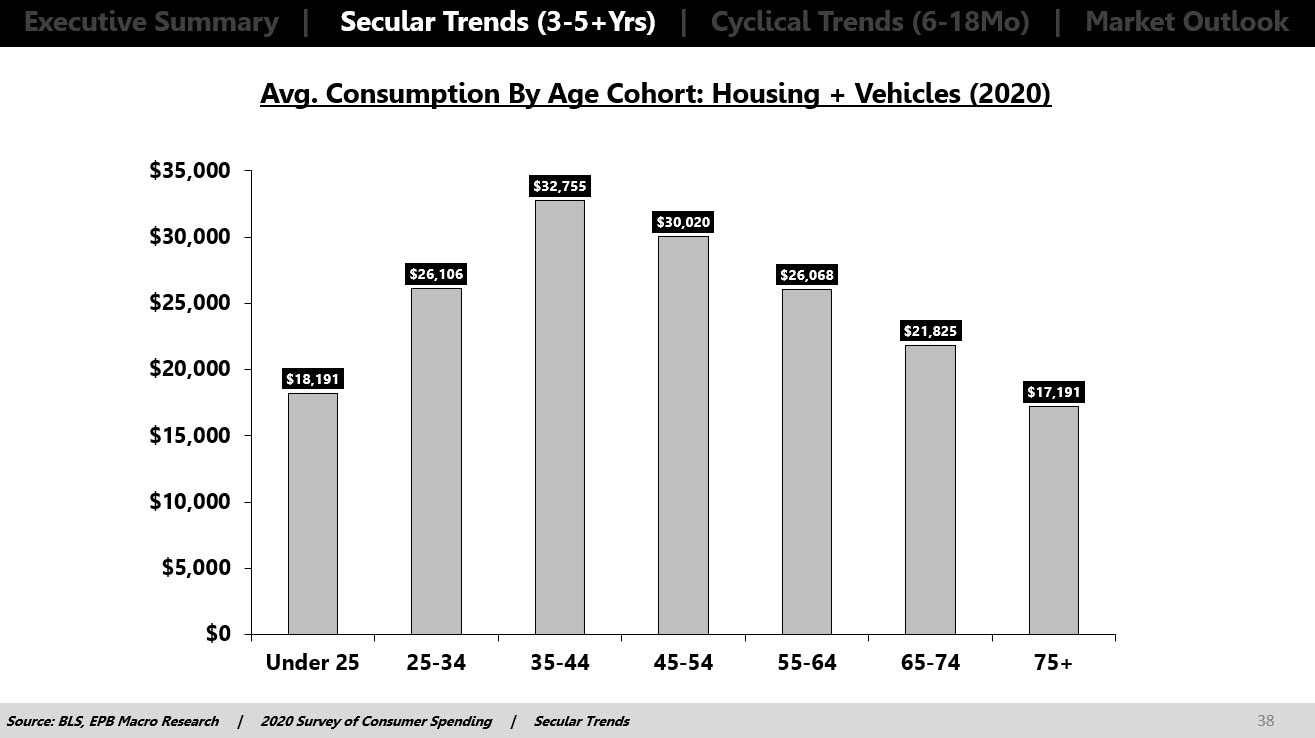
So an economy really wants a massive growth rate in the 25 to 44 or even the 25-54-year-old bracket.
While the growth rate of the 25-54-year-old cohort is positive in the US, it’s dwarfed by the growth rate of the older population, so again, more people are moving down the backside of their consumption curve for these high-powered goods compared to people moving up their consumption curve.
BLS, Census Bureau, EPB Macro Research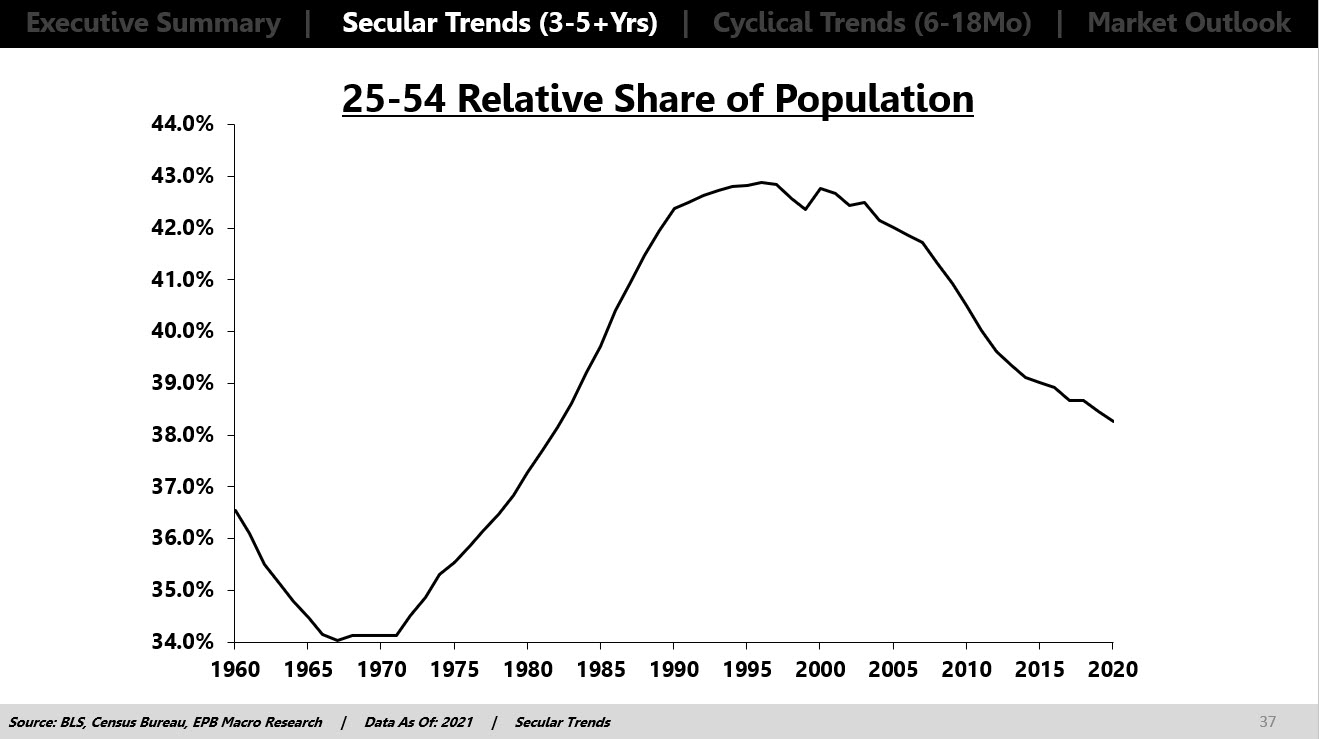
This analysis has been proven many times and demonstrated by this chart which shows that younger people are a drag on economic growth and older people are a drag on economic growth.
Arnott and Chaves (2012)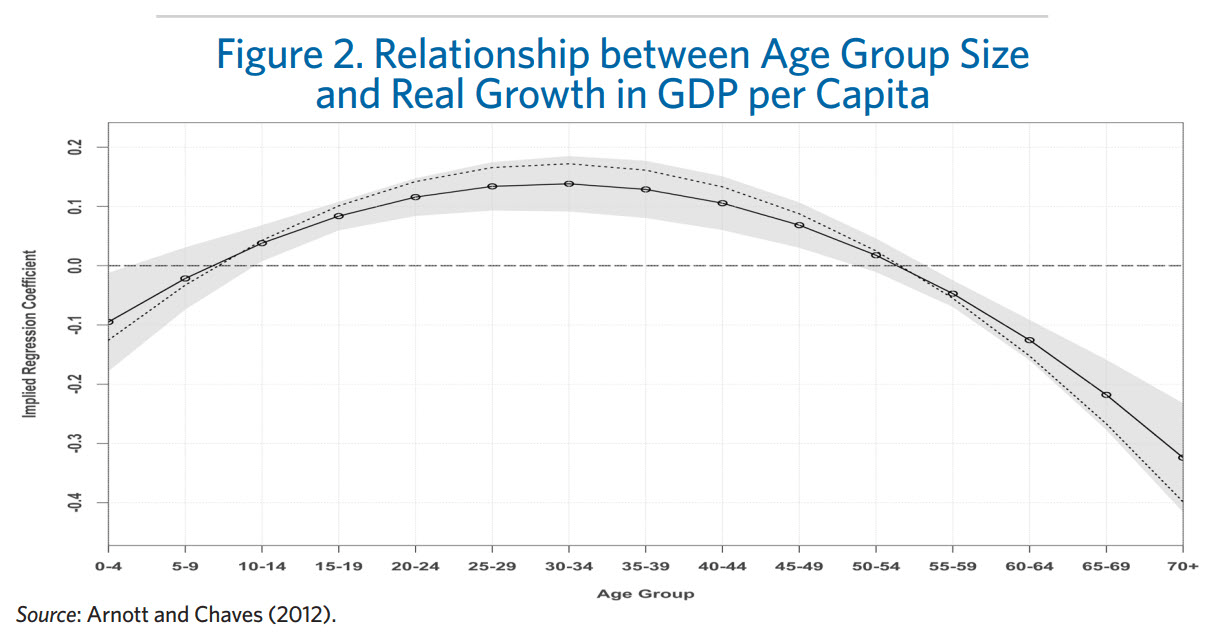
The prime-age population is the segment that drives economic activity, so if the share of population that is 25-54 is shrinking, which it is, then you’re going to have more people that are a negative force than a positive force.
This is hard for many people that say the millennials are bigger than the boomers, but the facts show that the relative share of the prime age cohort is shrinking. So yes, the millennials will be a positive force, but they will be overwhelmed by the negative pressure of the 65 and over crowd.
Also, the millennials have a lot of debt, but that’s a topic for another article.
If we look around the world, it’s not all bad news for the US because basically everywhere else is even worse off.
This chart is really informative because it highlights that once the working-age population growth flips negative, an economy is doomed.
UN, EPB Macro Research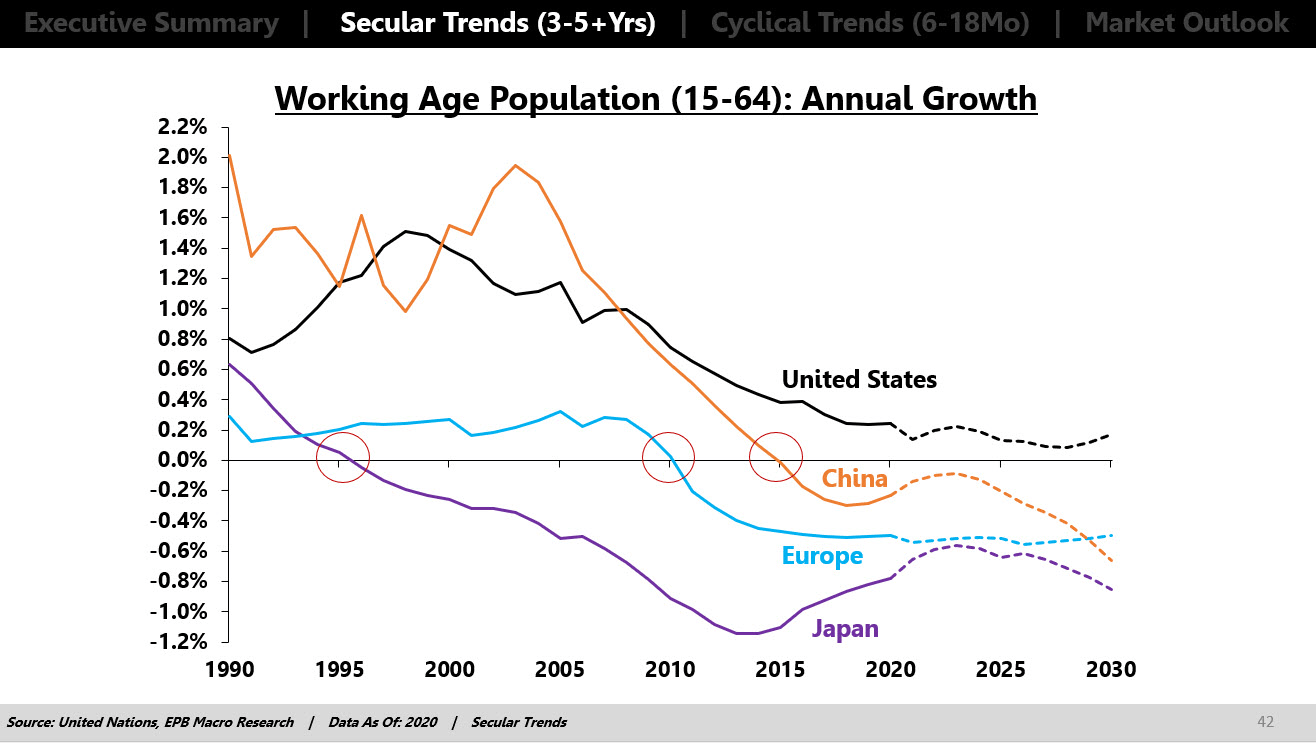
Working age population growth in Japan flipped negative in the 1990s, and they moved to negative interest rates, QE, and they have never been able to stop. The economy is too weak.
After 2009, the working-age population in Europe flipped negative, and they moved to negative rates and QE, and they haven’t been able to stop. Even now, as the US is raising rates, Europe is struggling to catch up and has already abandoned most of its tightening plans.
In 2015, China’s working-age population flipped negative, and they’ve had problems ever since. They devalued their currency in 2015 and tried one more time to inflate a property bubble, but it didn’t work, and now they’re having to manage the deflation of an asset bubble that the population cannot support.
The US is in better shape than everyone else, but we’re not looking at robust growth levels in this prime-age population.
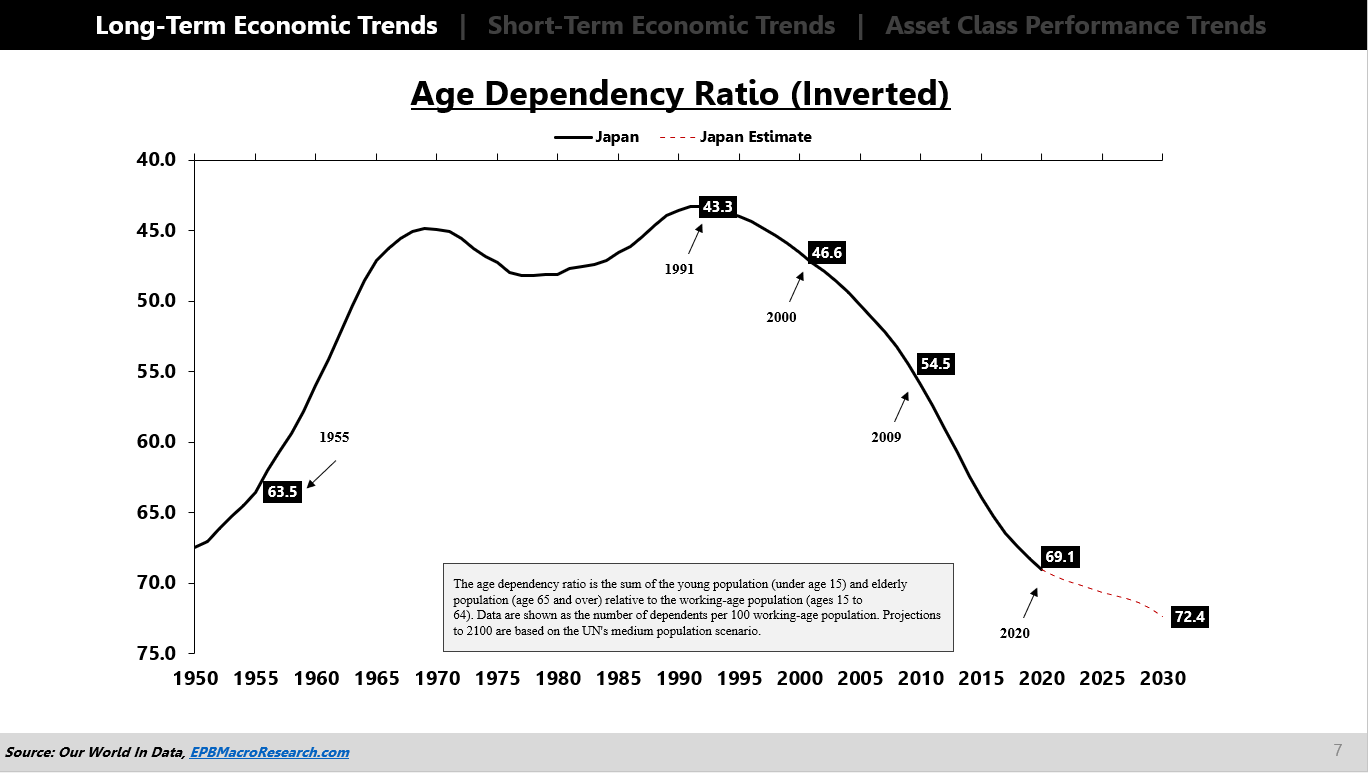
The other thing to look at in terms of demographics is called the age-dependency ratio.
The age-dependency ratio measures the ratio of young and old people relative to the working age population and is used to judge the burden placed on the working age population to support the young and old by diverging time to care for them and also resources to care for them.
Our World In Data, EPB Macro Research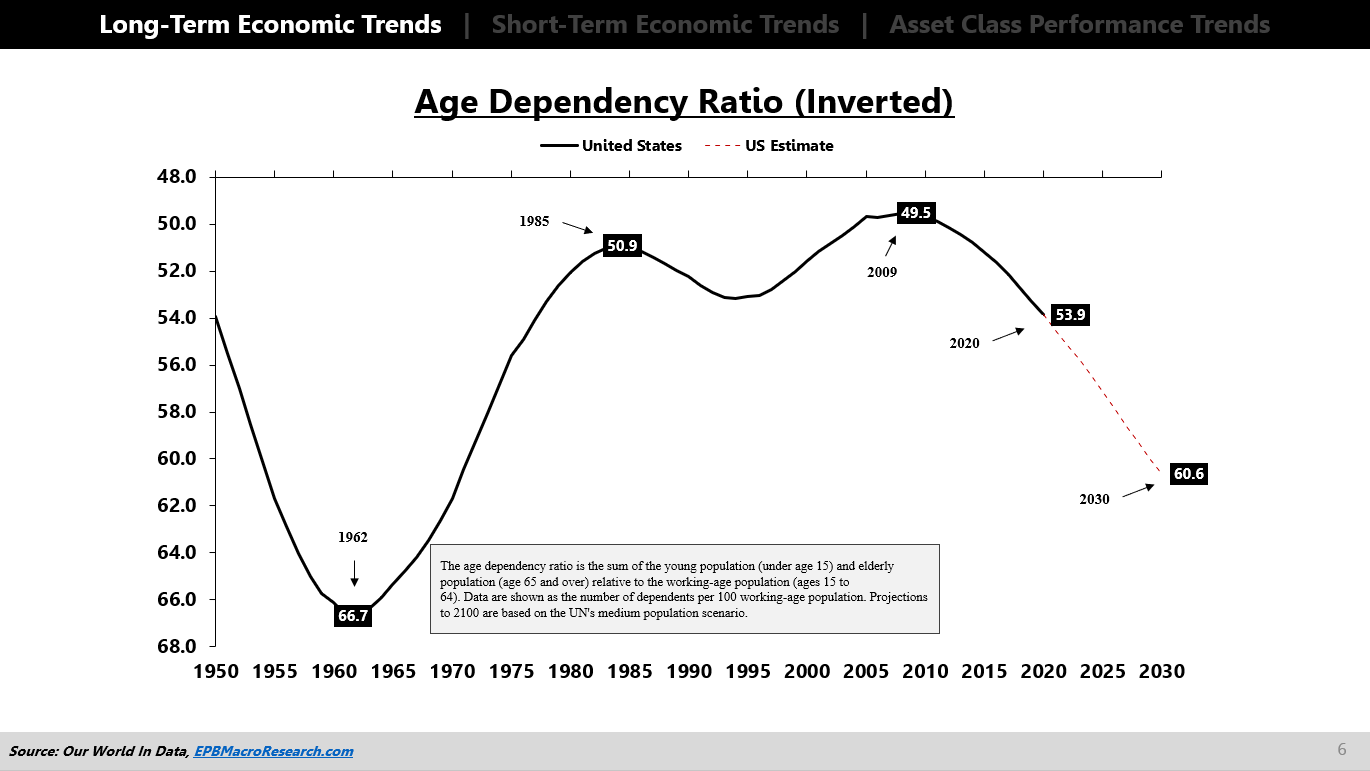
The ratio in this chart is inverted, so when the line is moving lower, the working age population has a larger burden from the young and old, and in the case of the US, Japan, China, and Europe, the burden is all from the older population.
The dependency ratio is becoming more burdensome in the US, sharply more burdensome in Europe, and off the charts in Japan.
Our World In Data, EPB Macro Research Our World In Data, EPB Macro Research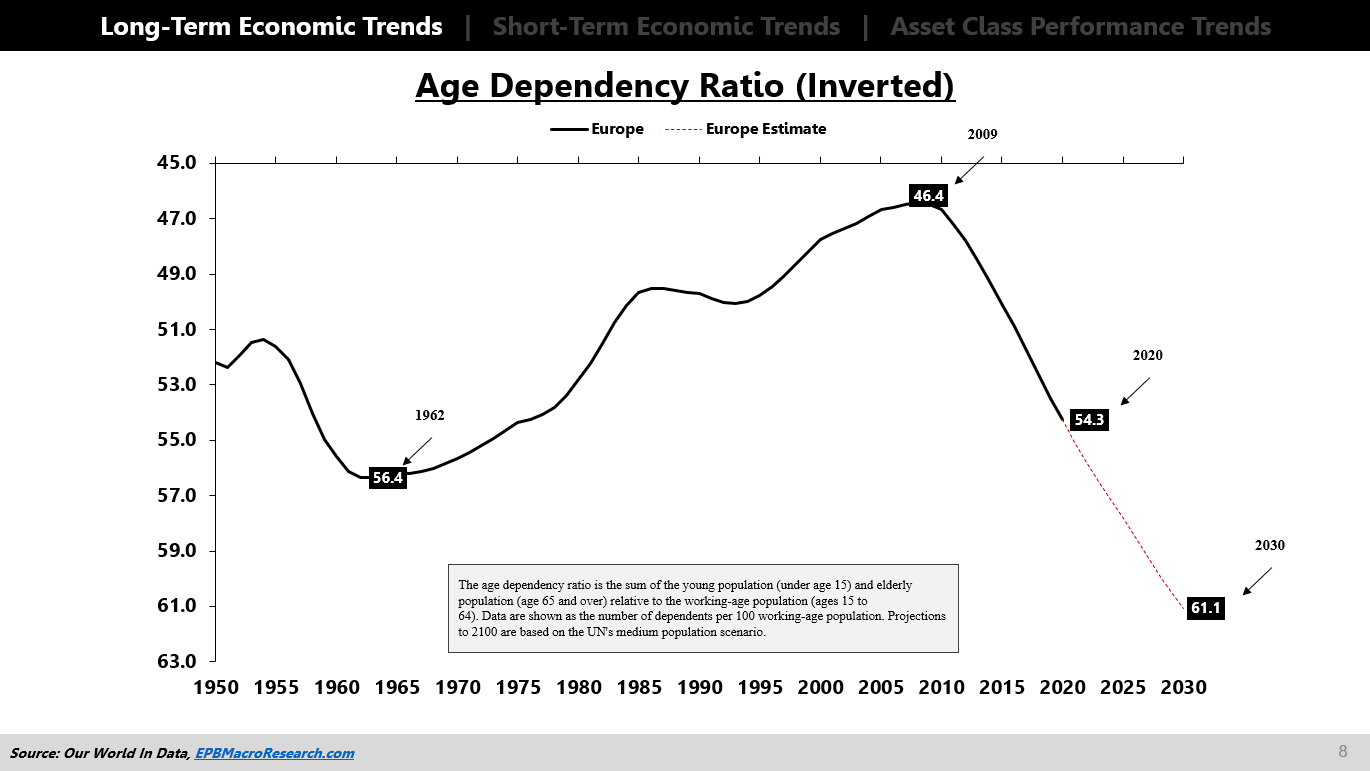
This has enormous ramifications for taxes and debt because, in modern societies, older people have forms of social security, healthcare, and pensions that all need to be supported through taxation or debt.
This drains resources from the prime-age population that needs to drive the economy. Most economies don’t want to tax the prime-age population that hard because it’s obvious that it’s bad for growth, so they have decided to use massive increases in debt to support the older population, placing the same burden on the working-age population anyway.
Federal Reserve, BEA, EPB Macro Research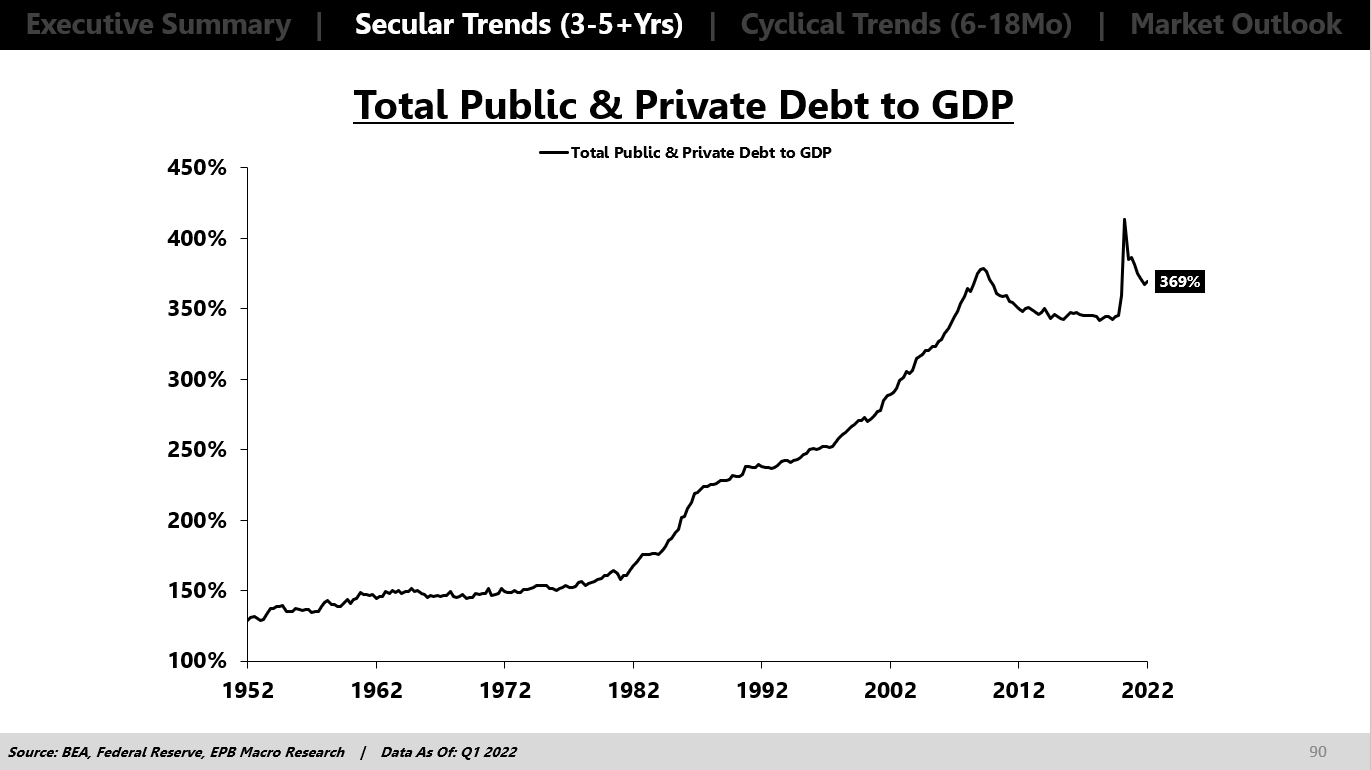
The real growth rate in most developed nations is collapsing because of those two factors, worsening demographics, and increased debt burdens.
In the US, as a result of the demographic trends I just outlined plus a rising debt burden, real GDP per capita can barely sustain 1% increases over the long run compared to 2.5% in the 60s, 70s, and 80s.
BEA, EPB Macro Research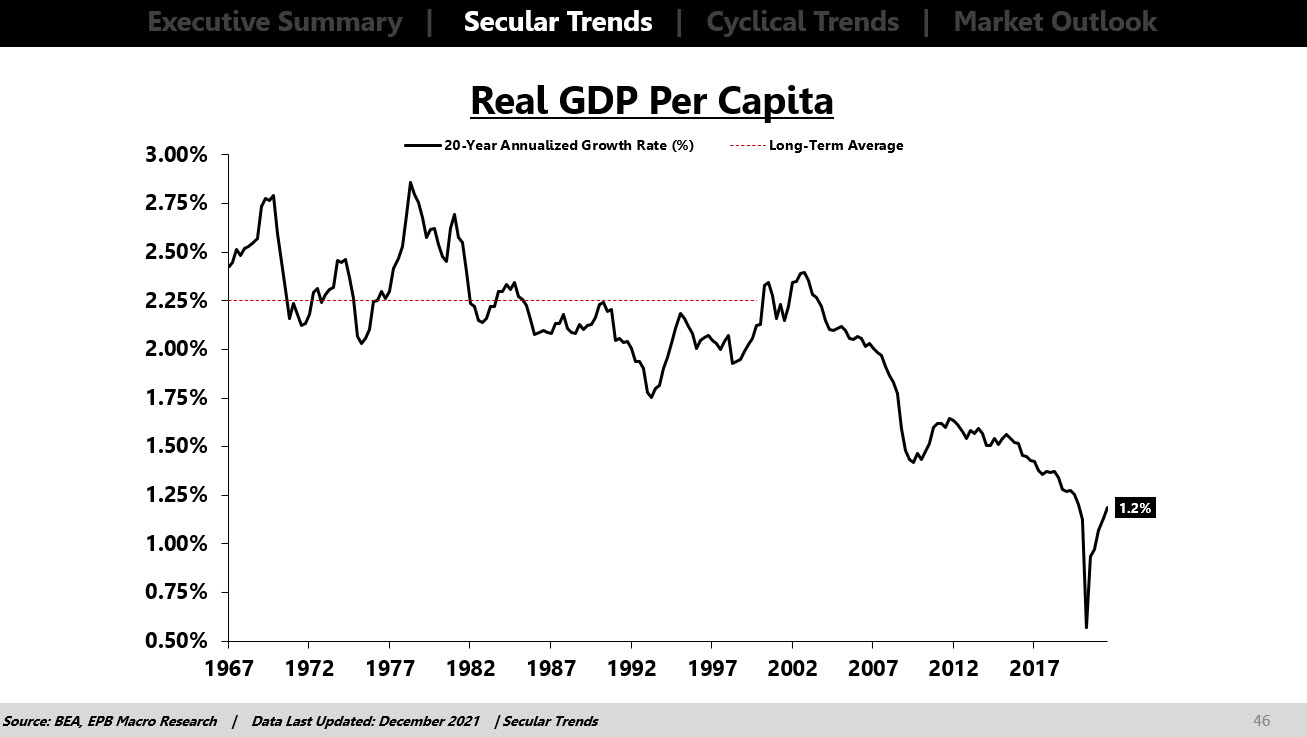
Demographics are extremely important for long-term economic analysis and impact growth, inflation, interest rates, and all other asset prices.
Lower population growth means lower labor force growth, and an older demographic means less consumption and, more importantly, less high-powered consumption, two things that really impact growth negatively.
Be the first to comment