

skynesher
Which stock investment will be smarter to own in 2023, assuming a recession is about to hit? This is an interesting question with no clear-cut answer. A pick between the two largest companies in America, both Big Tech leaders, riding the simple demographics of technology innovation and widespread adoption. You have the tech gadget giant in Apple Inc. (NASDAQ:AAPL) matched against the software and computer network infrastructure leader of Microsoft Corporation (NASDAQ:MSFT). They represent the oldest brothers of the family driving the Internet/online revolution at its core.
In this article, I will review past recession performance starting with the original Tech Bust of 2000, and take a peek at current chart trading action. Plus, a look at basic fundamental operating results and changes over the last five years highlights just how closely related the two have become.
I have Hold ratings on both names right now. Waiting for lower prices to buy new shares is my current suggestion. Nevertheless, selling either, especially if you have substantial taxable gains, may not be the wisest long-term decision.
Company Logos – Author Created
Recession History
In general, Apple has performed somewhat better than Microsoft for investment returns during 2022’s Tech 2.0 Bust. It beat the software king during the sharp, but temporary, 2020 pandemic dump. Despite wild price swings, it also survived the 2007-09 Great Recession best. These periods include steadily rising iPhone sales and acceptance by consumers, which have driven superb growth, no matter the economic backdrop. Warren Buffett has called the iPhone one of the stickiest products for consumer demand and pricing ever invented. However, when we look back at the 2000-03 Dotcom Bust period, when Apple was almost exclusively a personal computer seller, Microsoft was able to materially outperform.
Below, I review total returns over each recession span, while comparing the two companies to overall market performance in the large-cap technology peer Invesco NASDAQ 100 ETF (QQQ), mega-cap SDPR Dow Industrial ETF (DIA), and a variety of small companies in the iShares Russell 2000 ETF (IWM).
2022
YCharts – 2022 Tech Bust Performance for Apple/Microsoft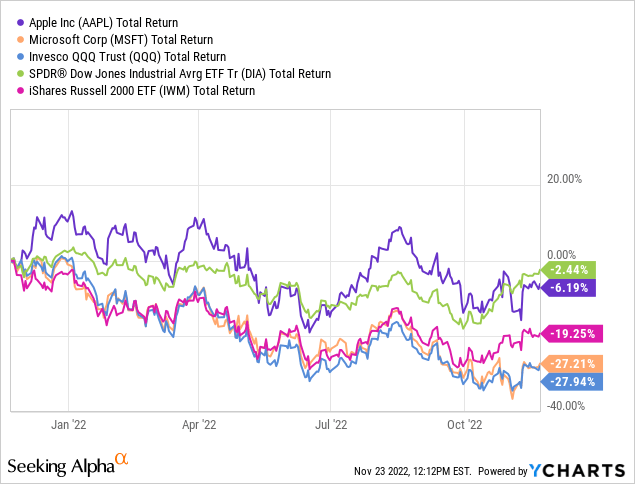
2019-2020
YCharts – 2020 Pandemic Recession Performance for Apple/Microsoft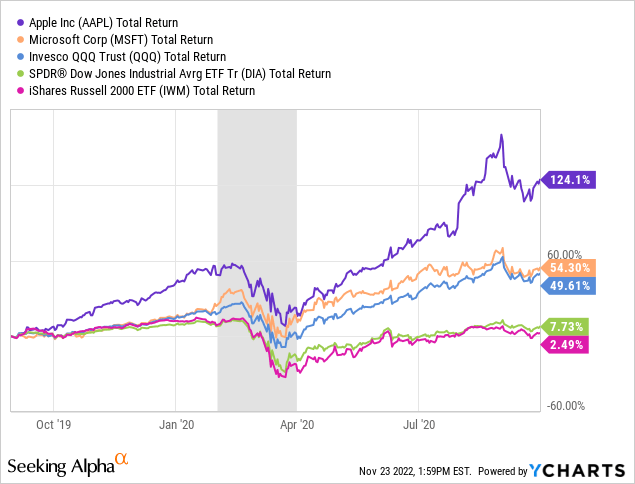
2007-2009
YCharts – 2007 to 2009 Great Recession Performance for Apple/Microsoft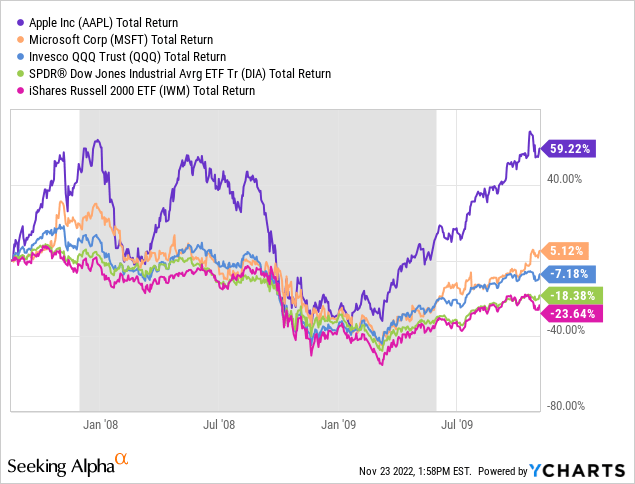
2000-2003
YCharts – 2000 to 2002 Tech Bust and Recession Performance for Apple/Microsoft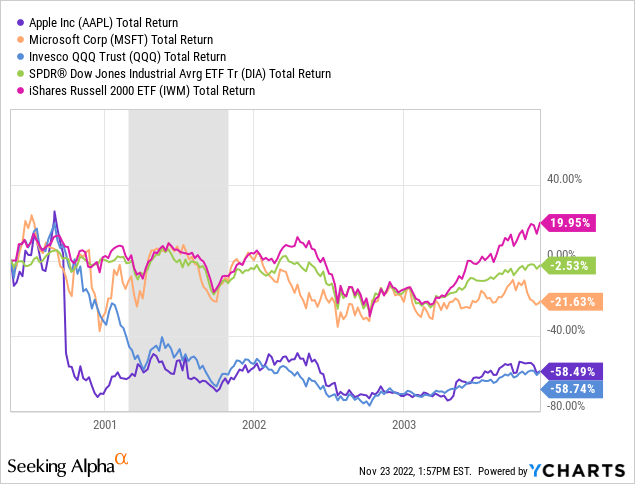
Current Technical Story
The good news is both Apple and Microsoft have been the top performers in the Big Tech area of Wall Street over the last 12 months. The mega-cap highflyers have almost uniformly crashed and burned during the major Federal Reserve tightening cycle to combat inflation that is racing to a 40-year record increase. Below is a chart of the largest 10 U.S. companies by publicly-traded market capitalization. Also notice, diversified, cash-heavy, and defensive conglomerate Berkshire Hathaway (BRK.A, BRK.B) has been the only gainer, with America’s biggest bank, JPMorgan Chase (JPM) losing moderately for investors during the rough 2022 bear selloff.
YCharts – Top 10 U.S. Mega-Caps Performance, Since November 2021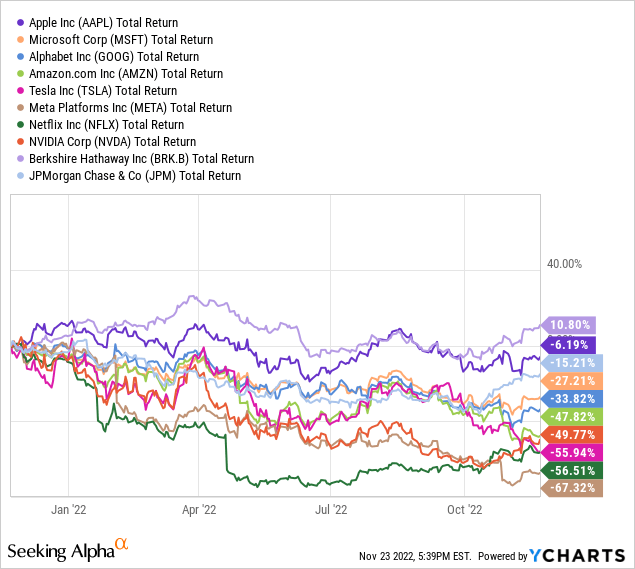
In essence, Apple and Microsoft have been “the” defensive picks to own in Big Tech, witnessing no serious downturn in operations during 2022, with minor growth still expected by analysts next year. Below are 18-month charts of daily price and volume changes, alongside some of my favorite momentum indicators.
StockCharts.com – Apple, Daily Price and Volume Changes, 18 Months StockCharts.com – Microsoft, Daily Price and Volume Changes, 18 Months
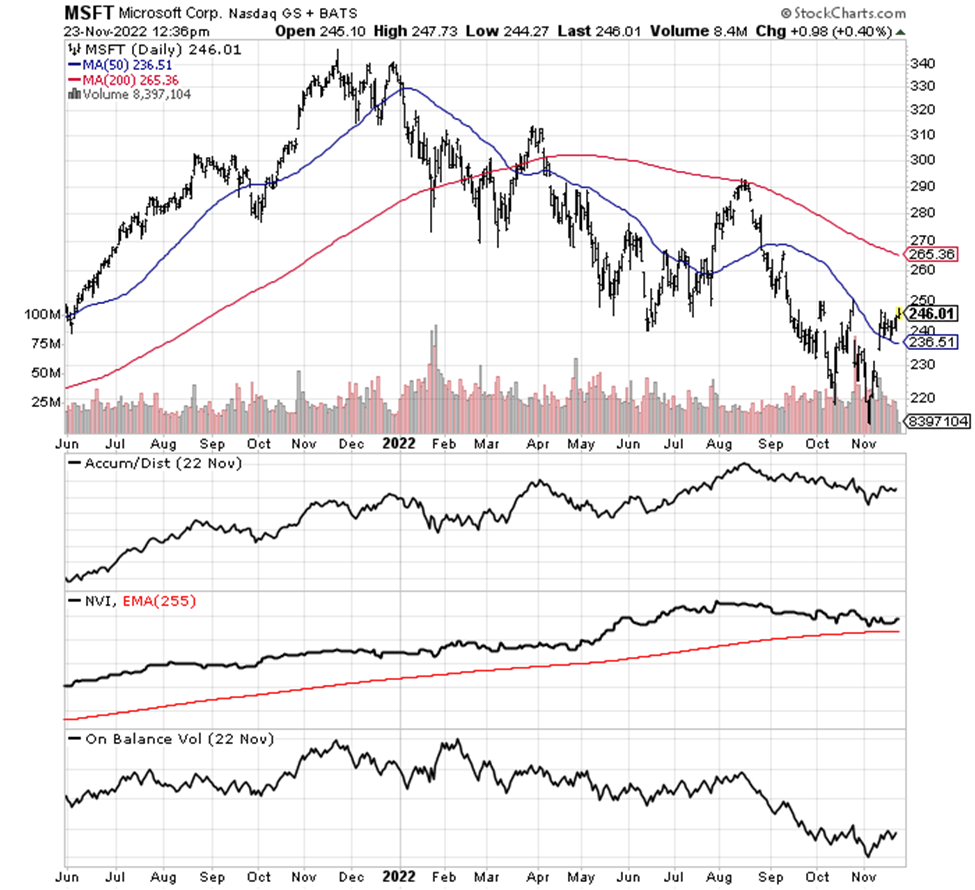
The bullish news is that trends in the Accumulation/Distribution Line and Negative Volume Index have remained healthy and strong. In combination, they indicate that plenty of buying interest exists each day, even on slower volume and less newsworthy sessions. Plus, relative price strength for Apple/Microsoft vs. peers and the S&P 500 Index (SP500) generally is a powerful positive development, by itself.
The bearish news is On Balance Volume has suffered, as large sell orders by institutions and insiders have overwhelmed small retail buys. Stock quotes have been falling along with the carnage in Big Tech and rise in interest rates. Honestly, it’s been hard for every large company to fight the market decline as the economy gets close to recession (measured by real GDP stagnation during the first three quarters of 2022 and the rapid inversion of the Treasury yield curve in October-November). Both stocks are trading well under their respective 200-day moving averages, with downtrends looking incomplete from my 36 years of trading experience.
Fundamentals = Only Slight Differences
What’s fascinating to me is the two companies have remarkably similar operating returns and shareholder gains over the years. Below is a chart looking at their enormous size today. Apple and Microsoft again are the two most valuable corporations traded on Wall Street, with each company worth around $2 trillion. It was just a few years ago that no company had surpassed $1 trillion in equity market capitalization (stock price multiplied by outstanding share count).
YCharts – Total Equity Capitalization, Apple/Microsoft, 5 Years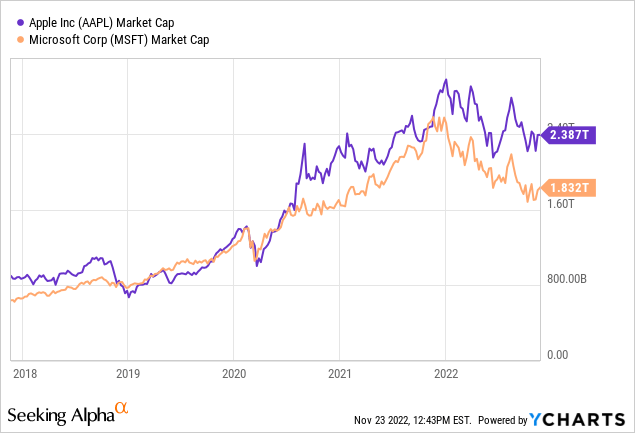
The main differences between Apple and Microsoft revolve around different gross margins and balance sheet leverage. Apple’s mostly manufacturing business is lower gross margin (43%) vs. Microsoft’s software and networking focus (68%). Despite this fact, final net income margins are not that different, with Apple at 25% and Microsoft at 34%. In comparison, S&P 500 normal profit margins are under 10%.
YCharts – Gross and Final Profit Margins, Apple/Microsoft, 5 Years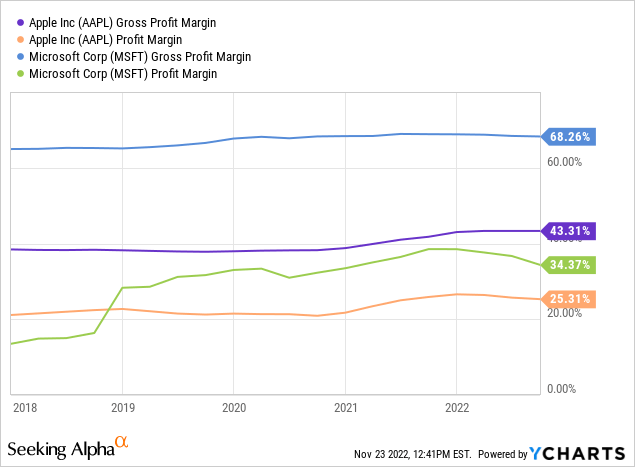
In addition, manufacturing operations usually require more capital spending and debt leverage. Warren Buffett’s major ownership position may also explain Apple’s heightened use of leverage. He has encouraged the same at prior high-margin company investments like the Washington Post and The Coca-Cola Company (KO) over the decades. In the end, Microsoft has been reluctant to expend its cash, with falling leverage evident over the last five years.
YCharts – Debt and Total Liabilities to Assets, Apple/Microsoft, 5 Years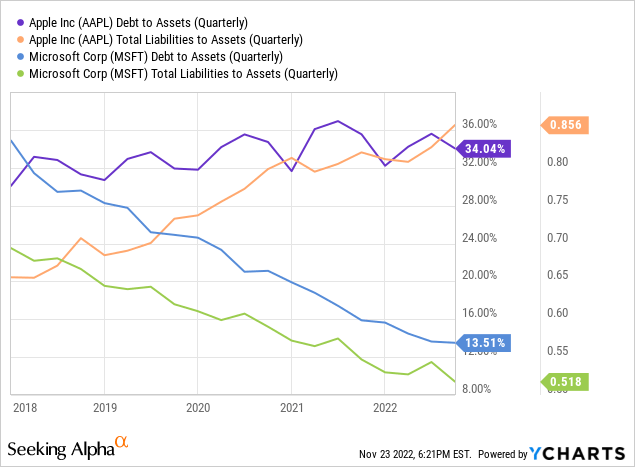
Neither is expected to grow EPS rapidly in 2023, pictured below. Analyst estimates do rise more significantly for Microsoft after next year. I personally would not count out Apple’s ability to raise prices and income after any recession ends.
YCharts – Analyst Projected EPS Growth Rates, Apple/Microsoft, November 23rd, 2022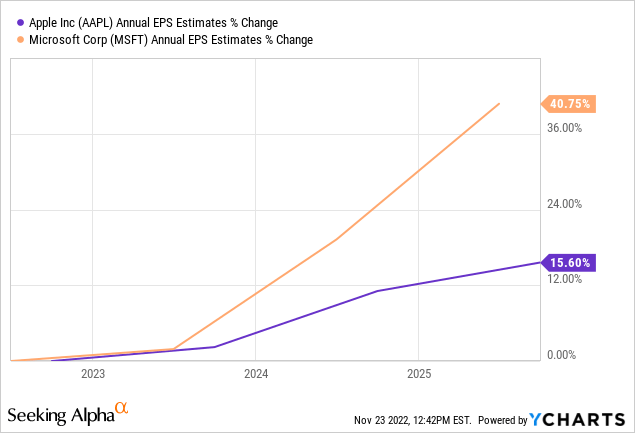
Enterprise valuations including debt and cash are actually not radically different than five years ago. The EV to Revenue ratio comparison highlights Apple as cheaper (6.2x vs. 8.7x), but this valuation is a function of lower margins and growth prospects currently.
YCharts – EV to Trailing Annual Revenues, Apple/Microsoft, 5 Years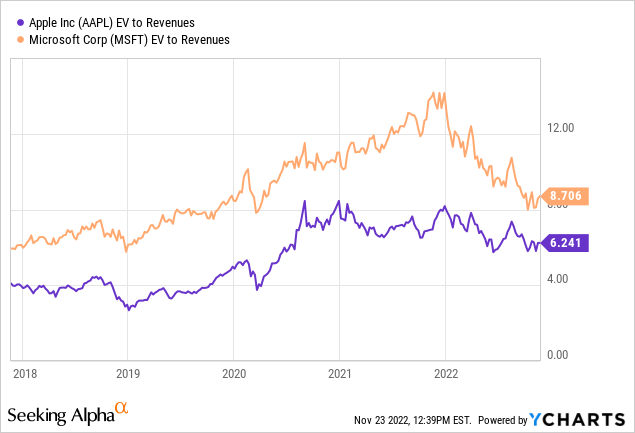
EV to EBITDA ratios, however, are nearly identical. Numbers around 18x are high vs. the overall U.S. stock market average well under 14x. Yet, investors are getting quality, defensive, diversified, brand-name, mild-growth choices in Apple and Microsoft during a looming recession. In other words, premium multiples on fundamental operations should be worth the price of admission.
YCharts – EV to Trailing Annual EBITDA, Apple/Microsoft, 5 Years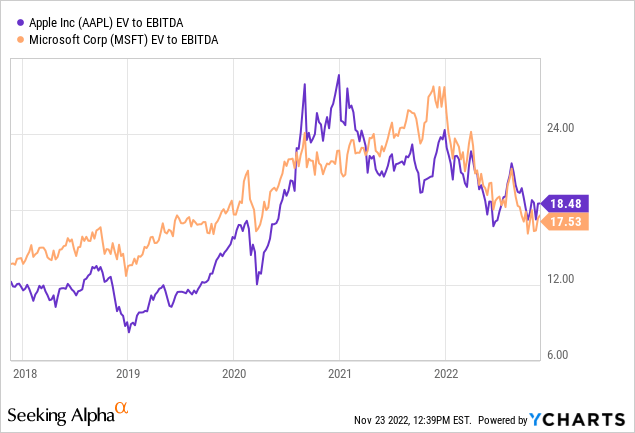
Final Thoughts
My view is the U.S. stock market may be teetering on the edge of one last major drawdown, perhaps as it becomes apparent in early 2023 that an actual recession has begun. An acknowledgement by investors of lower corporate profits and spiraling fears of the unknown in a recession could tank the S&P 500 by 15%-20% in price into March. Under this bearish scenario, forecasting a 10% (possibly 15%) drop in Apple and Microsoft shares makes logical sense. At that point, with P/Es approaching 20x, the two would better fit a Buy rating. Such a price to earnings level would be HALF the late-2020 bubble valuation multiples around 40x.
YCharts – Trailing and Forward P/E Ratios, Apple/Microsoft, 3 Years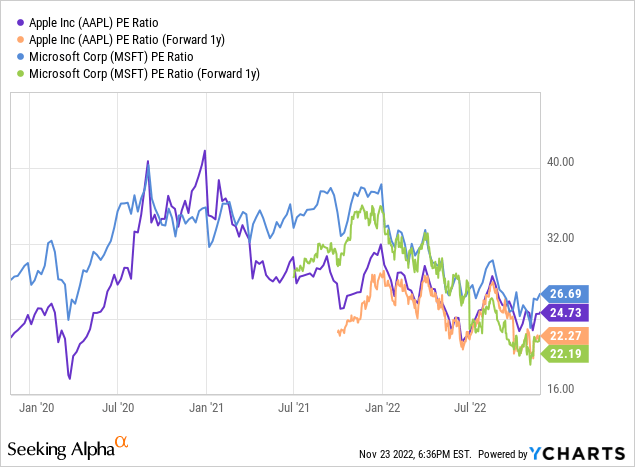
If I was forced to pick just one to own or buy in coming months, I lean in favor of Apple, based on recent past recession performance opening successful long-term buy opportunities. Of course, the choice is not that simple. Apple is more dependent on smooth relations between China and Taiwan, plus China and the U.S., as Asia is where the vast majority of product is assembled and manufactured. Without cheap, efficient, and tech-educated laborers in Asia, Apple’s business model would be far less profitable. So, COVID-19 lockdown issues in China and tensions over Taiwan’s political independence are the primary outlier risks to monitor closely (outside of declining consumer demand globally if we get a severe recession).
Microsoft’s buy argument is focused on the fundamental story. Less leverage, higher margins, and a slightly better business growth outlook are the positives. Either way, I suspect both companies should continue to “outperform” the S&P 500 over the next 12-18 months. If sharply lower corporate earnings are the immediate future, both Apple and Microsoft will serve as defensive ideas attracting elevated buy interest by active managers and investors. Net selling could pull prices down, but at a far slower pace than other equities.
For sure, outsized annual shareholder gains of 30% or even 20% are likely part of the past for each company. Their incredible size (preventing high growth) and new trends away from globalization are the reasons. Muted expectations of 5% to 10% total returns, including dividends (AAPL 0.6% cash yield vs. MSFT 1.1% currently), over the next five years is my base projection.
Throughout the nation’s history, companies reaching for 10% valuations on existing GDP output have run into real competitive problems, with the government sometimes intervening to break up anticompetitive business models. Examples of this “speed limit” for company size are found in the government’s successful effort to split Rockefeller’s Standard Oil monopoly into 33 separate companies between 1906-1911, and the failed push to break up Carnegie’s partly-owned U.S. Steel between 1911 and 1920. The original U.S. Steel amalgamation was the first U.S. company to have a market capitalization above $1 billion in 1901.
With Apple currently worth 8% of U.S. GDP output and Microsoft at 6%, “strong” shareholder gains can be argued as next to impossible, without citizen and politician calls to break up these behemoths into smaller entities more aligned with competitors. If there is any silver lining regarding large size today, it’s the fact both have substantial sales and earnings outside of the U.S.
You can argue the two are some of the main beneficiaries of the globalization trend over the last three decades, where trader barriers have been reduced and international business has been encouraged. 59% of 2021 Apple sales originated outside of North America, while Microsoft generated 51% outside the U.S. last year.
Yet, deglobalization may be the new reality going forward, after COVID-19 pandemic closures exposed the downside of just-in-time inventories supplied from manufacturers all over the world. If overseas trade declines from 2020’s peak, both Apple and Microsoft will encounter critical operating headwinds.
Growth into new business areas like Apple’s rumored push into electric vehicles by 2026, and bolt-on transactions like Microsoft’s attempted Activision Blizzard (ATVI) gaming software deal, are examples of future expansion initiatives. To reach growth rates above macroeconomic gains of 5% annually, both will need to reinvest cash flow wisely. I am confident when management teams realize outsized growth is no longer possible, huge dividend increases will be the decision to return shareholder capital. Both companies could easily support dividend yields of 3%+ on current cash and income generation.
Pulling together all the ideas, I am not overly enthused about either Apple or Microsoft as buy candidates in November 2022. However, lower quotes will bring better math for future gains. I am comfortable with a Hold/Neutral rating and some exposure to both in your portfolio. We may soon see how a recession affects business results and investor confidence.
Thanks for reading. Please consider this article a first step in your due diligence process. Consulting with a registered and experienced investment advisor is recommended before making any trade.
Be the first to comment