

choi dongsu/iStock via Getty Images
Fundamentals By Lyn Alden
In a recent post in the StockWaves room, Lyn Alden shared these salient points:
Caterpillar (NYSE:CAT) and Deere (NYSE:DE) are oft-compared stocks, but are quite different in their markets. Although they do have some overlapping/competing markets, Caterpillar primarily focuses its equipment on construction and mining while Deere primarily focuses its equipment on agriculture and landscaping. Both of them are rather fully-valued at the moment.
FastGraphs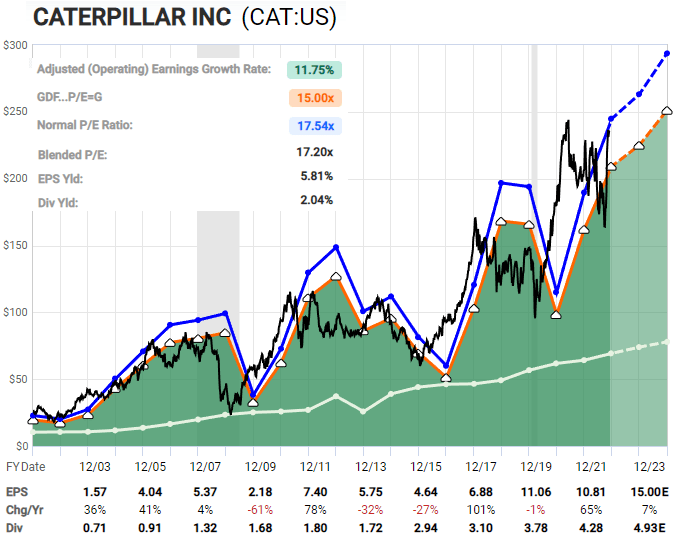
If we look at the cyclically-adjusted price/earnings ratio for both companies:
YCharts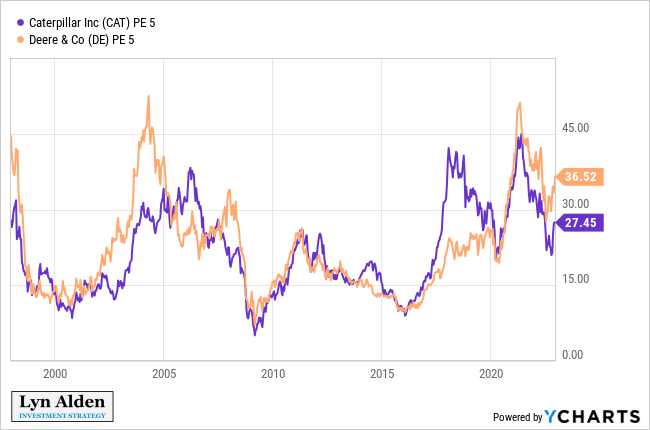
Both companies have A-rated balance sheets by Standard & Poor’s.
Overall, I’m neutral on both stocks for the moment. Neither stock is offering a particularly compelling valuation, but I think both the mining and agriculture industries have a lot of growth ahead of them in the 2020s decade, after some degree of underinvestment in the 2010s decade. Any substantial sell-offs in these stocks would interest me in considering a position.
Some Of Our Top 22 Megacap Stocks
A few weeks ago, Zac Mannes and Garrett Patten shared with our membership the following commentary and list of 22 tickers with charts that are favorable to higher highs in the coming months. Here is a portion of Garrett’s comments at that time:
Our goal for this list was a shorter list of Large-Caps that have the greatest potential to succeed in making new highs in the coming year. They are not all immediate entry setups, and a few like AMGN (recently shared with the readership here) are already at new highs, but they have strong Elliott Wave counts allowing for continued strength. It is important to stress again that there is not a uniform look and they are not all at good points for new entries. Many have room for a little higher, but then should see some consolidation, and for most those consolidations must hold the recent Oct lows.
Furthermore, there are some spots in the market that are looking particularly precarious and where the risk of contagion is high. While these all make strong cases for ‘needing‘ new highs, if the market cannot hold support on the next consolidation and starts to break down these will likely get dragged down with everything else. Risk management and stop use are paramount. Hope is not an investment strategy. We discuss key support and pattern invalidation levels for a reason, limiting losses can have a bigger impact on long-term performance then even the hottest picks.
AMGN, CAT and DE are three of those tickers. We will continue to share some more examples of these charts in future articles. For now, let’s delve a bit deeper into the two charts that are the focus of this piece.
The Technical View
Those reading our articles and reviewing our work will notice that we do indeed pay close attention to fundamentals. In fact, our main philosophy in the StockWaves methodology is that it is ‘where fundamentals meet technicals to find high-probability setups’ for both trading and investing.
What’s more, the markets are fractal in nature and they exhibit self-similarity at all degrees. You will notice in the charts attached below that these structures of price repeat from the shorter time intervals to the longer ones.
What this means for our members is that traders with a short time frame view can benefit greatly from the guidance provided in the analysis. And, investors can also see the context of the greater time frames and how that affects their decisions regarding entries and exits.
MotiveWave MotiveWave MotiveWave MotiveWave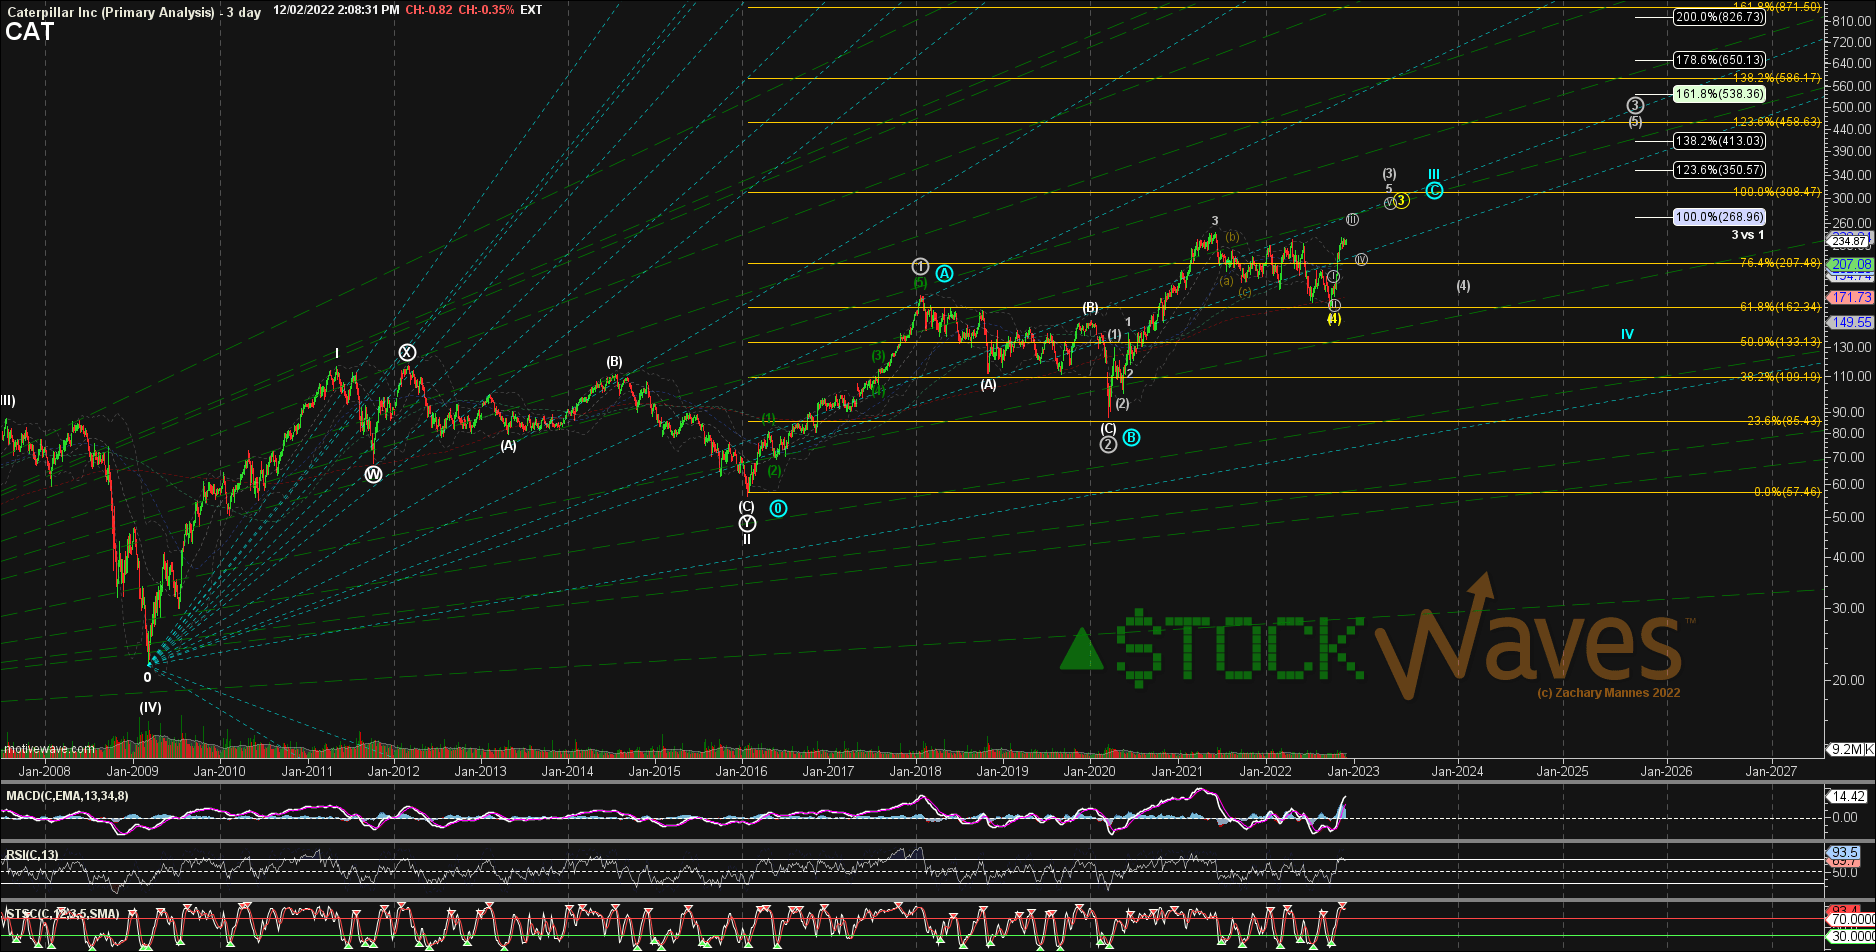
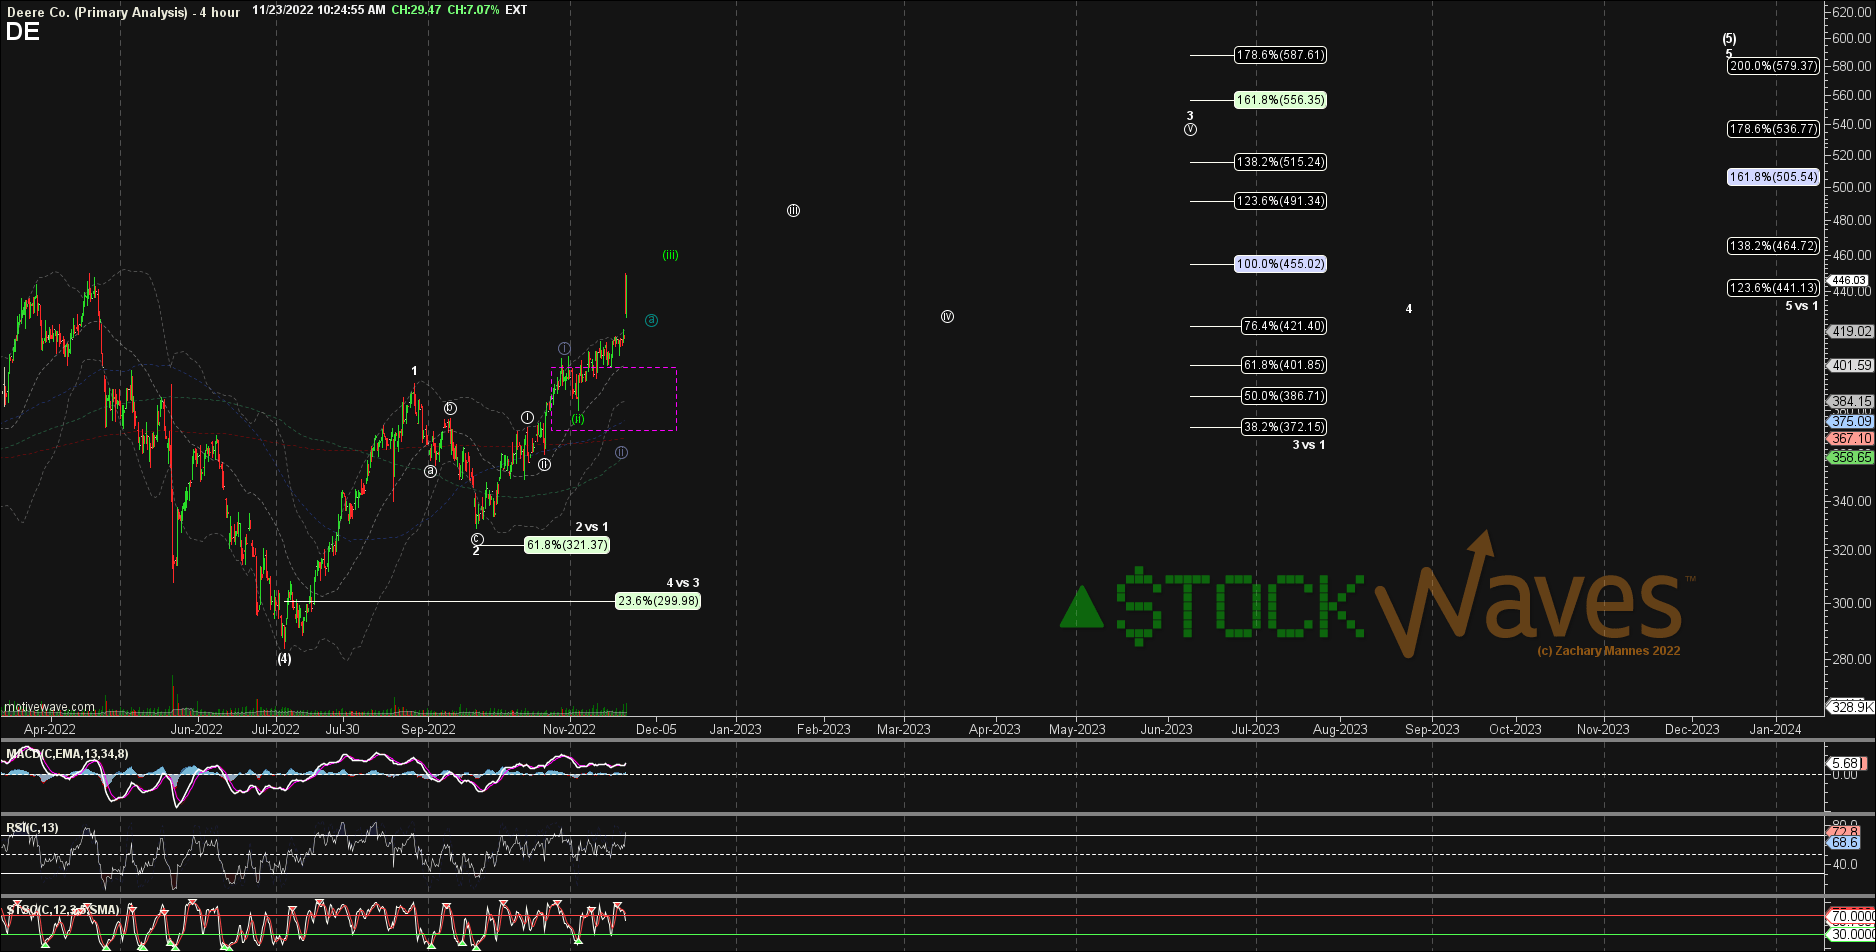
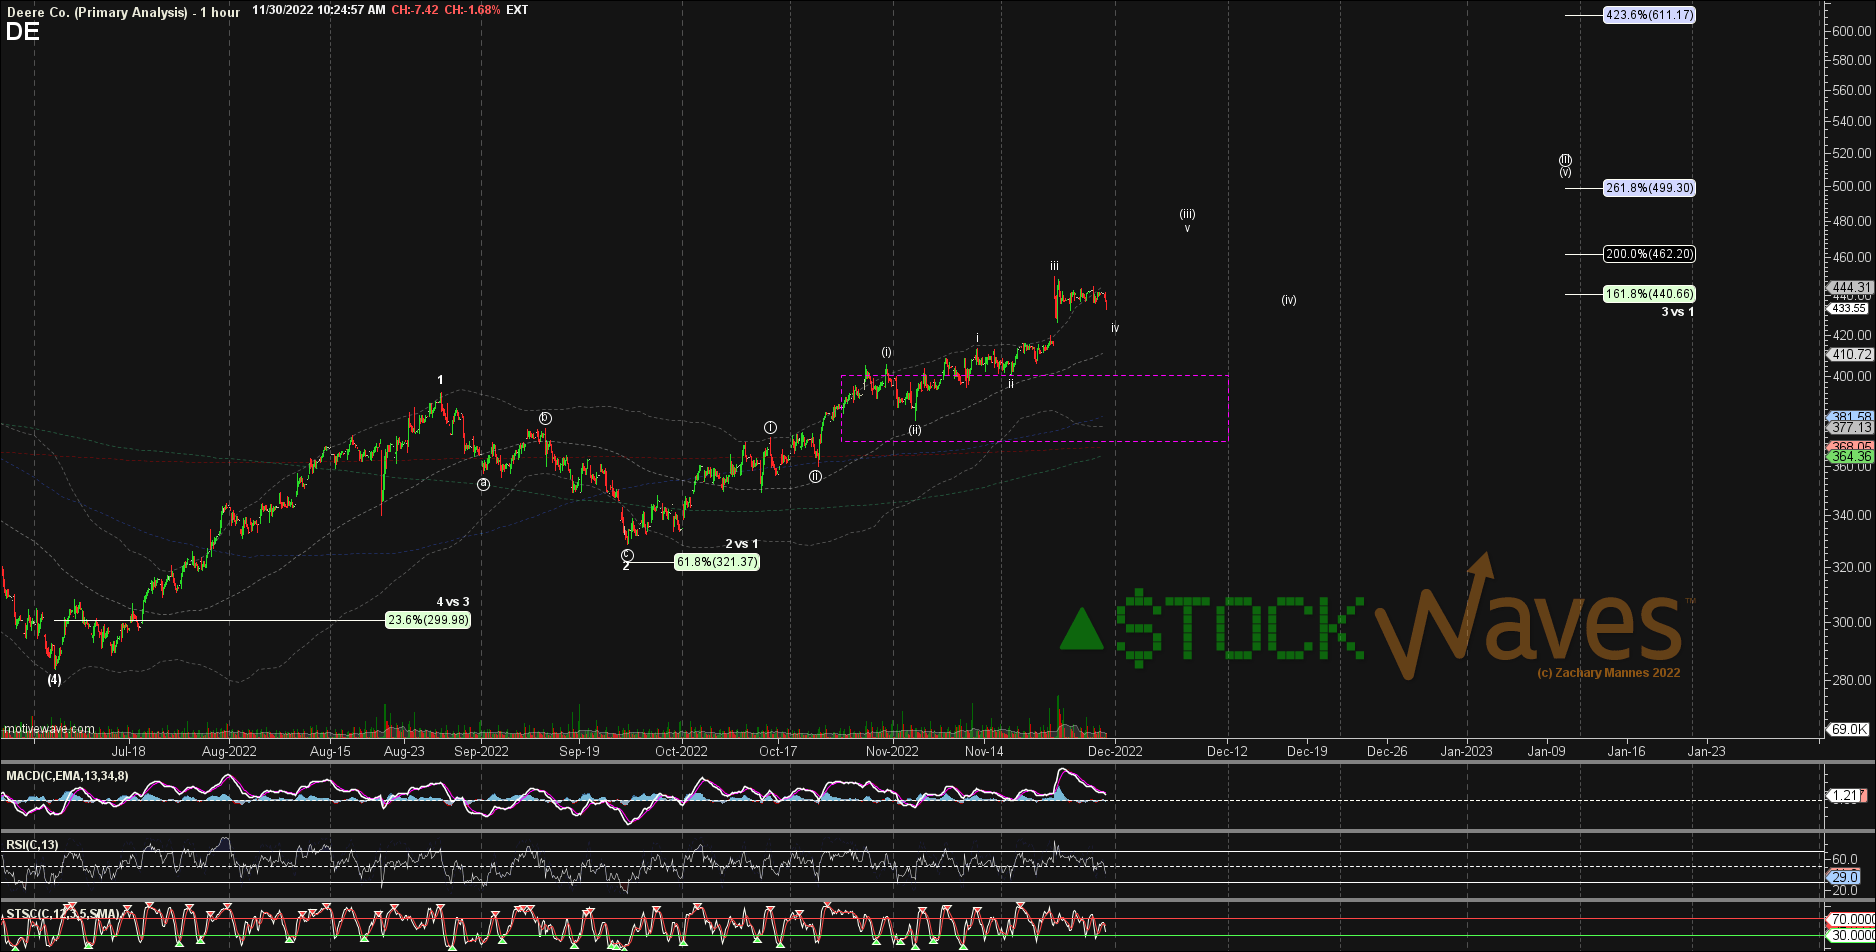
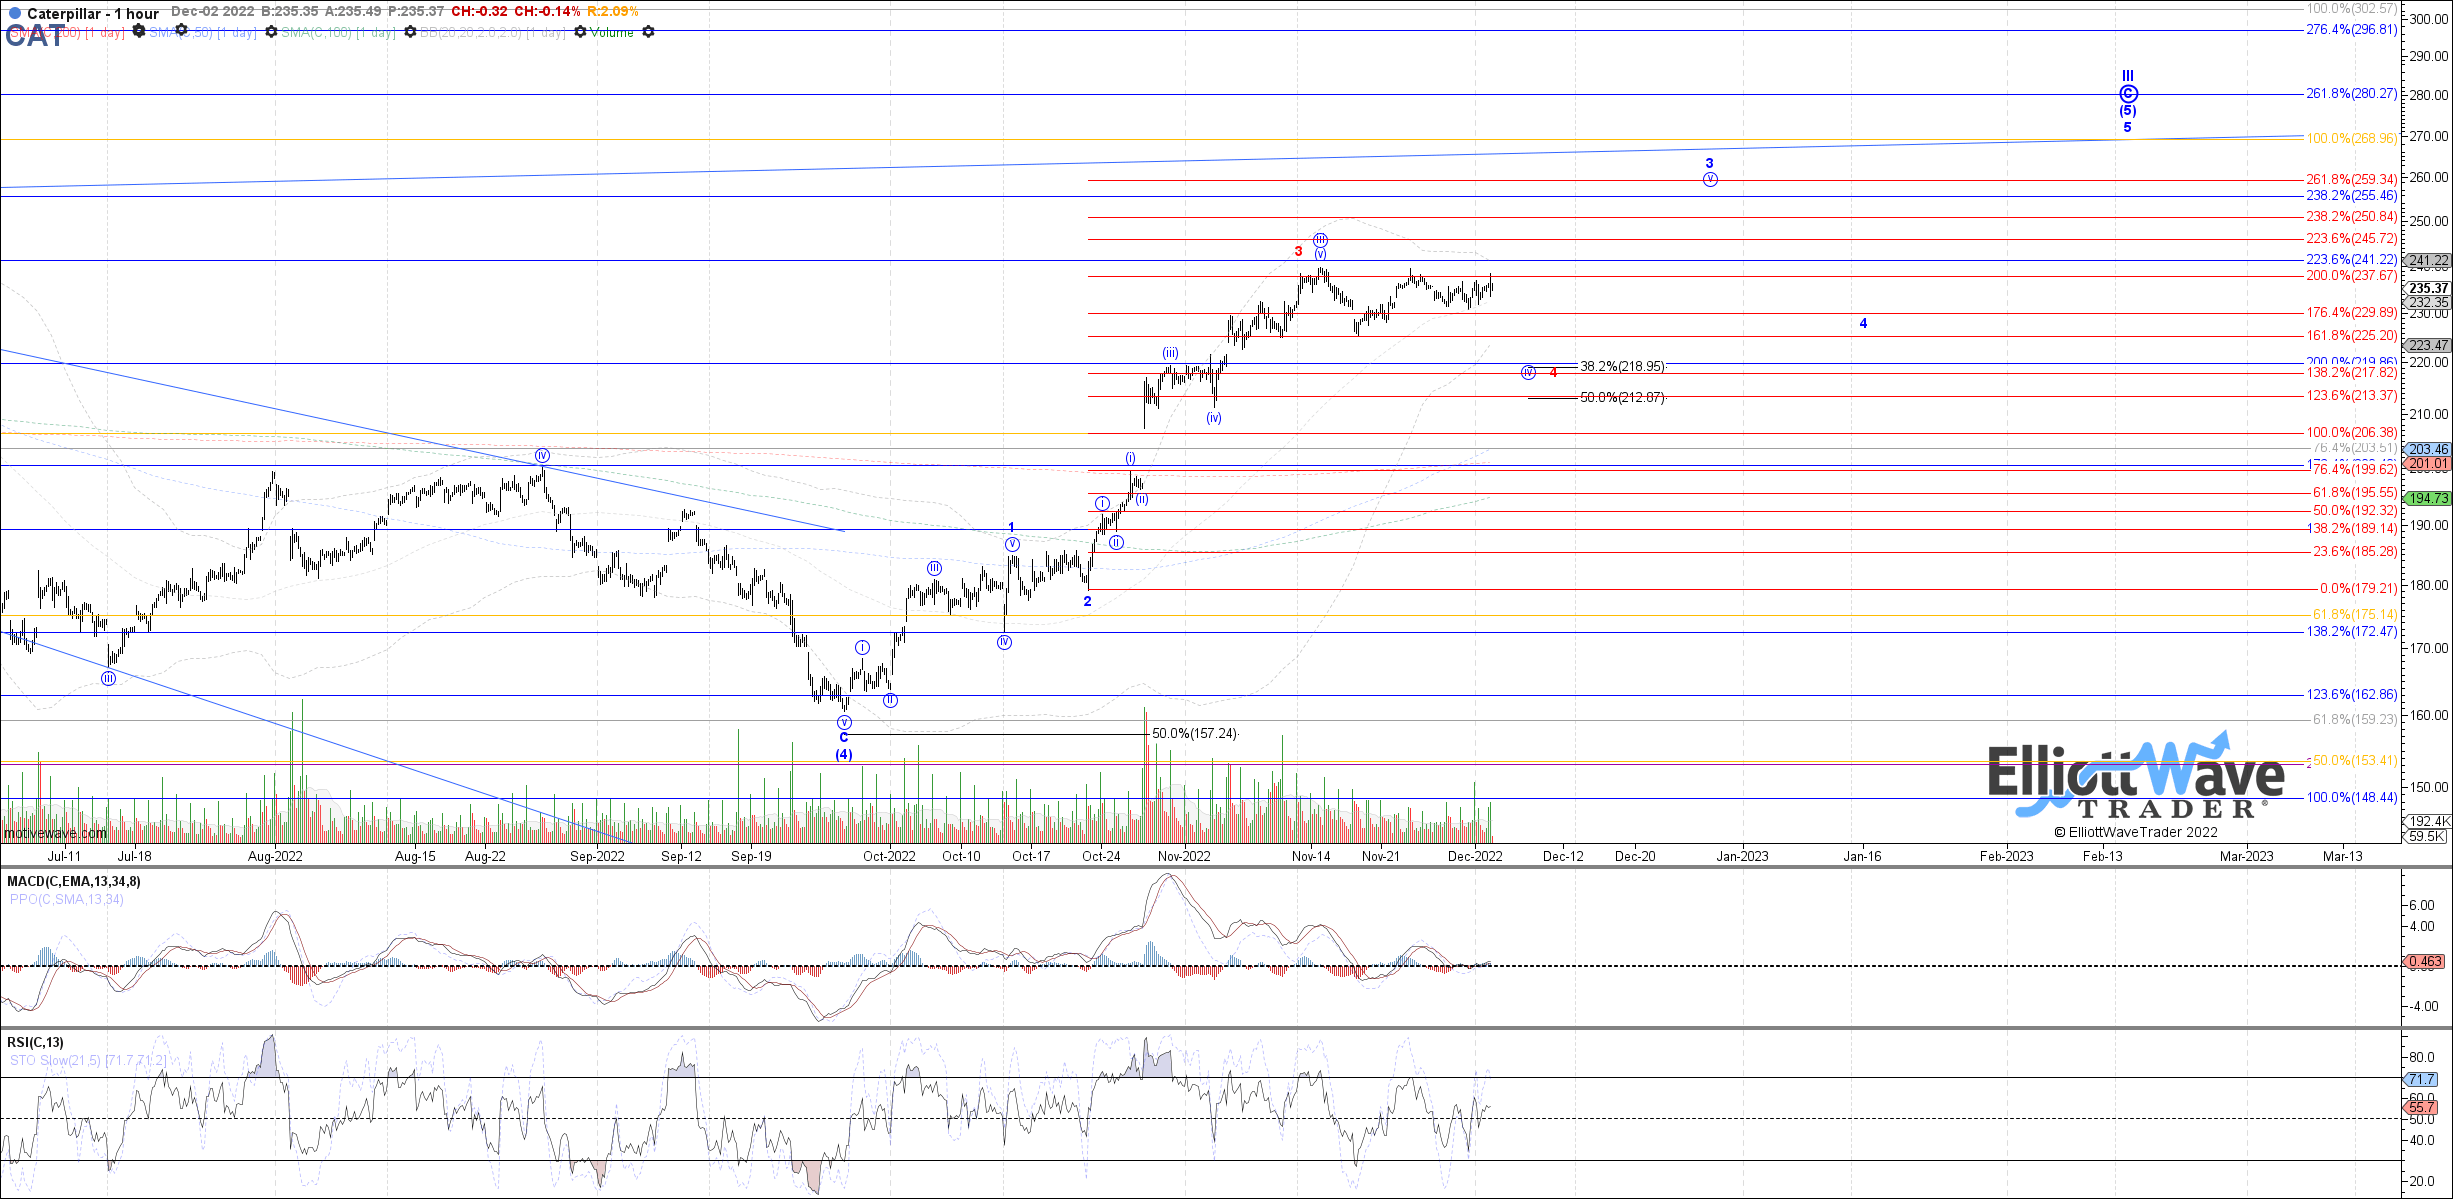
You will note in these charts that our analysis of the structure of price tells us that the most probable path for both CAT and DE is up into 2023. However, Lyn Alden’s analysis suggests that both stocks are currently fairly valued. How do we harmonize these points of view?
What Is The True Driver Of Markets?
Social mood and herding. I want to share with you a segment from our broad education section on ElliottWaveTrader.net. You have seen quotes from former Federal Reserve chairman Alan Greenspan. As we mentioned before, Mr. Greenspan noted that markets are driven by ‘human psychology’ and ‘waves of optimism and pessimism’.
Ultimately, as Mr. Greenspan correctly recognized, it is social mood that will move markets. This is why news does not cause a change in the trend of the market, unless that trend is already set to change. In fact, have you ever wondered why a market will continue to go up after the announcement of bad news, or down after the announcement of good news?
Bernard Baruch, an exceptionally successful American financier and stock market speculator, who lived between 1870-1965, identified the following long ago:
All economic movements, by their very nature, are motivated by crowd psychology. Without due recognition of crowd-thinking… our theories of economics leave much to be desired…. It has always seemed to me that the periodic madness which afflict mankind must reflect some deeply rooted trait in human nature – a trait akin to the force that motivates the migration of birds or the rush of lemmings to the sea… It is a force wholly impalpable… yet, knowledge of it is necessary to right judgments on passing events.
This is why any investor who is able to rise above news and emotion, and identify the prevailing social moods and trends, will have a significant advantage over other investors, as Mr. Baruch clearly understood.
Conclusion And Risks
So given that the true driver of markets is sentiment (social mood) and crowd psychology, it is our current view that CAT and DE will both reach higher prices in the next 12 months. What would derail that viewpoint and push us to revise our paths that we see as most likely for them both?
Macroeconomic factors could weigh on the entire market. Social mood can shift. Company specific issues can depress the price of the stock. And particular to CAT, a move below the $200 – $206 level would be the first warning that something different is playing out other than what we have illustrated in the attached charts. In DE, the $400 – $404 level is current near-term support.
So, for as long as these two stocks continue above support, we view them in a positive posture to make new highs into 2023. However, one important point to derive from this article is that both CAT and DE will likely strike significant tops in the coming months.
We have much more in-depth research and reports available to any that would like to broaden their understanding of how markets truly work. There is a 6-part series published right here on Seeking Alpha written by Avi Gilburt. It is well worth your time to review these articles and better comprehend the forces that impel the markets.
See part 1 of the series here:
This Analysis Will Change The Way You Invest Forever – Part 1
I would like to take this opportunity to remind you that we provide our perspective by ranking probabilistic market movements based upon the structure of the market price action. And if we maintain a certain primary perspective as to how the market will move next, and the market breaks that pattern, it clearly tells us that we were wrong in our initial assessment. But here’s the most important part of the analysis: We also provide you with an alternative perspective at the same time we provide you with our primary expectation, and let you know when to adopt that alternative perspective before it happens.
There are many ways to analyze and track stocks and the market they form. Some are more consistent than others. For us, this method has proved the most reliable and keeps us on the right side of the trade much more often than not. Nothing is perfect in this world, but for those looking to open their eyes to a new universe of trading and investing, why not consider studying this further? It may just be one of the most illuminating projects you undertake.
Be the first to comment