

Pgiam/iStock via Getty Images
This is a follow-up article to this article. It also includes a three-minute explanatory video at the end. It’s a live example on how I think the Elliott Wave theory and its predictions can be enhanced by integrating contrary opinion and market sentiment with it.
Looking for the second wave of the bear market?
Since our Master Sentiment Indicator gave two strong buy signals in July and October, which were detailed in these two articles (here) and (here), the market has moved considerably higher. We think prices will continue higher, but are troubled by the idea that the bear market doesn’t seem complete. Theoretically, bear markets should have two downward waves separated by a bear market rally. It is not clear that we’ve had that.
We are also troubled by the fact that interest rates are not coming down, which normally occurs coincidental with the start of a new bull market. If this is the start of a new bull market, it seems to be ahead of itself. Which begs this question. Is there a market scenario that allows the October lows to be the price lows of the bear market, but not have the bear market complete? Yes, there is. It would be possible if one accepted the idea that the market is forming a large Elliott wave bear market “flat.”
An Elliott Wave bear market flat
The chart below is a graphic of the market making a large Elliott Wave bear market flat. The theoretical foundations behind this are explained later in the article.
In this scenario, the bear market, which is the correction of the previous bull market, takes place in two large downward waves with a large rally in between. If this is what’s happening, we are currently in that large rally, which should carry prices back to 4,800 and form a double top (B). This would be followed by another move down to C. Each downward wave (A and C) would last approximately six months and end near the same price.
In Elliott Wave terminology, an ABC corrective pattern that has both a large, double top and double bottom like the pattern shown is called a “flat.” They are common. To us, this is the price pattern that would fit with the high level of bearish sentiment that occurred last summer. The current rally isn’t the start of a new bull market, but a large intermediate term movement back to the previous peak.
An Example of the Market Forming an Elliott Wave Bear Market Flat (Michael McDonald)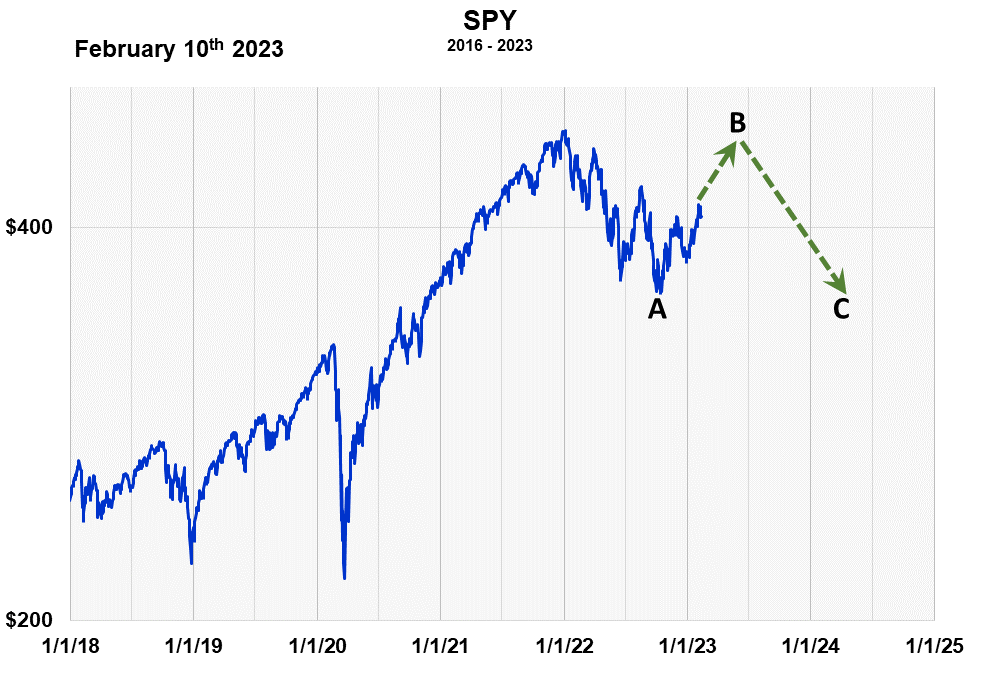
The Elliott Wave Theory is a Fractal Theory
So I don’t self-plagiarize, the following is a quote from the previous article:
The Elliot Wave theory is a fractal theory, which is a well-defined subject in mathematics. Some fractal patterns are completely predictable, many are completely random, while most, like the patterns formed from the ups and downs of the stock market, lie somewhere in between.
From my experience, the up and down patterns formed by the price movements of the market are more unpredictable than predictable. In practice there are simply too many “alternate counts.”
The predictability of Elliott Wave patterns, however, can be substantially improved by integrating market sentiment into the theory.
Fractals are about self-similar geometric patterns that scale up and down in both time and size. If you have ever taken the time to visually move up and down into the Mandelbrot set on a computer, you’ll fully understand what this means.
In the Elliott wave theory, the simple price pattern that repeats itself is shown below. It’s from my 2002 book, “Predict Market Swings with Technical Analysis” and Chapter 6 called “Price Patterns, Fractals and Mr. Elliott.” Unfortunately (or fortunately), I believe the book, which was published by Wiley and Sons, is currently out of print.
The Basic Eight Wave Elliott Wave Pattern (Michael McDonald)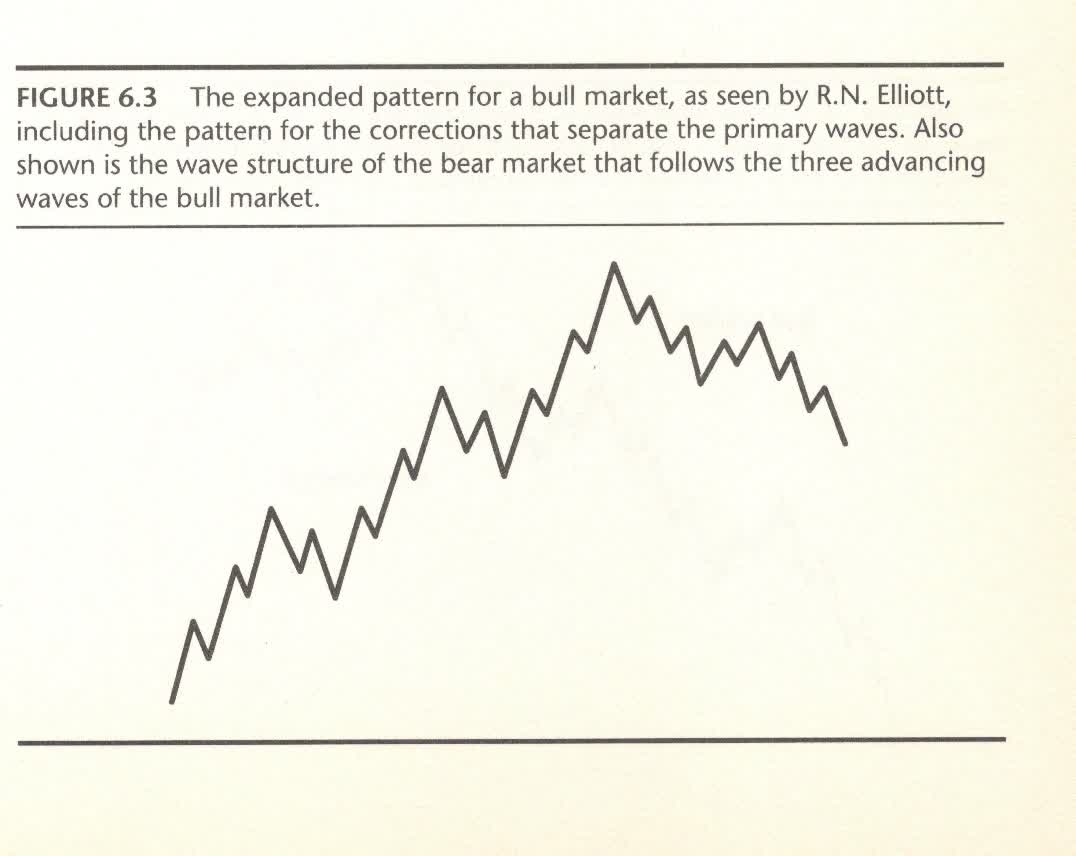
One can find this basic pattern in price fluctuations that take place over minutes, or those that form over decades. If I took two price charts, one formed over minutes and the other formed over years, and took away the price and time scale, most could not tell one from the other. The two patterns would be similar, or what’s called self-similar. In this aspect, stock prices are like the Mandelbrot set.
Just because the Elliot wave theory is a fractal theory, and fractals are a branch of mathematics, doesn’t mean that the Elliot Wave theory is a predictive theory. We are used to mathematics being a predictive tool in science, but it can also be used to understand unpredictable systems.
From my experience with E.W., the fractal patterns formed by the price movements of the market are more unpredictable than predictable. This basic pattern can be stretched and pushed out of shape in too many ways. In practice, because of the stretching and pulling due to “extensions” and “irregular corrections”, there are simply too many “alternate counts” to make it a useful trading tool all by itself.
The situation changes, however, if one adds market sentiment to the theory. Market sentiment helps the trader determine which of the many ‘alternate counts’ is most likely. How to add sentiment to the theory was covered in the previous article
The best way to see this is by either reading the article or watching this 3-minute video. It shows the Master Sentiment Indicator over the last 15 years and explains how one can integrate it with the current market to come to the conclusion that there is a high likelihood we are in the process of forming a large Elliott Wave flat.
Be the first to comment