

da-kuk
When it comes to investing, I focus almost exclusively on long-term fundamentals. I want to buy companies and other assets with time horizons of 3-5 years, or even longer if possible, and let them compound over time.
However, focusing on some basic technical indicators can help with risk management. When possible, I like to buy high-quality assets that recently fell sharply and have shown some semblance of a bottom, marked by a momentum shift from negative to positive, for example.
That of course doesn’t guarantee that a bottom is in, and could always get a lower low, but those types of opportunities are at least good to be aware of for further research.
Several times per month for Stock Waves, I try to find opportunities where the fundamentals and technicals align and publish a short-form piece on them. Zac and Garrett focus on technicals only, and I focus on fundamentals only (or 95%), and so I go and find stocks that we’re all bullish on for different reasons, or all bearish on for different reasons, and see what’s going on there.
Lyn Alden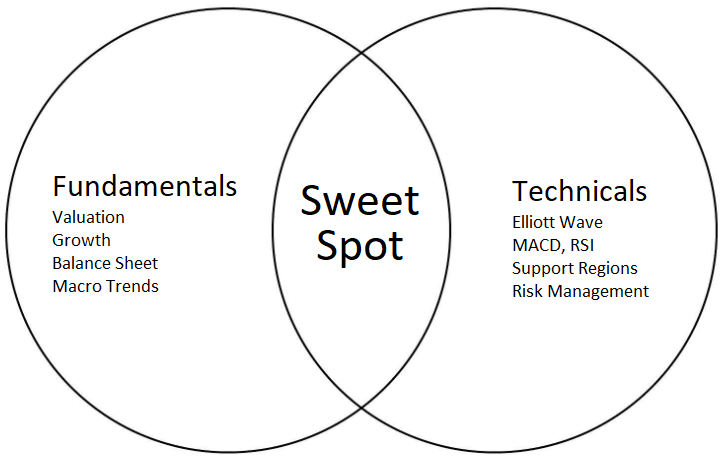
I like to make some of the pieces in this series public occasionally (not just in Stock Waves), so here’s this week’s edition of “Where Fundamentals Meet Technicals”, with the goal of providing a watch list of names that are worth digging more into.
HDFC Bank
HDFC Bank (HDB), the largest bank in India, is pretty interesting at current levels.
FAST Graphs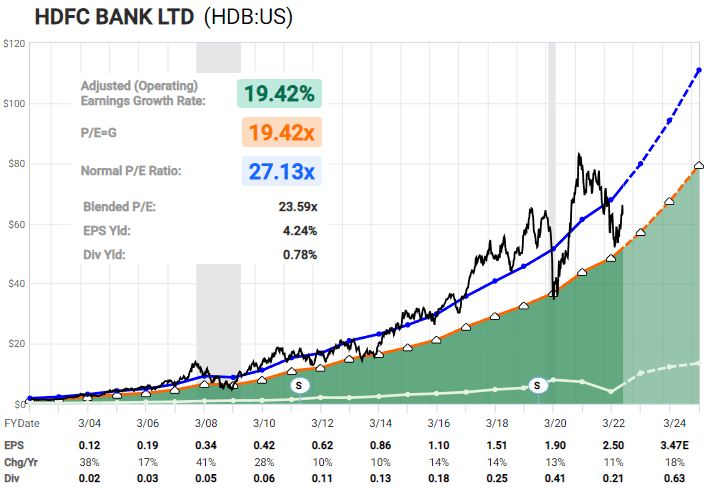
The bank has a persistent double-digit growth rate, and a valuation that while somewhat rich in absolute terms, is currently quite reasonable relative to its long history. Additionally, the bank is well-capitalized, with good internal metrics, and has a very diversified loan book.
HDFC Bank 2022 Investor Presentation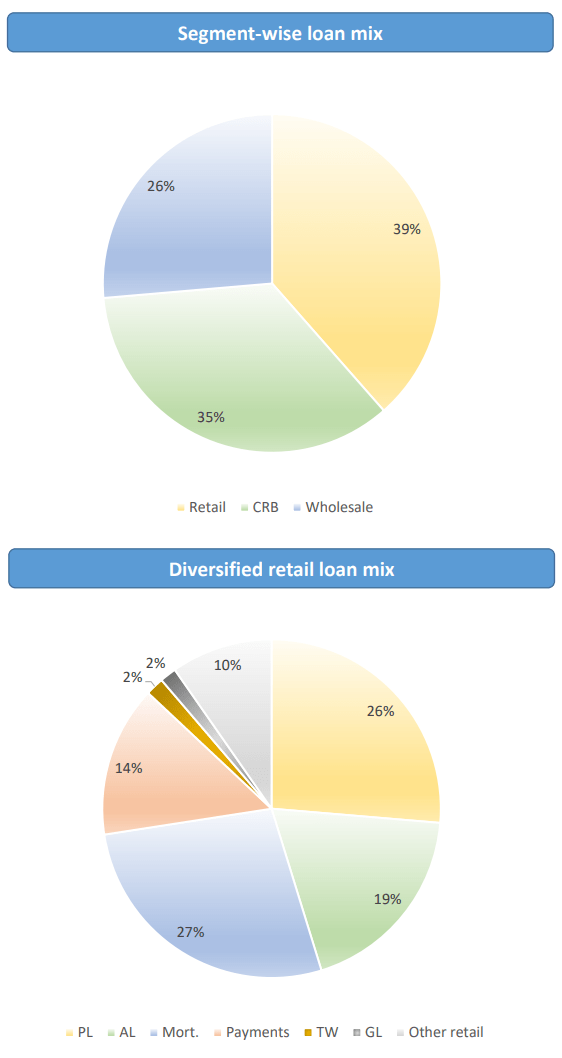
Additionally, HDFC Bank’s upcoming merger with HDFC Ltd will further diversify the bank to more types of financial products.
India remains underbanked in general, with only 37% household debt as a percentage of GDP.
Bank for International Settlements, Lyn Alden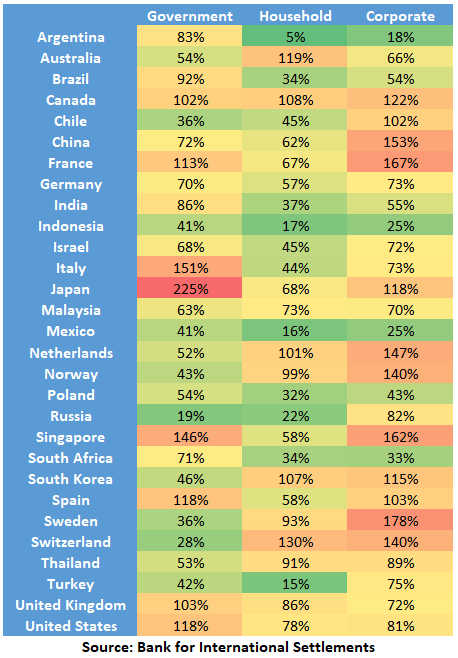
With favorable demographics, and low domestic and foreign debt, I continue to have a long-term bullish outlook on India in general, and India’s banking sector specifically.
Independently, Zac has been identifying HDFC Bank as a bullish technical opportunity over the next few years.
Zac Mannes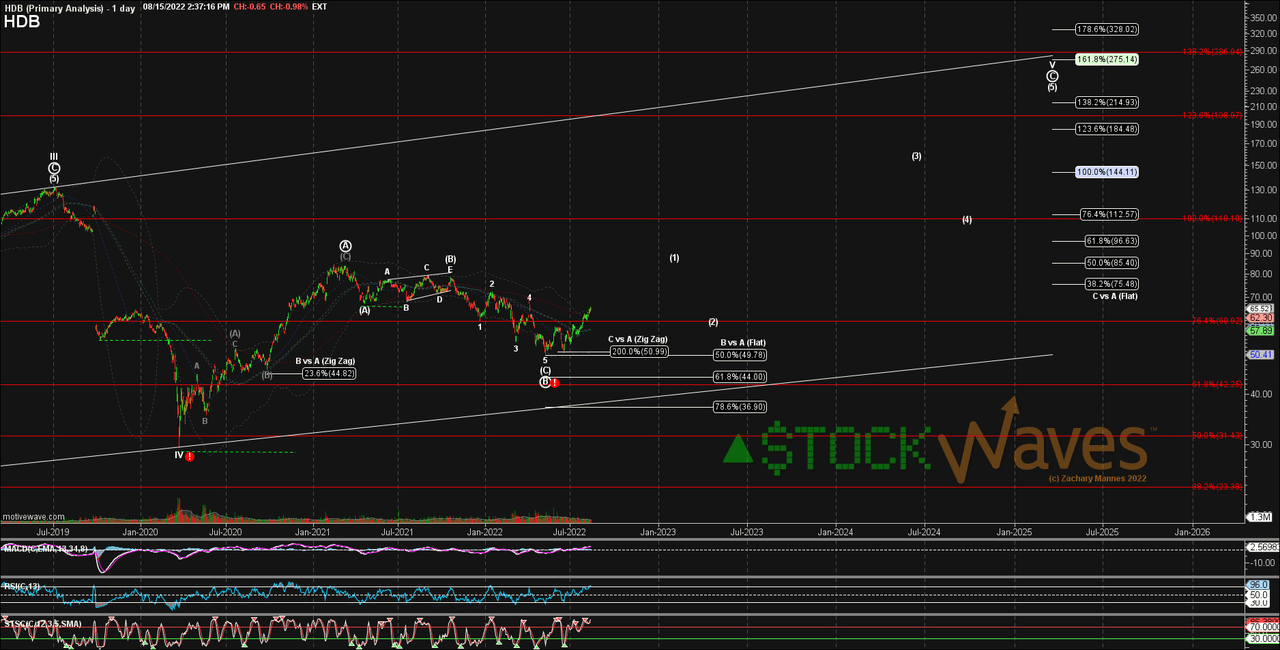
For a position trading perspective, an investor could use the May 2022 low as an invalidation or re-assessment level regarding the bullish thesis, and otherwise let it run to the upside if it remains above that threshold.
StockCharts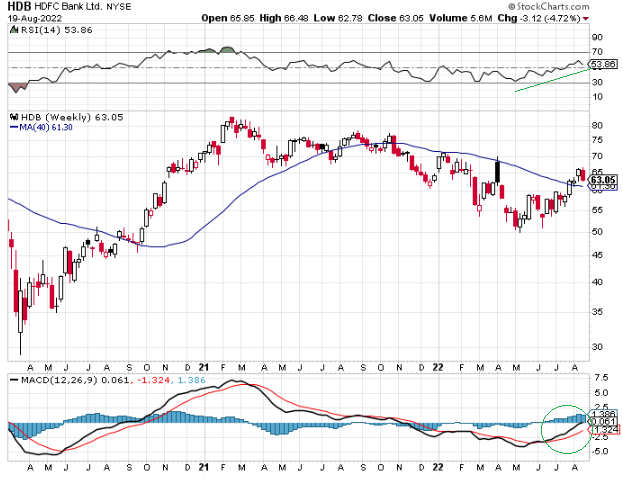
US Financial Sector
Banks in the United States have much slower growth than HDFC Bank, but they also trade at low valuations. Many of them, due to current recession fears and an inverted yield curve, trade at single-digit price/earnings ratios, or nearly so.
Zac has been bullish on the financial sector lately for technical reasons, and it lines up with how I view them fundamentally.
Zac Mannes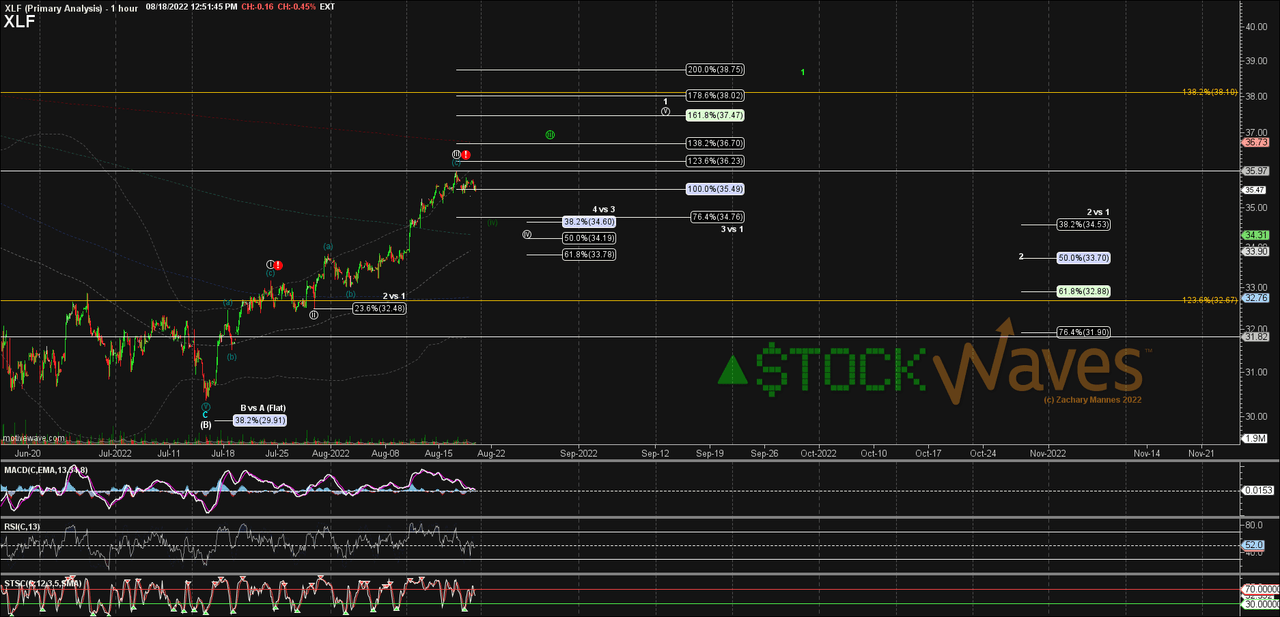
If we take Bank of America (BAC) for example, we can see how sharp this recent sell-off was:
FAST Graphs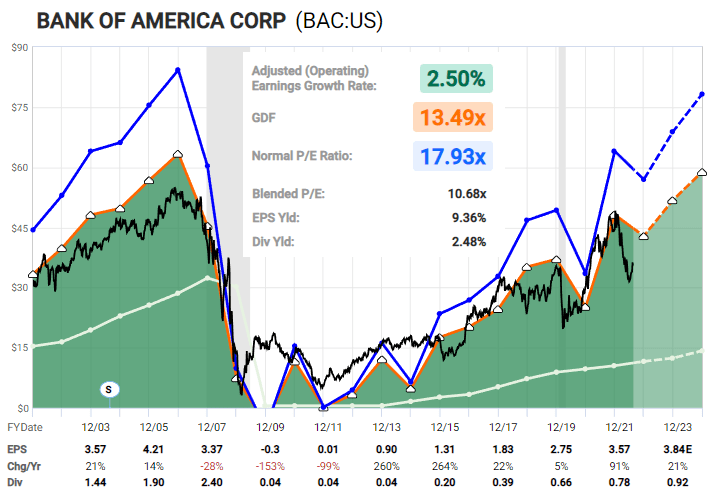
Unlike the 2007-2008 period, banks in the US have very high levels of cash and Treasuries as a share of their assets, and a lot less exposure to subprime lending, which makes it a lot less likely for them to have cataclysmic lending losses.
St. Louis Fed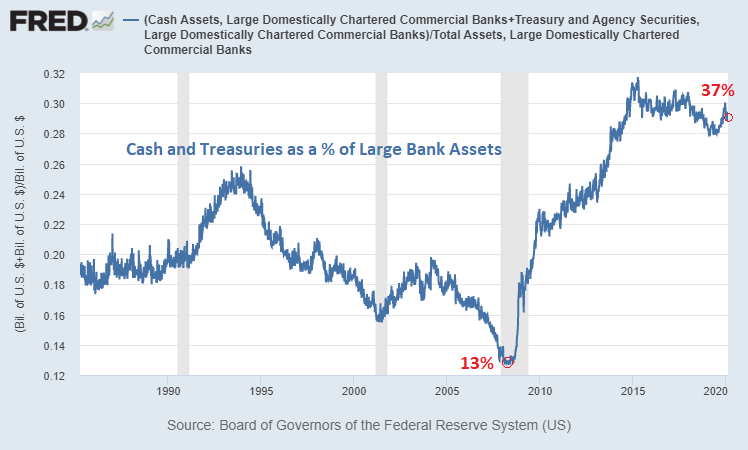
While acknowledging their cyclicality (aka plenty of near-term volatility in this decelerating economy), I continue to be bullish on good US banks with a multi-year view.
This recent sell-off in BAC has already been its third-worst within the past decade, with a peak drawdown of about -37% back in July, from levels that weren’t that high to begin with:
YCharts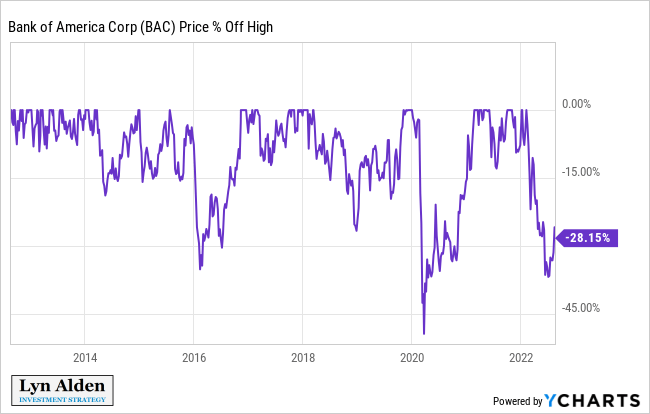
I think it will be choppy waters for banks for quite some time, but when looking back 3-5 years from now, I think the probabilities are currently in their investors’ favor.
StockCharts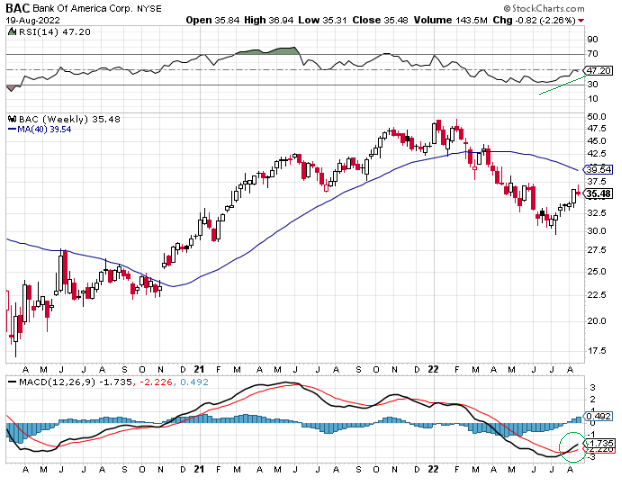
Simon Property Group
Many REITs have taken a beating lately, including some of the high-quality ones like Simon Property Group (SPG).
FAST Graphs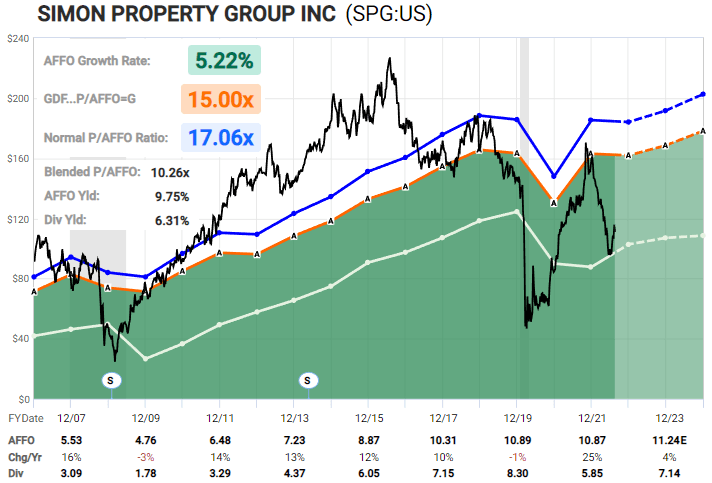
With an A- credit rating, SPG has good enough cash flows and balance sheet flexibility to weather a recession. SPG is more cyclical than some others like Realty Income (O), but in exchange for that, SPG is trading at a historically low AFFO multiple, while names like Realty Income are not.
Zac has had a constructive outlook on REITs (VNQ) in a technical sense ever since they hit this recent local bottom:
Zac Mannes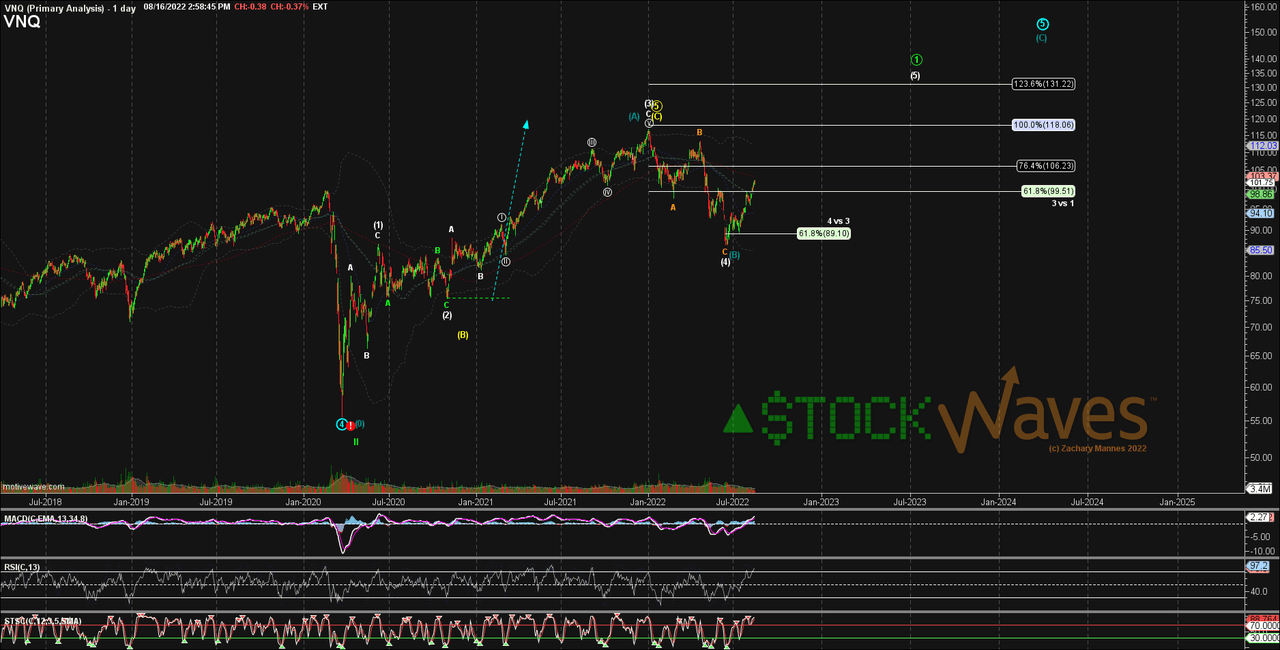
For risk management purposes, Garrett identified $116 as a technical resistance price level to watch for SPG back in July. He considers it less risky once it breaks above that level, and SPG recently bounced right up to that level and rolled over.
For now, investors might want to sit back, avoid catching any knives, and watch this play out. But if it breaks back above $116 to continue this recent rally, then both fundamentally and technically, it becomes a very interesting setup.
StockCharts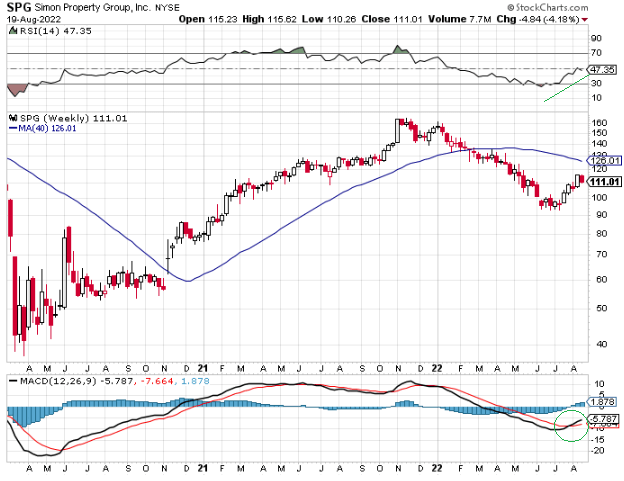
Be the first to comment