

It’s time to look at all our positions with fresh eyes and determine whether they need to be sold bunhill
Brian Dress, CFA — Director of Research, Investment Advisor
We certainly tire of filling this space each week with discussion of how weak financial markets are. And we know we aren’t the only ones running out of patience for these narratives of interest rates, inflation, the Federal Reserve, and financial turmoil around the globe.
Over the past few months, we have been communicating our view that investors should approach all financial markets with a sense of caution and a defensive strategy. As investors, we don’t have control over the outcomes of our decisions, but we must make the best choices, given the limited information that we have at our disposal.
Many of us think of investing as picking the right stocks (and other securities) and riding them out over the long term. For the most part, this correctly describes the enterprise that we’ve made our life’s work here at Left Brain. But even more important than what securities we buy, is the decision we ultimately make to sell these investments. Unfortunately, many of the best stocks from the last decade are currently in strong downdrafts, putting shareholders to a difficult decision: “When should you sell a stock?” In today’s letter, we give you our thoughts of a strong framework for making that decision, following that up with a case study of a company we have followed closely throughout the years, to help create a practical application of the theory.
Markets lost ground over the past five days of trading, but the feelings the price action generated were probably worse for investors than the actual return data suggest. The broader market fell roughly 3% over the past week, but price action remained volatile, just as it has been throughout 2022. A near crisis was averted in debt markets in the UK on Wednesday of this week. Swift action from the Bank of England stopped a number of financial institutions in the country from default, but we take the episode as yet another sign that things are less than stable in world markets. Thus, we continue to preach caution for investors. We will cover the unmistakable impact of macroeconomic forces on markets of all types in the first main topic of this week’s letter.
We’ve said it before and we will say it again, we are in the full throes of a bear market here in 2022. There are many ways to define a bear market from a technical point of view, but allow us to share our definition, colored by the events of this year. We think a bear market is one in which there is no secure asset class or sector for investors to hide. We continue to see evidence that this is the case in 2022: as you review the table below, you can see the dismal performance of both Utilities and Consumer Staples stocks over the past week, both of which are generally considered “safe” sectors in which to park funds.
With that all being said, let’s get into it!
Below is the performance data of key indices, ETFs for the five trading days between 9/22/22 and 9/29/22:
Yahoo Finance, Left Brain IR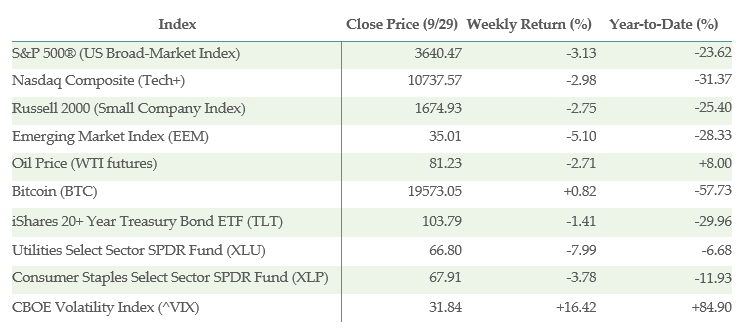
What is/is not Working?
The S&P 500 lost roughly 3% of value over the last five trading days through Thursday’s session. Selling was quite broad-based and, as a result, all 11 S&P 500 sectors were down for the week. We saw continued weakness in real estate, down more than 6% in just a week’s trading and we have observed difficulty in REITs and other real estate related assets over the past few months, due to high levels of interest rate sensitivity.
As we alluded to above, a bear market means nothing is “safe”. We saw further evidence of that phenomenon in the worst performing sector list. We saw more than 8% of value lost in the utilities sector, which is traditionally quite defensive, albeit interest-rate sensitive. We also saw a nearly 4% loss in the consumer staples sector, which itself if normally defensive. The concept of raising more cash in a portfolio to save for better future opportunities, instead of looking for “safe” places to hide, looks more and more attractive as the weeks go by.
The “best” performing sector this week was healthcare, which lost just 0.52% in value on the week. Healthcare stocks represent businesses benefiting from non-discretionary expenditures. This is one of the few sectors in which we feel comfortable investing so long as the dynamic of higher interest rates continues to play out.
We follow more than 300 sector and industry ETFs in our “Everything” list in our securities evaluation system. Remarkably, we had just 18 of those showing a positive reading on the week. Most of those were funds that bet against the market like iPath Series B S&P 500 VIX Short-Term Futures ETN (VXX), ProShares Short QQQ (PSQ), ProShares Short High Yield (SJB), and AdvisorShares Ranger Equity Bear ETF (HDGE).
There were (VERY) few positive notes to glean from this week’s Best Performing list. One was the outperformance of the biotech sector, driven by shares of Biogen (BIIB), which rose sharply this week on news that the company’s Alzheimer’s drug shows promise in slowing cognitive decline in patients.
We also saw relative strength in crypto assets this week. Bitcoin actually gained slightly in value this week despite the overall market selloff and the second-best performer on our list this week was ProShares Bitcoin Strategy ETF (BITO), which gained nearly 5% on the week. Other assorted strong performers this week included abrdn Physical Palladium Shares ETF (PALL) and Invesco DB US Dollar Index Bullish Fund (UUP), which continues to benefit from rising rates in the US and relative weakness of the other economies around the globe.
Interest rates are wreaking havoc on high-yielding securities, particularly in the financial space. As a result, we saw dramatic moves in ETFs containing REITs, Business Development Companies, and other financial firms. Among our worst performing industry ETFs were iShares Mortgage Real Estate Capped ETF (REM; down 20.4%), Invesco KBW High Dividend Yield Financial ETF (KBWD; down 13.2%), and VanEck BDC Income ETF (BIZD; down 9.3%). We understand the temptation that these lower prices and corresponding high yields for holdings in these funds may present to investors, but we advise against buying the dip here in the short term. As long as interest rates are on the rise, these types of securities will almost assuredly continue to sell off and violently so. We see no reason to chase risky securities for yield in any case, with investment grade bonds currently available that yield between 5-8%, with a very defined risk profile.
Energy was weak over the last five days, with the United States Natural Gas Fund, LP (UNG) losing nearly 11% in value and other energy-related ETFs like ClearBridge MLP and Midstream Fund Inc (CEM) and Kayne Anderson NextGen Energy & Infrastructure Inc. (KMF) losing more than 7% in value. These securities also fall into the category of “high-yielding equities” along with REITs and BDCs.
Macroeconomics: It’s Inescapable
If you have followed Left Brain for any length of time, you will know that we are fiercely committed to fundamental views on individual businesses, which lead us to investment decisions in stocks, bonds, and other securities. For investors like us, these times have been especially frustrating.
And why? The reason we find ourselves flummoxed on an almost daily basis is that fundamentals don’t seem to have much of an impact on what is happening, as regards stock and bond prices. Rather, we see the entire market seemingly moving as one single asset class, hanging on every word coming from the Federal Reserve and other Central Bankers around the world.
This week was a terrific example of the phenomenon. As newly minted British Prime Minister, Liz Truss trotted out her tax cut plan, markets responded extremely unfavorably. In a time of worldwide inflation, currency and bond traders in the UK and around the world responded swiftly to the expansionary policy, relentlessly selling any paper connected to Britain. The British Pound fell decisively, pulling down stock and bond markets around the world with it. Stock markets around the world recovered swiftly on Wednesday, after the Bank of England announced a program to purchase some $70 billion worth of British bonds.
We aren’t particularly interested in the UK debt markets here or in the general direction of the Pound Sterling. We are just observing that markets are trading almost completely apart from any fundamental read on the underlying businesses that comprise the stock market.
The Federal Reserve (and other Central Banks around the world) are actively withdrawing liquidity from the global financial system. In retrospect, we can observe that stock and bond markets carried artificially high valuations, based on low interest rates, which forced investors into risky assets. At lower interest rates, markets can absorb higher stock and bond valuations, but as rates rise, long duration assets tend to fall in value across the board. Stocks, especially those corresponding to not-yet-profitable businesses, are the ultimate long duration assets. Thus, we observe markets trading more on an arithmetic relationship than on fundamentals.
What is the takeaway? For us, it continues to be caution. Our investment team will use the next few months to continue building lists of stocks and bonds we think will recover best, once the markets again start to trade on the fundamentals. Until then, we remain somewhat at the mercy of Jay Powell and his Central Banker colleagues around the globe, who have telegraphed time and again their intentions: to bring down the valuation of assets around the world.
We still think there are interesting one-off opportunities, especially in discount bonds and we will continue to pound the table there. But investors will be fooling themselves if they expect a bull market to resume any time soon, as long as rate hikes are the story of the day. Sometimes the best practice for investors can be to widen your markets and lose less money, be patient and wait for a brighter day. The sun will come out tomorrow!
When Should We Sell a Stock: NVDA – A Test Case
Things are clearly tricky right now. Some stocks have already fallen 50%+ from their highs. I think we are all slightly disoriented with respect to how we should value any asset, and understandably so. Over the last decade, we have been conditioned as investors to “buy the dip” and things tend to turn out right. But remember, that was because accommodative monetary was buoying markets for years. The so-called “Fed put” was the straw that had stirred the drink from 2009-2021.
When a stock we hold falls 50%+, many times the mistake we can make is thinking “how much worse can it possibly get?” Step back for a second and realize that we can still lose 100% of our money from the current market price, if the company goes bankrupt. When we make the decision of whether and when to sell, we must forget about the past price and think about the future.
Often we have emotional attachments to stocks that have made us money in the past and it can be hard to let go. Listen, we are professionals here and I’d be lying if I said that never happened to us. Don’t beat yourself up, this is a difficult game we play in the financial markets.
This week we wanted to answer the question for you of “when should you sell?” and bring in one such emotionally charged stock as an example of how to move forward prudently with your portfolio. The name we are going to cover is Nvidia (NVDA). We have covered this stock for years, long admiring both the management of CEO Jensen Huang and the innovative culture of the firm, which has long moved the ball forward in high-performance computing. As we can see from the 1-year chart below, a lot of damage has already been done.
When we make a decision of when or whether to buy a stock here at Left Brain, we consider four key factors:
- Is there acceleration in business results like sales and profits?
- Does the company’s stock carry a reasonable valuation?
- Does the stock price exhibit positive momentum?
- Do we see any positive catalysts on the horizon for the business?
Logically speaking, this framework should work in reverse as regards sell decisions. We are looking at every security we hold with fresh eyes, in the context of a very difficult macroeconomic environment. Let’s take a couple minutes and assess Nvidia on these four key metrics
1. Is there acceleration in business results?
We read the company’s most recent earnings call from August of this year. We learned that the company was growing its revenues at just 3% annually year-over-year after revenue growth readings between 40-80% for each of the last 10 quarters. Gross margins on a trailing 12-month basis came in at 60.3% after a reading of 65.3% in the previous quarter. Both in sales and profits, results are decelerating.
2. Does the stock carry a reasonable valuation?
NVDA currently trades at a trailing price/earnings (P/E) ratio of 33x and a forward price/sales (P/S) ratio of roughly 11x. While these valuations are much lower than they have been historically, they are still in excess of market averages and much less defensible now, given the slowdown in growth for Nvidia.
3. Does the stock price exhibit positive momentum?
A quick look at the chart below will answer the question for you here. This stock is moving anywhere but up, for almost a year now.
4. Do we see any positive catalysts on the horizon?
Not particularly. On the company’s conference call, management indicated that there is a glut in supply for the company’s signature GPU chips. Many crypto mining firms used Nvidia chips for their operations and the demand for such chips has diminished in the wake of a major change in Ethereum protocols.
More broadly, we are seeing the supply of semiconductor chips pile up. There had been a mad scramble for chipmakers to up production in light of supply chain challenges in 2020 and 2021. We think there could be a major reversal in the supply/demand dynamics for chips generally.
TradingView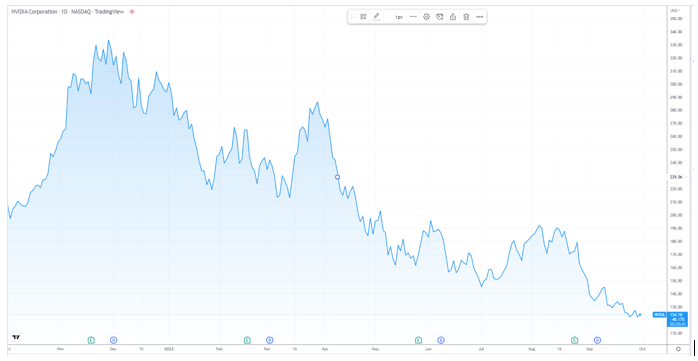
Put simply, Nvidia is 0-for-4 on these key questions. Regardless of how far it has fallen, we think cash is a better investment that these shares, at least for the time being. Investors can certainly keep following the story (and we will), but the percentages and momentum are not in the investors’ favor here.
We know it can be difficult to let go of stocks like this, which have made us excellent returns in the past. That is why we see great value in working with a professional advisor, who can help you make tough decisions like selling this stock.
Takeaways from this Week
Unfortunately, with the way interest rates are dominating the investment conversation, even fundamental investors like us are forced to take stock of macroeconomic trends. This can be a frustrating state of affairs and we think the best way for investors to proceed is with caution. Raising more cash in this environment buys you time and gives you dry powder for when rates finally do stop rising.
Whether to sell a stock, especially if it has made you money in the past, can be one of the toughest decisions you can make as an investor. If you didn’t own the stock and looked at it through the 4-step framework above and you wouldn’t buy it, then you probably shouldn’t continue to own it. Taking the emotions out of the decision can be difficult and that is where professional advisory help can be a huge benefit for you as you look to grow and protect your wealth going forward.
Be the first to comment