

MicroStockHub
Background
The Risk Premium Factor Model (RPF Model) can help understand the S&P 500’s (SP500) valuation to identify bubbles and opportunities. It is built on a simple constant growth equation where: P = E / (C – G) and explains S&P Index levels with good accuracy for 1960-present using only the risk-free rate, S&P 500 operating earnings, and some simplifying assumptions. While most analysts acknowledge the important relationship between earnings and interest rates, the RPF Model qualifies it.
Understanding that these are the most important factors can help cut through much of the analytical noise to help investors focus on fundamentals. In the past, I’ve called this ‘Moneyball’ for the Stock Market.
I first developed the Risk Premium Factor Model (RPF for short) in 1999 and published it in the Journal of Applied Corporate Finance in 2010 and in a book published by Wiley in 2011. I’m pleased to report that more than ten years after publishing and 20 years after conceiving the idea, it still works.
The RPF Model is used to determine the intrinsic value of the market and understand the implied value of the components that drive the market: earnings and long-term interest rates, which drive the cost of capital and embody expected inflation.
In short, the model says that:
Intrinsic value of the S&P 500 Index = S&P operating earnings/(long-term treasury yield x 1.48 – 0.6%)
The model shows that equity prices (via the SPDR S&P 500 Trust ETF (NYSEARCA:SPY)) move inverse to yield. In the equation, 1.48 is the Risk Premium Factor and 0.6% is the difference between long-term expected growth and real interest rates. It is a perpetuity formula that uses the Capital Asset Pricing Model (CAPM) to value the index based on current earnings using a CAPM cost of capital driven by interest rates. I’ve written about the model numerous times, so rather than repeat my entire overview of the model, you can read about it on Seeking Alpha.
To adjust for the Fed’s artificially depressing long-term rates, the model uses normalized yields on Treasuries of 4.5% from August 2011 and 4.0% from January 2015 through September 2022.
Finally, after almost 14 years in March 2022, the Federal Reserve has stopped buying its own securities in the open market, otherwise known as quantitative easing. The result is Treasury yields are now market priced rather than artificially depressed. This has allowed yields on the 30-year to rise from 1.84% at the end of February 2022 to 3.69% at the time of this writing.
The chart below illustrates how the model has performed historically:
Stephen D. Hassett Analysis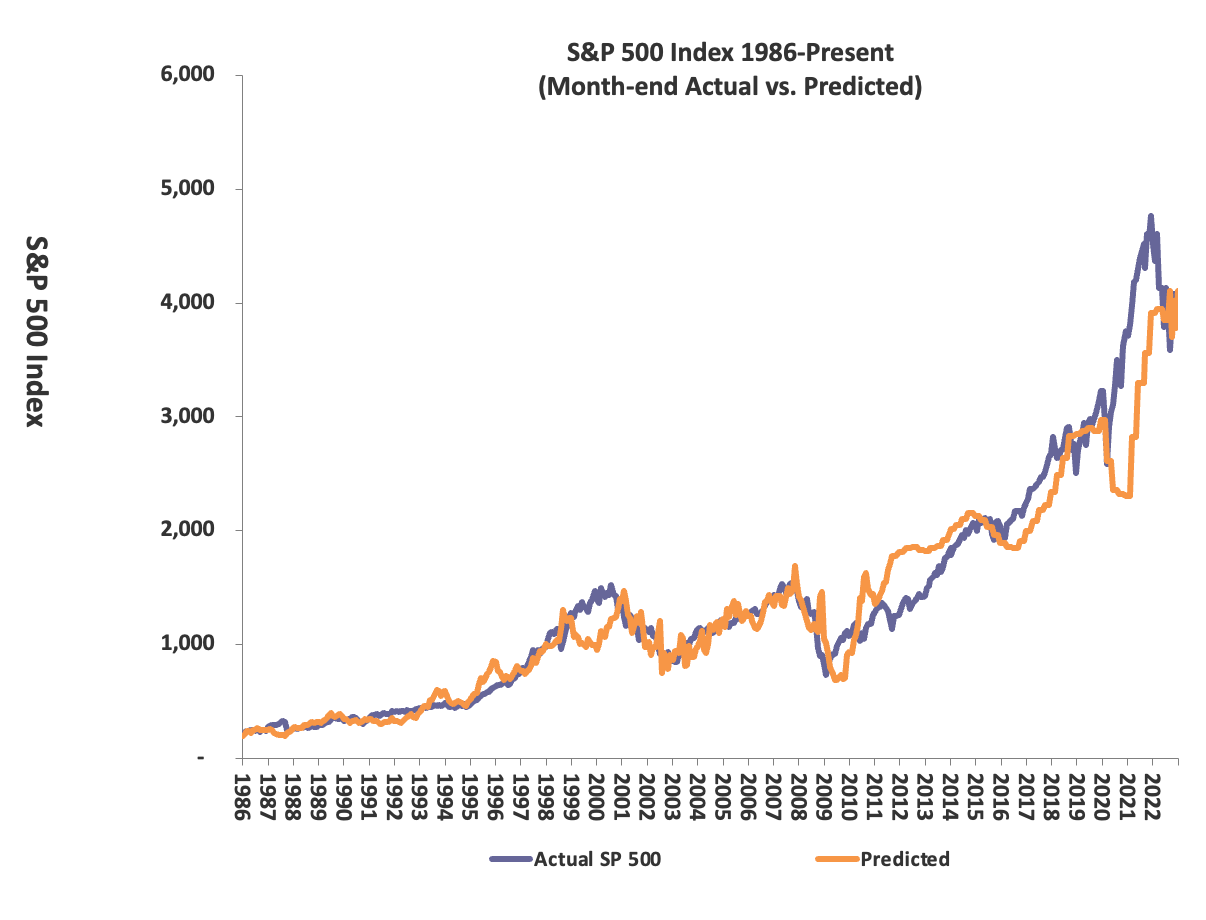
How sensitive is the S&P 500 to earnings and interest rates?
If you’ve read my past articles, going back to 2010, you’ll know that I don’t forecast earnings and I don’t forecast interest rates. The RPF Model requires earnings and interest rate inputs to determine fair value, so it can tell you what earnings and interest rates are required to support current valuations.
The market has a linear relationship with earnings and a non-linear with interest rates. You can see graphs of the relationships in my October 2022 article.
Earnings and interest rates are the keys this year… and every year
Based on current S&P 500 Earnings and actual 30-year yields, the market is fairly valued as of this writing (mid-day 1/23/23). But with the Fed poised to increase rates to continue the inflation fight, many fear that long rates will continue to rise.
On January 19th, Jamie Dimon, President, CEO & Chairman of JPMorgan Chase, on CNBC’s “Squawk Box” said, “I actually think rates are probably going to go higher than 5%… because I think there’s a lot of underlying inflation, which won’t go away so quick.”
What would 5%-6% 30-year treasury rates have on the S&P 500? Based on the RPF Model, 30-year treasury rates of 5% or 6% would result in declines of the S&P 500 to 2,935 and 2,410 respectively, putting it 20% or 34% below today’s level. In other words, an increase in long-term rates has an impact much greater than most people realize.
Fortunately, if the Fed is successful in convincing the market that it will continue the inflation fight, short-term rates could approach 5% with long-term rates staying below 4%. And that would be great news. The table below is based on historical actuals and S&P’s forecast for Operating Earnings. If accurate and 30-year treasuries stay around the current 3.69% rate, we could see increases in the S&P 500. If these two elements hold true, the market is poised to increase by almost 14% in 2023.
Stephen D. Hassett Analysis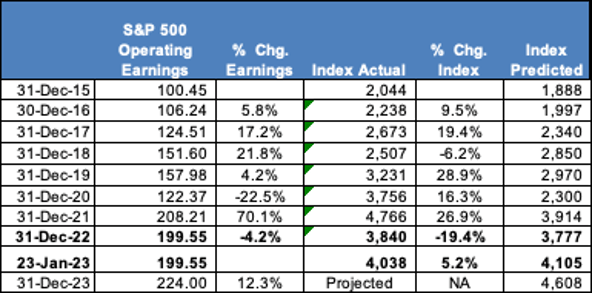
Be the first to comment