

Lisa Lake/Getty Images Entertainment
Introduction
I own just one healthcare stock in my dividend portfolio. Healthcare is a tricky segment. It’s competitive, prone to a lot of regulation, and it’s extremely diverse as it includes healthcare plans providers, drug manufacturers, biotech companies, producers of medical devices and so much more.
Author Portfolio
One of the companies that made it onto my radar is the Cigna Corporation (NYSE:CI), an $81 billion market cap healthcare giant from Bloomfield, Connecticut. This well-diversified company yielding 1.8% is a promising dividend growth stock thanks to a very healthy balance sheet, very high free cash flow, high (expected) growth rates, and a business model that allows for strong secular growth.
In this article, I will share my thoughts on this company, which may be a suitable addition for investors seeking healthcare exposure.
So, bear with me!
What’s Cigna?
Cigna was officially formed in 1982 by the merger of the Connecticut General Life Insurance Company and INA Corporation. However, its roots go back all the way to 1792. INA, for example, was one of the few insurance companies that paid all claims after the Chicago fire in 1871.
Fast-forward many years, and we’re dealing with one of the largest healthcare companies in America. In 2021, the company made 73.4% of its sales through its Evernorth segment, which…
… includes a broad range of coordinated and point solution health services and capabilities, as well as those from partners across the health care system, in pharmacy solutions, benefits management solutions, care delivery and care management solutions and intelligence solutions, which are provided to health plans, employers, government organizations and health care providers.
Its Cigna Healthcare segment accounted for 24.3% of total sales in 2021. This segment…
… includes Cigna’s U.S. Commercial, U.S. Government and International Health operating segments that provide comprehensive medical and coordinated solutions to clients and customers. U.S. Commercial products and services include medical, pharmacy, behavioral health, dental, vision, health advocacy programs and other products and services for insured and self-insured customers. U.S. Government solutions include Medicare Advantage, Medicare Supplement and Medicare Part D plans for seniors, and individual health insurance plans both on and off the public exchanges.
Combining all segments, the company sees three pathways for growth. Foundational growth covers 60% of its revenue, which includes pharmacy benefit services, commercial sales, and growth beyond US borders. In 2021, roughly 97% of total sales were generated domestically.
Accelerated growth is aimed to boost 40% of total revenue, which includes specialty pharmacy, Evernorth care services, and enhanced government services.
The third pathway for growth covers all of its sales, as it looks like deepening relationships with suppliers and customers while driving digital capabilities like analytics and efficiencies to boost free cash flow, which I will cover as well in this article.
Its customer base is broad. The company covers 2/3 of Fortune 50 companies, seven of the top eight health companies, and it covers the top 10 health plans. The company mentioned that 60% of US health plans use one or more Evernorth services, which is 9% of its addressable market. The total addressable market is expected to be close to $900 billion.
Moreover, in its specialty pharmacy business, the company covers 600,000 patients and 15 therapeutic resource centers. In this segment, 2% of customers account for more than 50% of total pharmacy spending. As of 2022, this is a $190 billion market, which could grow to $260 billion by 2025. The company’s current market share is 25%.
The specialty pharmacy business is covered by its Accredo business, part of the Express Scripts acquisition of 2018. Back then, the company bought the company for $67 billion, approved in August of 2018. I will get to this later as it impacts the company’s dividend history.
With this in mind, the company’s business model comes with (at least) two major benefits. First, it provides the company with a load of cash every year. Second, the company is everything except a slow-growth cash cow as its financials are in a proper uptrend.
Both points will be discussed in detail in the next segment:
Cigna’s High Dividend Growth (Potential)
I always like to pull up Seeking Alpha’s dividend scorecard as it compares companies to their sector peers. It’s purely based on numbers instead of anyone’s opinion. What we’re seeing is an A+ for dividend safety, A- for dividend consistency, and a B+ and B- for dividend growth and dividend yield, respectively.
Seeking Alpha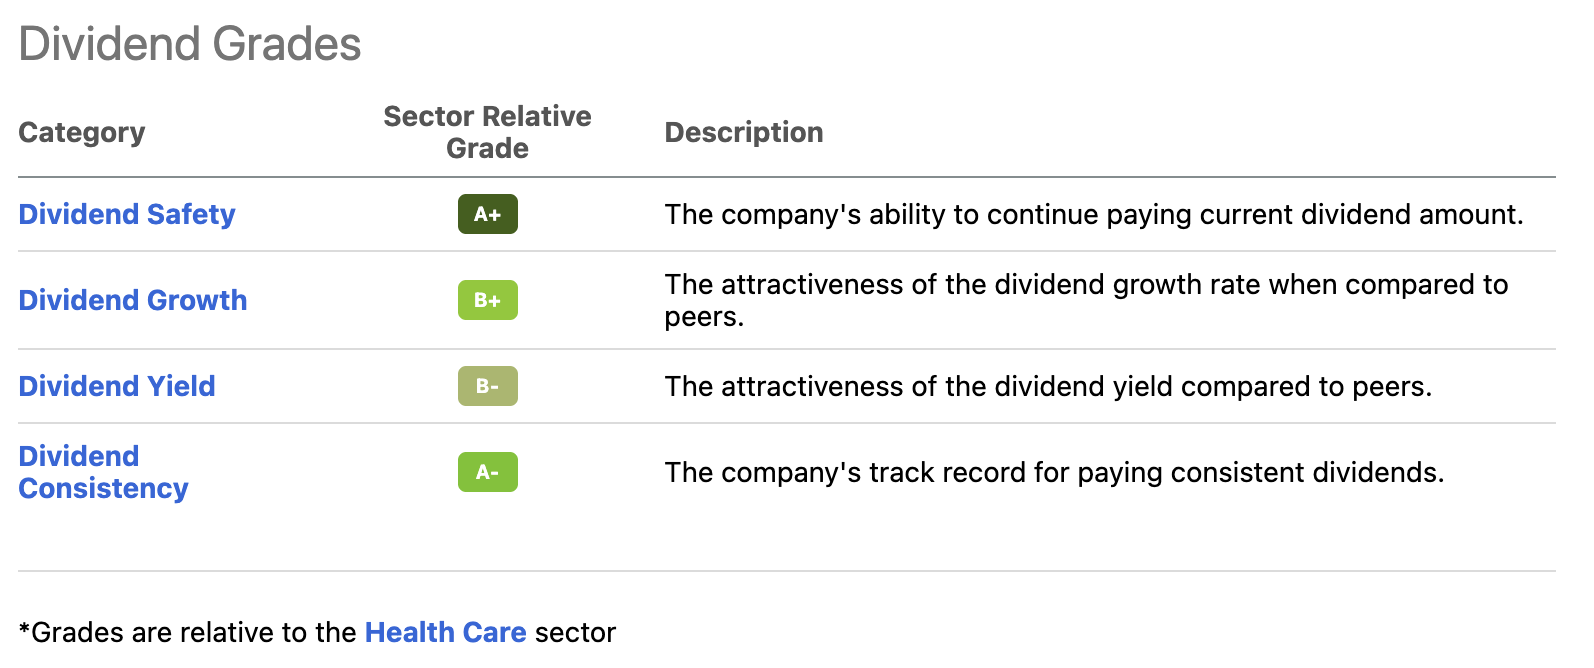
At this point, it’s important that I mention that these grades need to be taken with a grain of salt. The acquisition of Express Scripts had a huge impact on the company’s financials and dividends, as the chart below shows.
The company’s 10-year average annual dividend growth rate is 59%. The 3-year average is 368%. Mathematically that’s correct. The problem is that it’s all caused by a jump from $0.04 in 2020 to $4.00 in 2021.
TIKR.com
On February 3, 2022, the company hiked again. This time from $1.00 per quarter to $1.12 per quarter. That’s $4.48 per year, or 1.8% of the company’s market cap.
This means the yield is above the S&P 500’s yield of 1.4% and that CI is not a typical dividend growth stock as it did not have dividend growth prior to 2021.
The good news is that management is committed to returning cash to shareholders through both buybacks and dividends. On top of the aforementioned dividend growth numbers, the company has bought back shares since the Express Scripts acquisition of 2019. Since then, the number of shares outstanding has dropped from 375.92 million to 337.96 million, which translates to a 10% decline.
In 2020, the company aims to buy back at least $7 billion worth of shares thanks to strategic investments that maintain the company’s double-digit (adjusted) EPS growth history.
Cigna Corp.
To put this number into perspective, $7 billion is 8.6% of the company’s market cap. That’s an absolutely incredible amount of cash to spend on buybacks in a single year.
The company expects to end the year with 310 to 314 million shares outstanding, depending on the timing of international divestitures. The acquisition of Express Scripts caused shares outstanding to rise from 246.7 million to 375.9 million.
The reason why Cigna is able to boost dividends and repurchase close to 9% of shares outstanding is that the company is set to do $8.2 billion in free cash flow this year. Free cash flow is operating cash flow minus capital expenditures. It is cash a company can spend on shareholder distributions without the need for external funding or its existing cash position.
Using the $81 billion market cap again, the company has an implied free cash flow yield of 10.1% this year. In other words, it covers both its 1.7% dividend as well as its aggressive share repurchases.
TIKR.com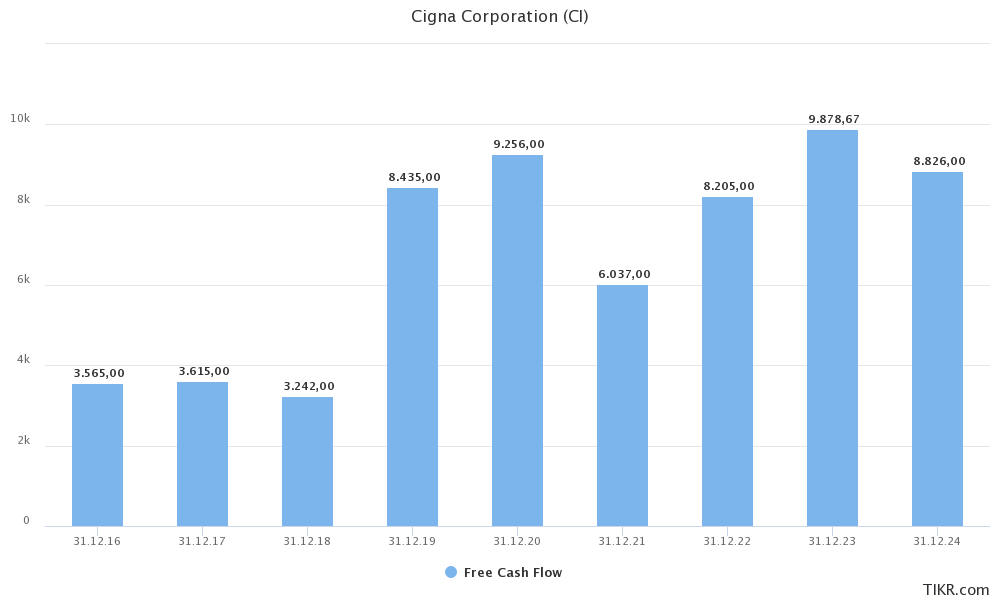
Moreover, analysts do not expect that the company will prioritize debt reduction anytime soon. The company is expected to end next year with $24.7 billion in net financial debt. This number could be much lower given high free cash flow, yet it’s close to 2.0x EBITDA. In other words, there’s no real reason to reduce debt instead of distributing cash to shareholders.
TIKR.com
Adding to that, the graph above shows how quickly the company’s debt ratio fell after the 2018 acquisition of Express Scripts, as it allowed the company to boost earnings and related free cash flow.
Outperformance And Valuation
Let’s get the bad news out of the way first. In the past few weeks, I’ve written a lot on low volatility dividend growth stocks. Cigna is not a low-volatility stock. Since 1985 the stock has returned 12.7% per year (CAGR). That’s a neat result. The S&P 500 has returned 10.8% per year. Cigna’s standard deviation is 30.5% versus a standard deviation of 15.2% for the S&P 500. Cigna has been prone to a number of very steep drawdowns. The worst was 78.3%. As a result, the Sharpe Ratio (volatility adjusted performance measure) is well-below the performance of the S&P 500.
Portfolio Visualizer
Over the past five years, the company has returned 11.3% per year. The standard deviation during this period is 27.6%, which means not a lot changed when excluding drawdowns like the one during the Great Financial Crisis.
The good news is that CI shares aren’t overpriced. Using the company’s $81 billion market cap and $24.7 billion in net financial debt (2023 expectations) gives us an enterprise value of roughly $106 billion. That’s 8.8x next year’s EBITDA estimate of $12.0 billion.
TIKR.com
This valuation is in the middle of its post-2018 acquisition valuation range.
Adding to that, the company is expected to end up with a book value of $157.3 per share in 2023. That would imply a price/book ratio of 1.63x. This, too, is “average”.
Takeaway
The Cigna Corporation is a very interesting dividend growth stock. The healthcare provider is not only a free cash flow machine, but also in a good spot to deliver strong earnings growth thanks to its business model. The company is likely to maintain double-digit free cash flow yields in the years ahead, used to aggressively buy back shares and maintain double-digit dividend growth. Its balance sheet is healthy, which means shareholder returns are prioritized.
The only drawdown is that the company is very volatile. While I have little doubt that CI shares will outperform the market, investors need to brace for regular weakness.
Speaking of weakness, the valuation is fair. It opens the door for investors looking to buy healthcare dividend growth and a 1.8% yield.
(Dis)agree? Let me know in the comments!
Be the first to comment