

MCCAIG
Introduction
After writing an economy-focused article last week, it’s time to dive deeper into market fundamentals. The S&P 500 is once again in a bear market, which comes with opportunities. Unfortunately, the decline is warranted as economic fundamentals have weakened quite significantly. Even worse, the Federal Reserve is determined to fight inflation, even if it means risking further economic damage. As a result, we’re not just dealing with a bear market, but also investor sentiment at levels not seen since the Great Financial Crisis bottom, tremendous pressure on earnings, and chances that rates could rise even further than expected.
In this article, I will try to make sense of it all focusing on the potential direction of the market. I’m also going to tell you how I’m dealing with this situation, including the investments I added recently.
So, buckle up, and let’s dive into the details!
The Fed Is In A Pickle
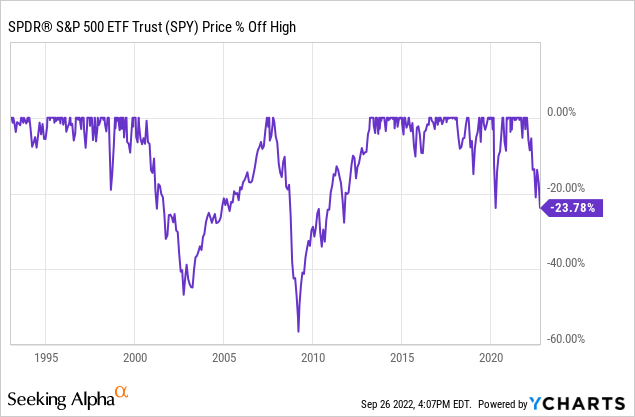
The S&P 500 has lost a quarter of its value since the start of this year. We’re now once again in a bear market after the one in 2020 ended after just 33 days and a decline of 33.9%. It was the shortest bear market in the S&P 500’s history according to data collected by Hartford Funds.
Unfortunately, the reason why the bear market ended so quickly in 2020 is also one of the reasons why we’re now in a bear market again – ironic isn’t it?
As I wrote last week, the pandemic saw major economic lockdowns that harmed, or should I say “destroyed”, some supply chains. Inventories were empty when the demand came roaring back. At the same time, central banks were easing at a record pace as the world’s largest central banks added 50% to their balance sheets – or more than $10 trillion in less than two years.
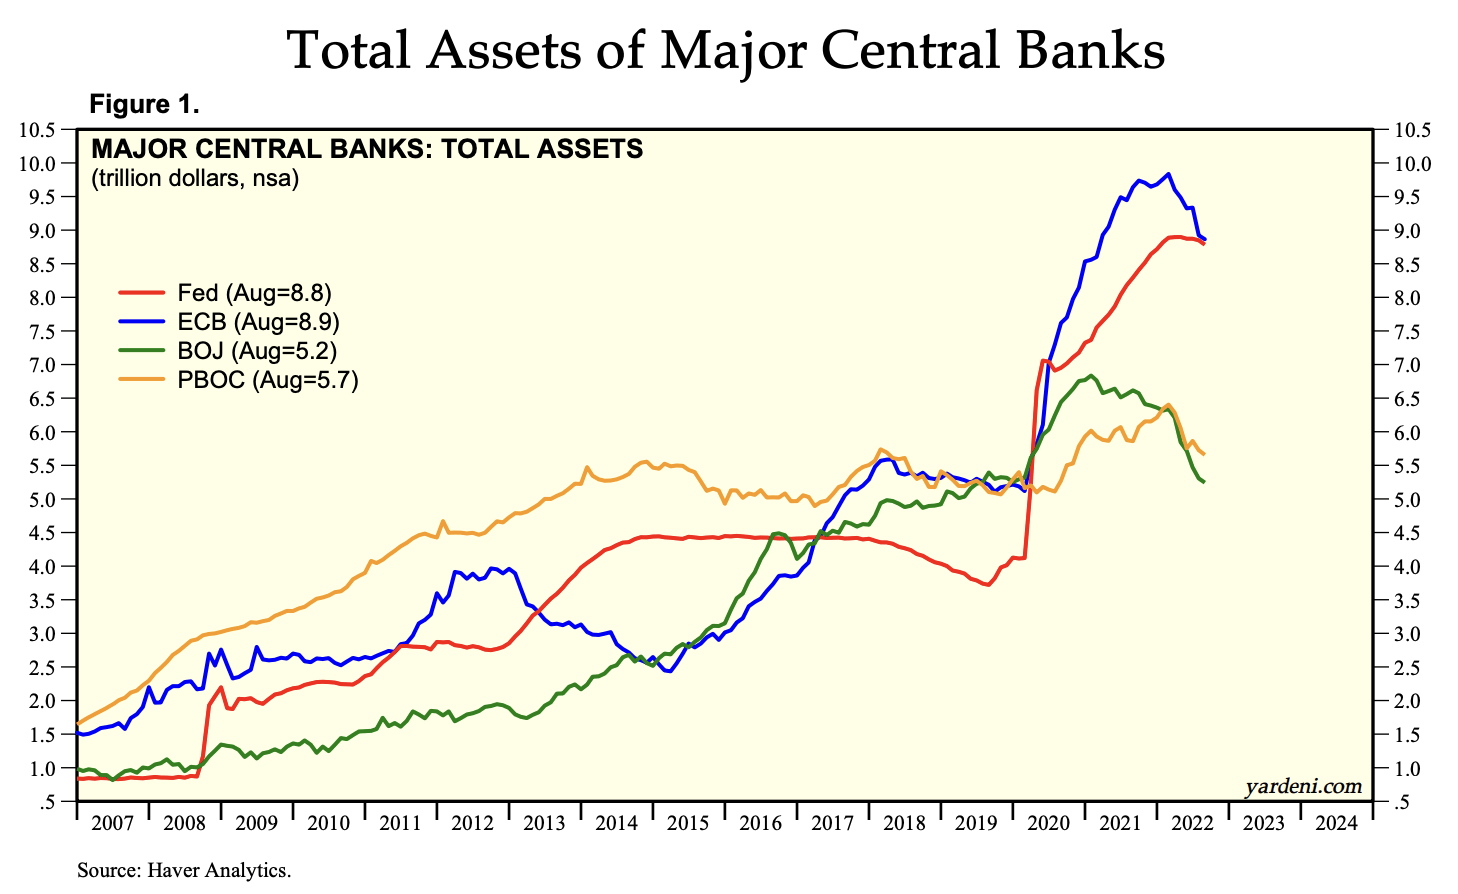
Yardeni Research
As a result, an increasing amount of money started to chase a decreasing number of goods and services. On top of this, governments engaged in large stimulus programs that ended up in consumers’ pockets, which further increased the velocity of money.
Add to this that major commodities like oil are seeing severe supply issues and we get a situation of persistent inflation at levels not seen since the 1980s.
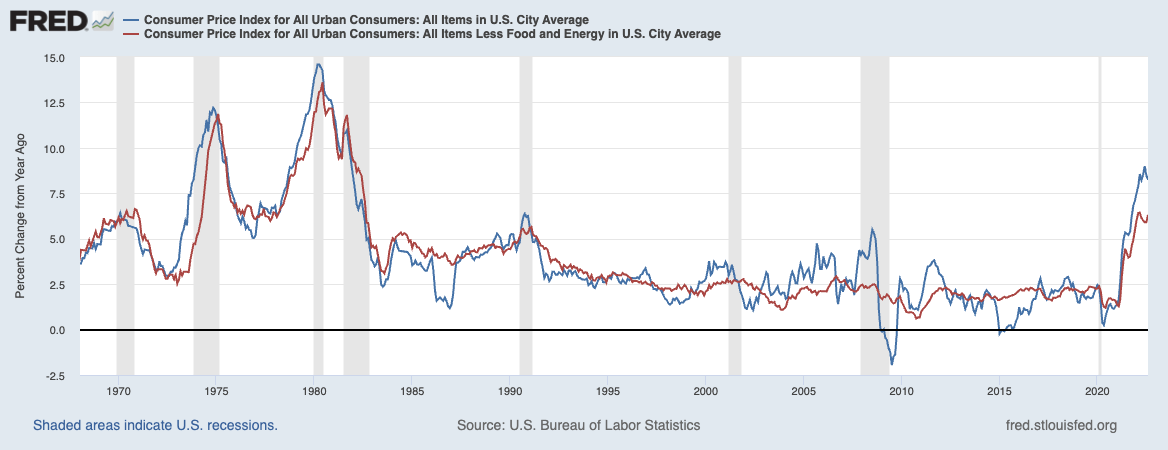
St. Louis Federal Reserve
What we are now dealing with is a very tricky situation as the Federal Reserve is fighting inflation in a situation where economic growth is rapidly falling. According to Ned Davis, global recession models are indicating a severe recession as the overview below shows.
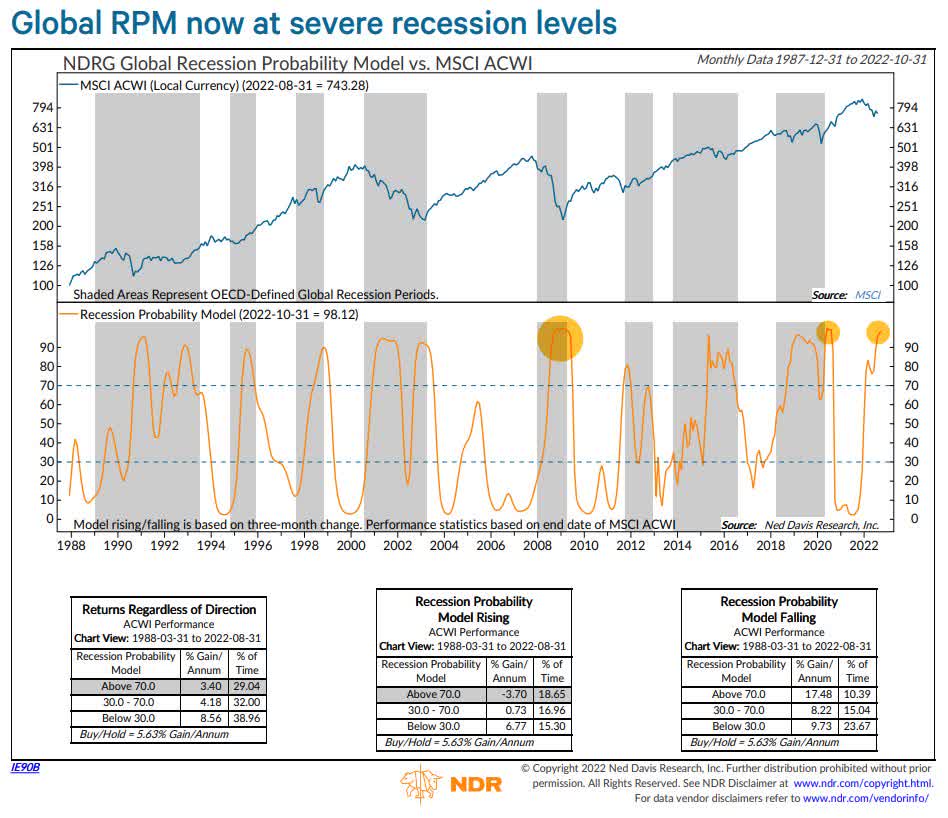
Ned Davis Research
The difference, this time, is that the Fed isn’t expected to jump in to rescue the market. After all, it’s still fighting inflation. Right now, the Fed is expected to end up with a terminal rate (range) of 4.50% to 4.75% going into the first quarter of 2023. The current rate is 3.00% to 3.25%, which means we’re looking at another 150 basis points of hikes.
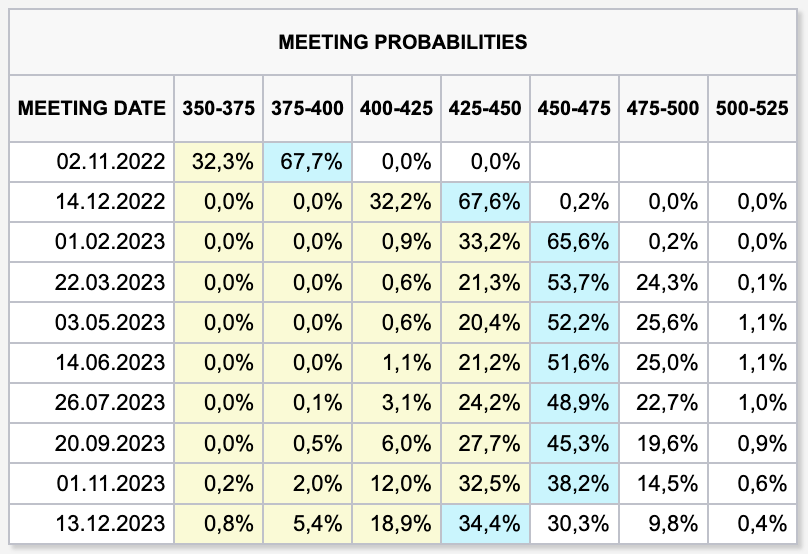
CME Group
With that said, I believe that it is extremely important to visualize the current situation. We’re in a bear market, economic growth is slowing, and the Fed is hawkish.
However, the Fed isn’t even *that* hawkish as we are barely in neutral territory.
The following chart shows the Federal Reserve’s overnight funding rate. It also shows whether the Fed is restrictive, neutral, or accommodative.

CME Group
While definitions vary, CME Group (where I got this chart from) used the following definition:
The “neutral” rate is thought to reside at a level that equals or slightly exceeds longer-term inflation expectations. With long-term inflation expectation probably in the 3% territory, the Fed would not get to “neutral” until short-term rates were raised to more like 3.5% or so.
Now, the problem is that it’s hard to determine long-term inflation expectations. The 5-year/5-year forward inflation rate is at 2.3%. This means the average inflation rate for the five years starting five years from now is expected to be 2.3%.
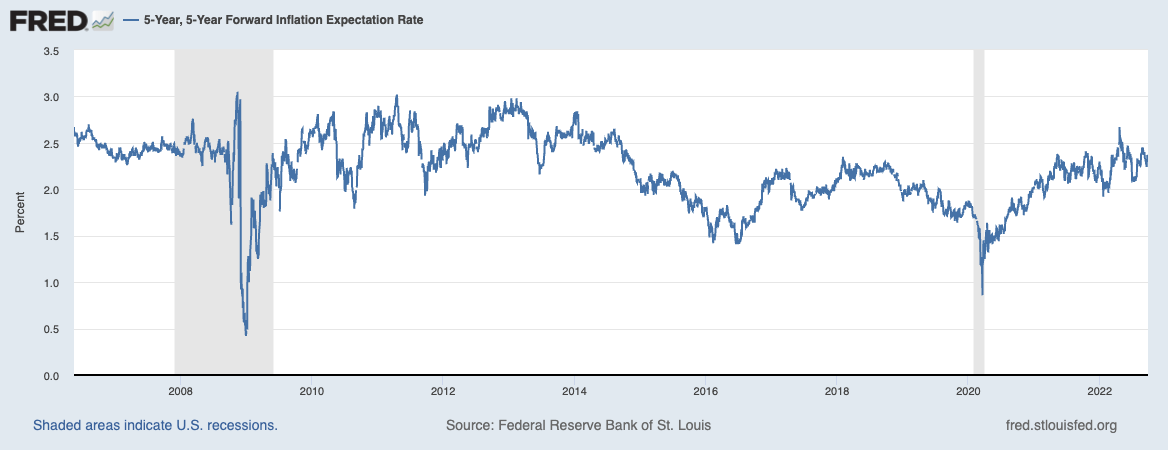
St. Louis Federal Reserve
The University of Michigan’s 5-year inflation expectations rate is now at 2.8%.
When combining the effective federal funds rate and the chart above, we get a situation where the Fed’s policy is neutral at best. In other words, if inflation remains “sticky”, current rate estimates aren’t even too hawkish.
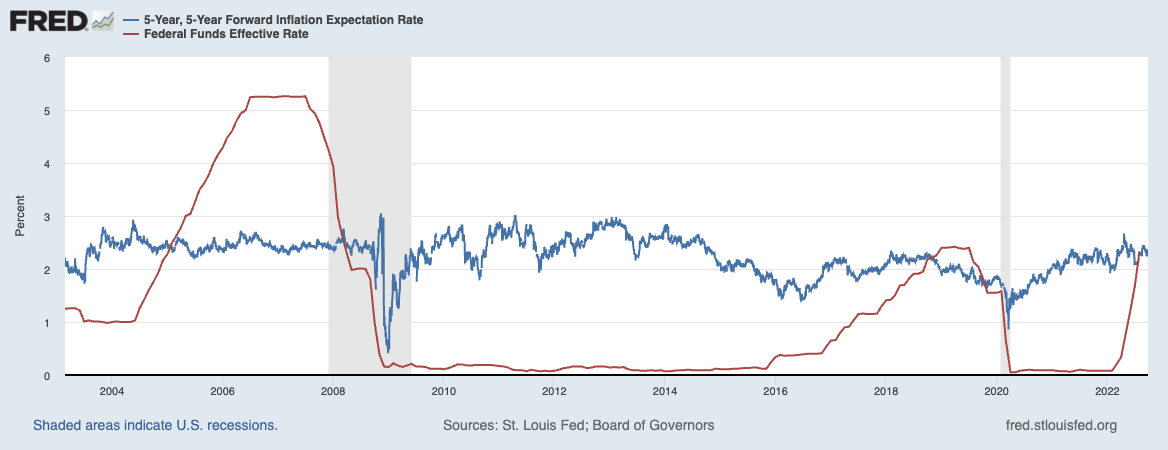
St. Louis Federal Reserve
This is what worries investors so much. We’re in a tough spot, economically speaking, yet most market participants know that the Fed isn’t done yet.
I believe that the Fed knows what will happen to commodities if it starts to pivot too early. Demand expectations will bounce back, inventories are low, supply issues are persistent, and the combination of all of this provides a path for a new wave of inflation.
Everyone Is Bearish
As the CME Group (CME) chart above shows, the Fed’s policies have been very accommodating since 2009. Inflation was subdued, and rates were even lower.
There was no alternative for stocks. Also often referred to as “TINA”, which stands for “there is no alternative”.
However, now there is. Goldman Sachs introduced TARA, standing for “there are reasonable alternatives”.
Both stocks and bonds have been falling in lockstep, creating a scenario where bonds are attractively priced with decent yields.
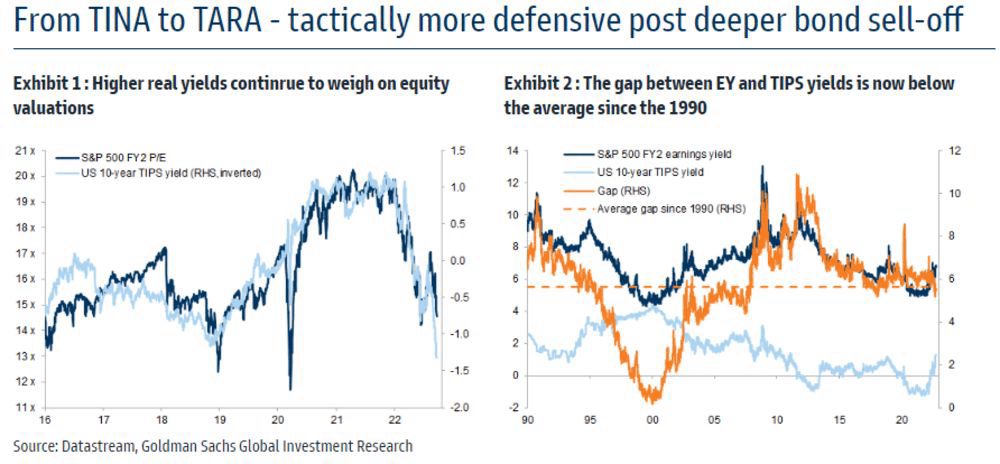
Goldman Sachs
As a result, major banks are now turning bearish:
As stock market volatility continues to rise, JPMorgan Asset is also sticking to its underweight on equities heading into the fourth quarter. The firm ‘strongly’ favors investment-grade credit over high yield, Sylvia Sheng, global multi-asset strategist, wrote Tuesday, anticipating sluggish growth in the US and recession in Europe over the next 12 months.
[…] The days of the TINA — There Is No Alternative — mantra for stocks are over, the Goldman strategists wrote. While falling yields had burnished the appeal of equities since the global financial crisis, “investors are now facing TARA (There Are Reasonable Alternatives) with bonds appearing more attractive,” they wrote.
Goldman slashed its 2022 S&P 500 target to 3,600, which is down from 4,300.
And it’s not just professionals who are turning their backs on the market. The CNN Money Fear & Greed Index is back in “extreme fear” territory.
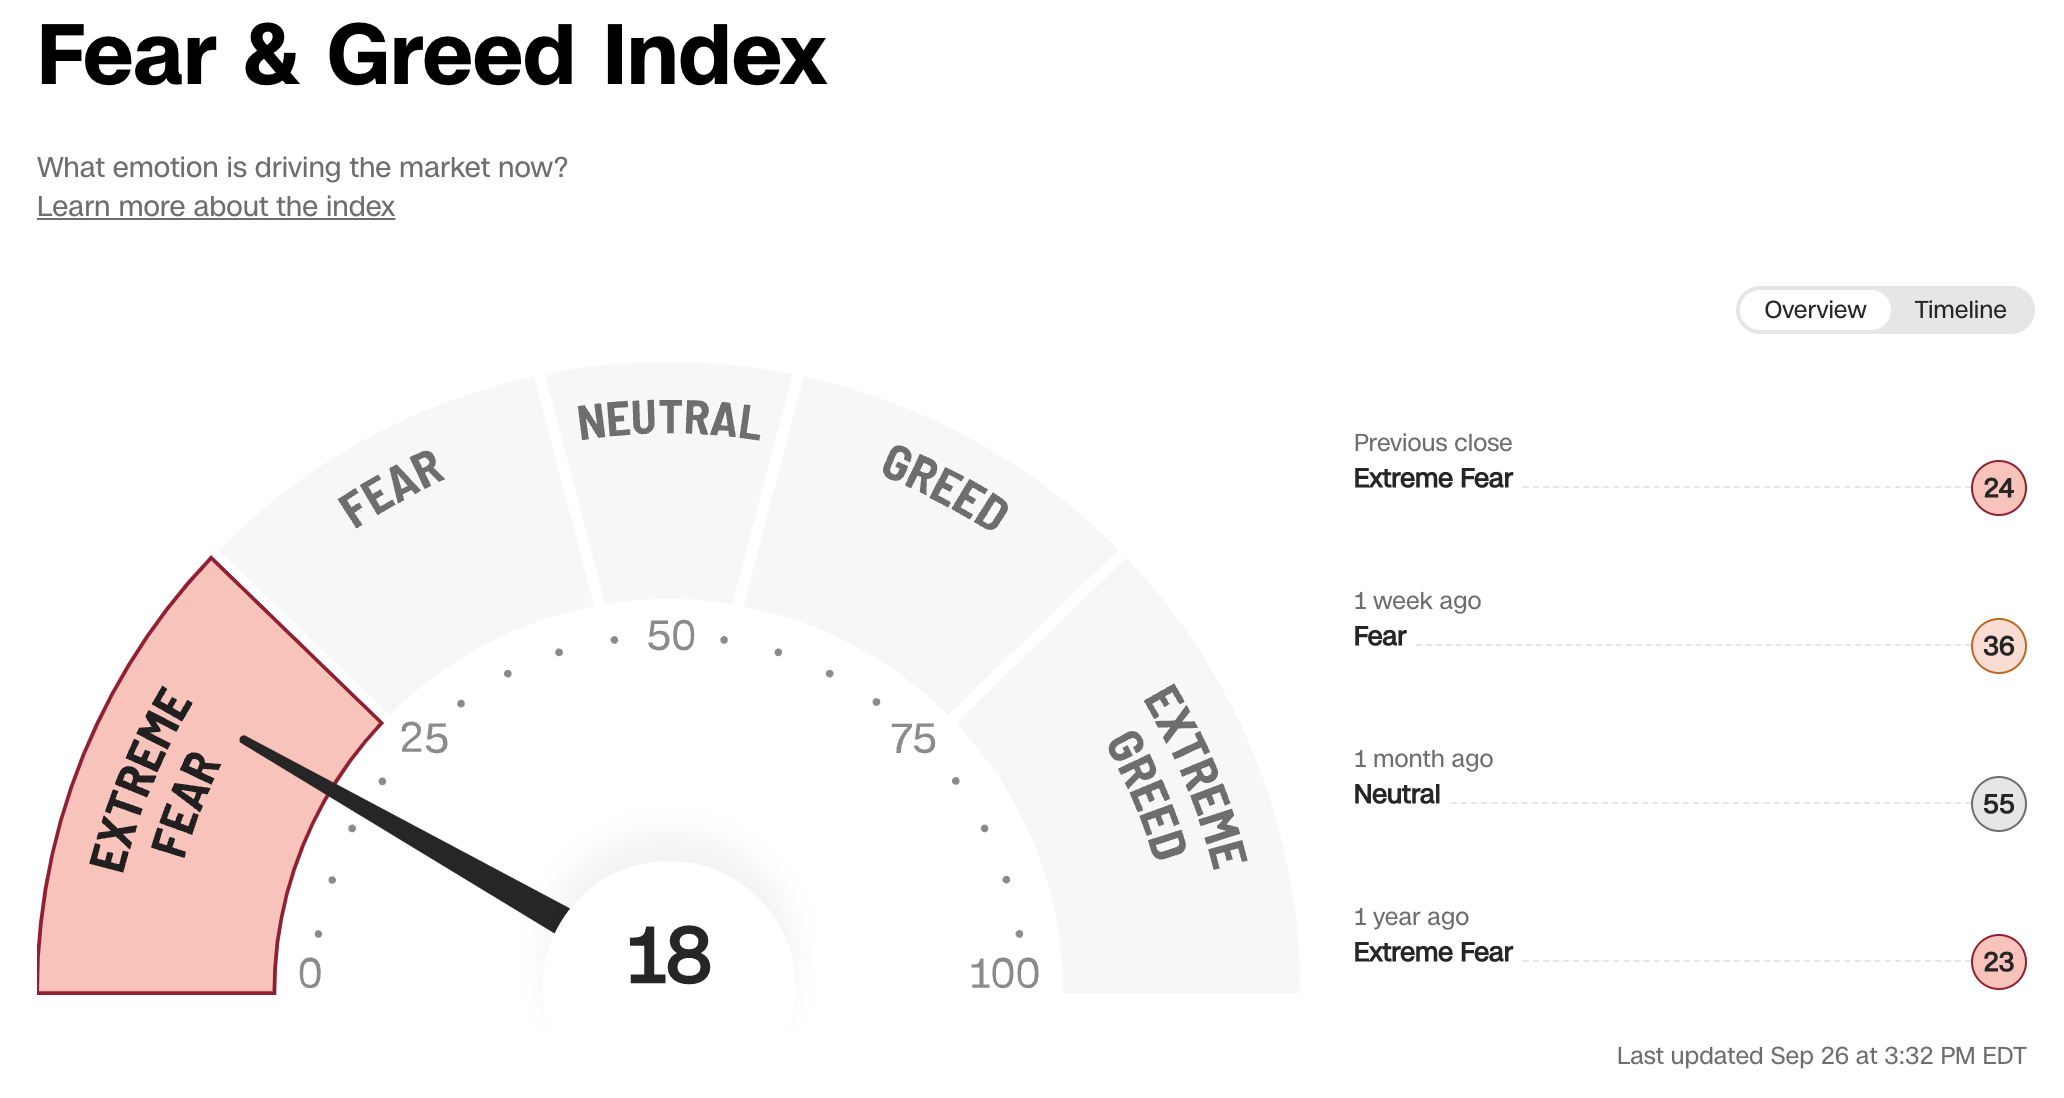
CNN Money
The index above is objective (albeit influenced by subjective indicators). It relies on indicators like option activities, volatility, and market breadth.
Market breadth is indeed very bad. Using one of my favorite indicators, we see that fewer than 13% of S&P 500 stocks are trading above their 200-day moving average. That’s as bad as it was in December of 2018. In 2020, that number came close to zero percent as only a handful of healthcare and related stocks were doing well.
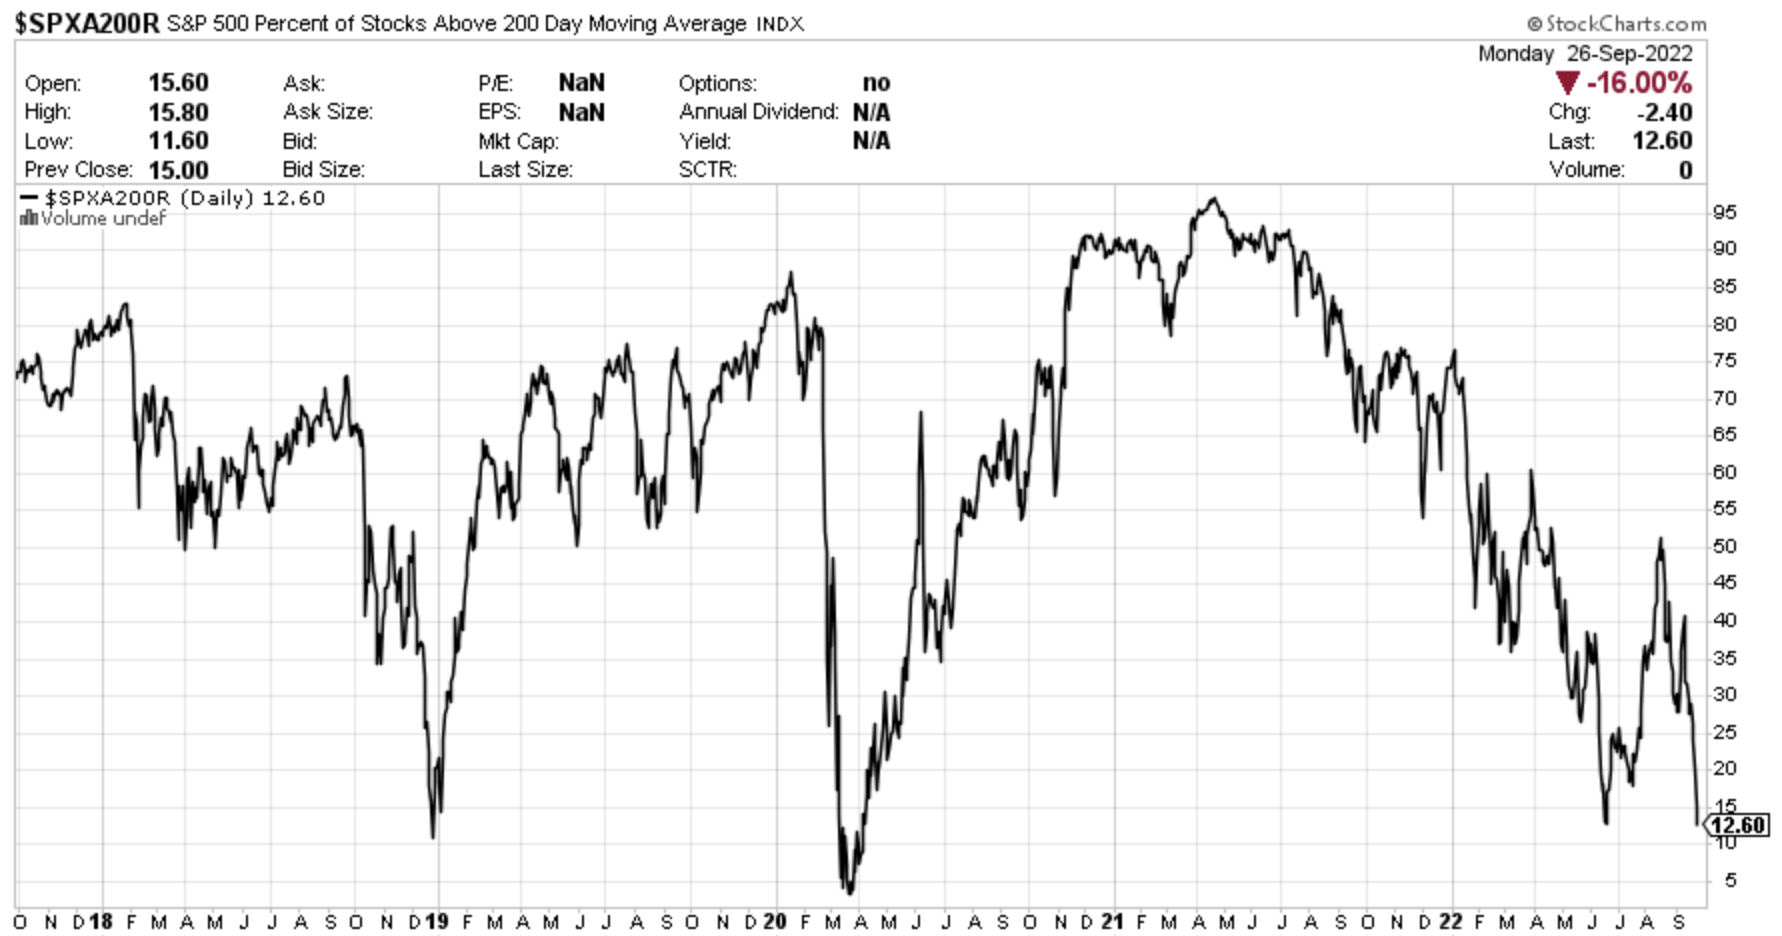
StockCharts
The next indicator is completely subjective. The AAII Investor Sentiment Survey, which measures whether investors feel bearish or bullish, has hit its lowest level since 2009. That’s quite something. As of September 21, more than 60% of participants feel bearish. Only 17.7% of participants were bullish.
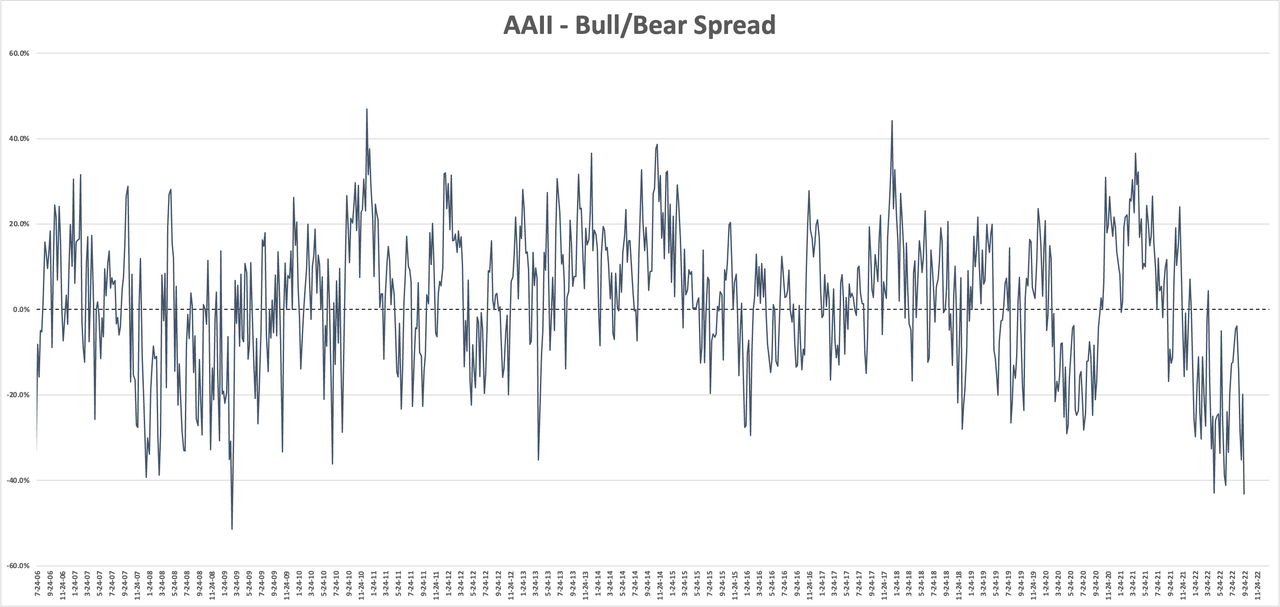
Author
Bloomberg looked into the probability of a rebound after bearish sentiment went to an extreme level (at least two standard deviations). The result can be seen below:
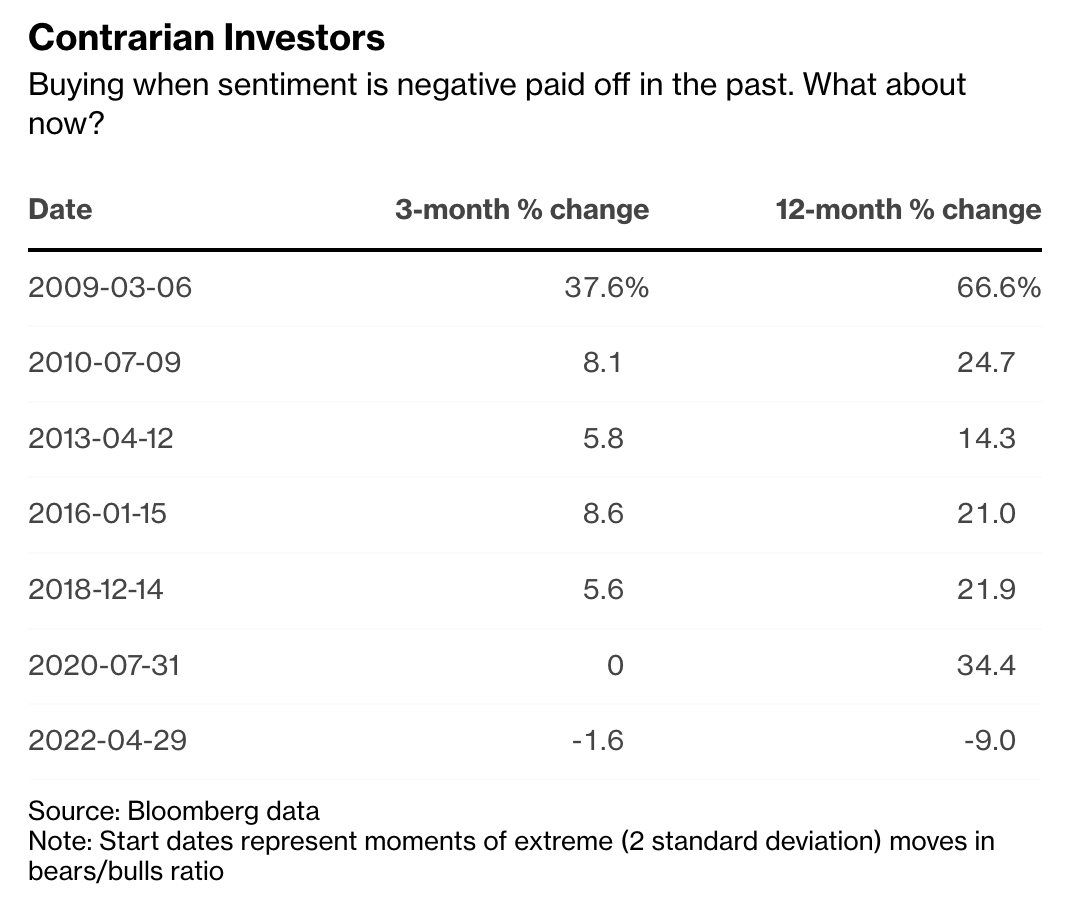
Bloomberg
Moreover, according to my data, markets have now priced in a recession.
The S&P 500 is pricing in severe manufacturing weakness as the chart below shows. This is likely to be worse than in 2014/2015 when global manufacturing weakness caused recession risks to spike. Back then, the consumer was stronger, which meant the S&P 500 was in a much better place.
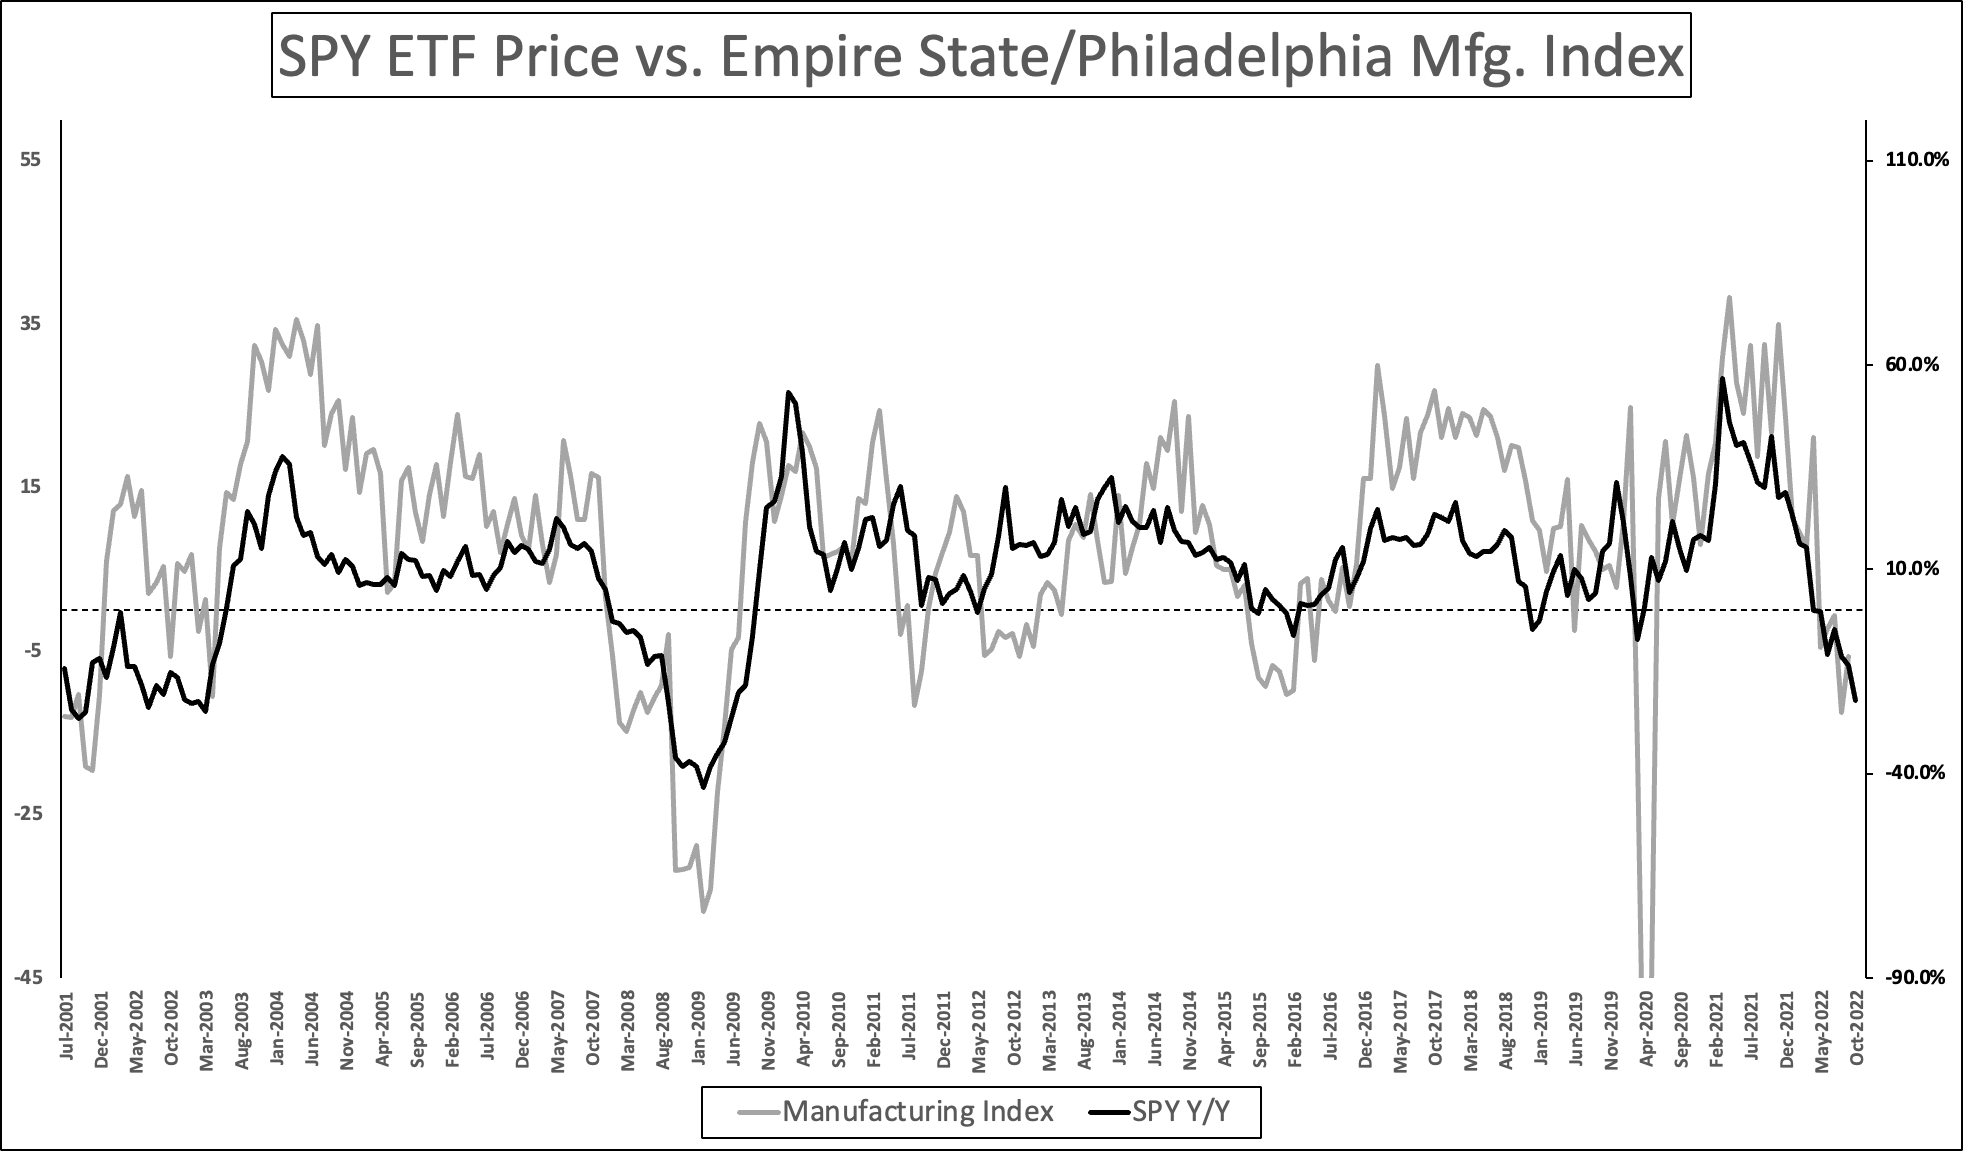
Author
That is currently not the case as we have discussed in this article.
Hence, Morgan Stanley’s CIO came out saying we could “face a day of reckoning”.
I’m bringing this up because Morgan Stanley made a great point with regard to investors’ ability to price in economic (negative or positive) growth:
The problem is that equity investors tend to only be good at translating economic data into earnings forecasts six months ahead, meaning that any current earnings tailwinds could be supporting “a false sense of security.” Yet policy operates with longer lags, sometimes of as much as two years.
“This bear market is not over and investors should expect more negative surprises if they continue to underestimate the impact of rapidly rising interest rates,” she wrote in a note, adding that a fourth-quarter bear-market rally should be sold.
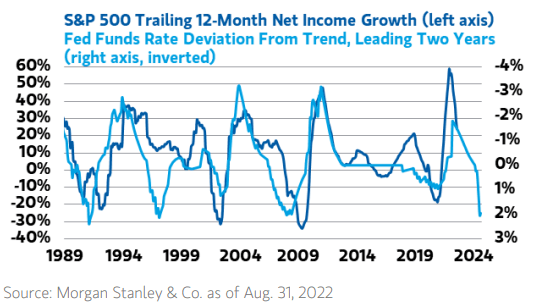
Morgan Stanley
In other words, a lot of earnings weakness has been priced in. Investors and traders are extremely bearish, and the market could be due for a bounce. However, because the market is facing more risks than mid-term earnings weakness, a bounce could be sold in 4Q22.
It also doesn’t help that valuations are still not at very depressed levels.
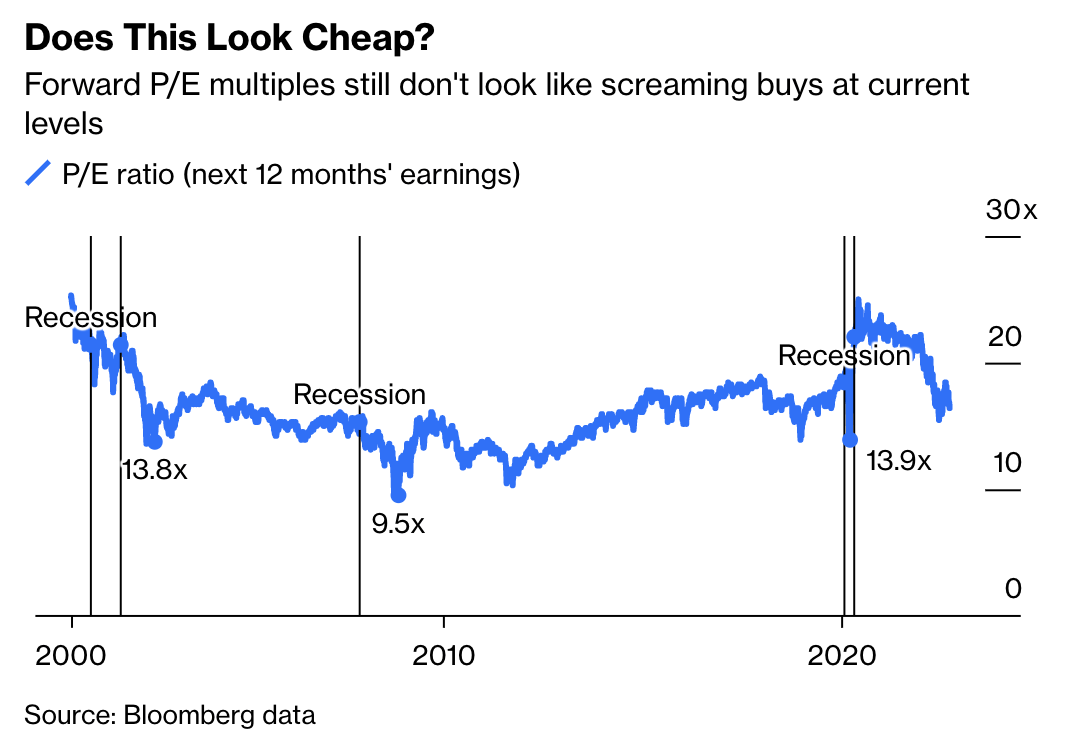
Bloomberg
What I’m Doing & Why One Shouldn’t Panic Sell
By now, I think that almost everyone knows that I have almost every penny of my net worth invested in long-term (dividend growth) investments. As much as I like to forecast what’s about to happen, there is no way of knowing anything for sure.
Forecasts create the mirage that the future is knowable.
– Peter Bernstein
Hence, my strategy is to work on my portfolio and my watchlist, which includes the companies that I like and do not own – I discuss all of them on Seeking Alpha.
Whenever I like the valuation of a stock, I invest in it.
This week, I doubled my positions in Norfolk Southern (NSC) and Home Depot (HD). These were my smallest positions. Both have come down a lot. Both have attractive yields, and both are among my all-time favorite dividend stocks.
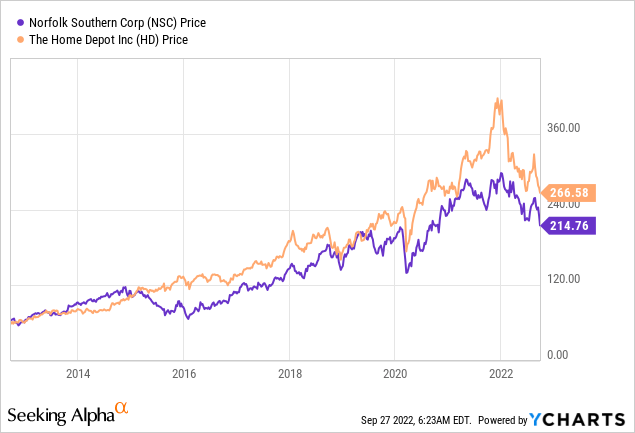
My thinking process was simple. I know both companies very well. Both have entered challenging economic times. However, I also know that both will rebound eventually and more than likely outperform the market by a wide margin on a very long-term basis. Even if both continue to fall, I like the opportunity to buy both well below their all-time highs.
In other words, I’m not doing anything differently.
In bear markets, people tend to make the worst mistakes. Some start to actively trade to use volatility to their favor (this rarely works), while others sell stocks to buy once the market bottoms – this also rarely works.
Sticking to your strategy is extremely important. Especially in bear markets. We’re now bombarded by recession and fear-loaded headlines, hyped-up people on social media, and other psychological influences.
One of the many reasons why I am not selling a single share is that it is important to benefit from the good days in bear markets and the surges in early bull markets. According to Hartford Funds:
Half of the S&P 500 Index’s strongest days in the last 20 years occurred during a bear market. Another 34% of the market’s best days took place in the first two months of a bull market—before it was clear a bull market had begun.
While the chart below isn’t updated, it perfectly supports my case. If investors missed the best 25 trading days since 1990, they would have underperformed five-year treasury bonds. Again, bear in mind that the best trading days occur in bear markets.
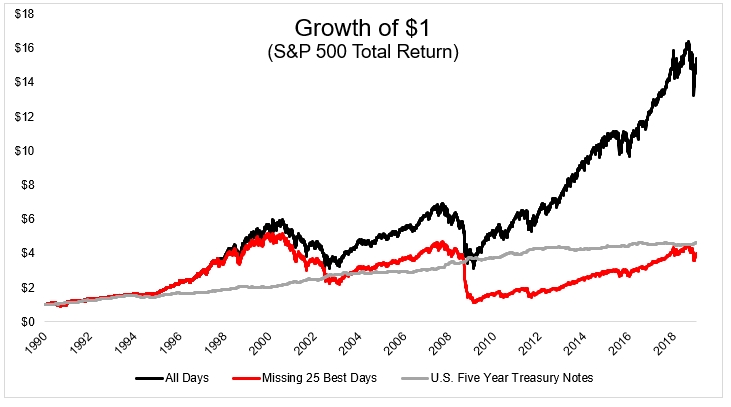
The Irrelevant Investor
With that said, here’s the bottom line.
Takeaway
The market has become a total mess. Economic growth is slowing dramatically, yet the Federal Reserve is not willing to step in as it aims to reduce persistent inflation.
The worst part is that the Fed isn’t even overly hawkish yet. If anything, rates just made it into neutral territory, which means more work will likely be needed to get inflation down to acceptable levels.
On top of high market volatility, this is resulting in an alternative for stocks as bonds have fallen in lockstep with stocks, providing investors with an alternative to “TINA”. This underlines that we’re indeed in a new environment for stocks for the first time since the start of the Great Financial Crisis, which marked the start of a long zero/low-interest rate period.
That said, the odds for a short-term bounce are good. The market is extremely pessimistic. The AAII bull/bear spread has reached its lowest level since the Great Financial Crisis, barely any companies are trading above their 50-day moving average, and overall sentiment is downright ugly.
The bad news is that this won’t necessarily be the bottom of the bear market. If anything, it is likely nothing more than a bear market rally as earnings are more than likely under pressure for more than six months.
As bad as that may sound, I am not changing my strategy. I am buying companies on my watchlist on weakness. On a long-term basis, that’s the best way to build wealth. It is also important that long-term investors refrain from panicking as that almost guarantees long-term underperformance.
So, to summarize this somewhat bearish article, I expect a bounce, but I do not expect a market bottom until the Fed pivots. I believe that this can happen somewhere in the first two quarters of 2023.
Be prepared, but as I said in my prior article, don’t be worried as long as you take care of your risk management.
(Dis)agree? Let me know in the comments!
Be the first to comment