

Olivier Le Moal
By Indrani De, Global Head of Investment Research
The value rotation story has been hard to miss – it’s a trend that’s been underway since late 2020 and has since continued to gather steam. A theme often heard in the narrative is that value had been floundering relative to growth for a long stretch leading up to the rotation.
However, a closer look at performance and relative valuations over the longer term reveals the value factor has been alive and well for decades.
The perfect storm for a value rotation
As Central Banks respond to today’s inflationary environment with rate hikes, they’ve also introduced quantitative tightening. The resulting rising rates, reduced liquidity, and economic uncertainty have been key drivers behind the value rotation.
Rising real rates – the discounting factor for equity valuations – have had an outsize impact on growth company valuations, bulk of whose earnings and cash flows are, by definition, far into the future. And reduced liquidity has further compressed previously stretched growth company valuations. Economic uncertainty has also been a headwind for growth stocks, as investors shy away from the risks associated with companies that are forecast to grow in an uncertain future.
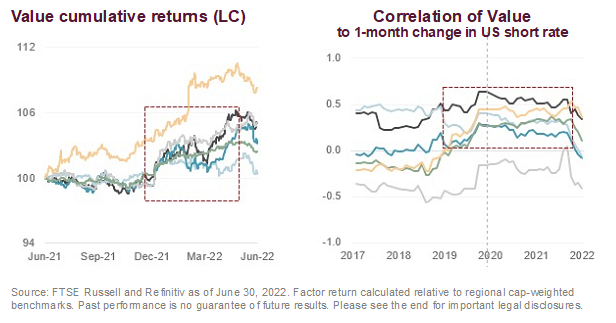
The impact of these trends is evident in recent returns. As shown in the graph, cumulative value factor returns have soared in recent months, as correlations with changes in US short-term rates have increased to an economically and significantly positive level – signaling a clear rotation into value.
Value’s relative track record isn’t just about performance
While value stocks have indeed rotated back into favor, relative performance alone doesn’t tell the entire story. It’s important to also examine how value and growth valuations compare over time.
In the chart below, the blue line denotes the value factor return from 1963 to the present. The line’s end point (E) indicates that if investors had allocated equal amounts to value and growth in 1963, today the value investor would be 5x as wealthy as the growth investor.
We can also observe that from 2007-2020, the blue line declined considerably as value fell out of favor. In fact, if the chart ended at the value factor’s peak in 2007, the value investor would have been 10x as wealthy as the growth investor.
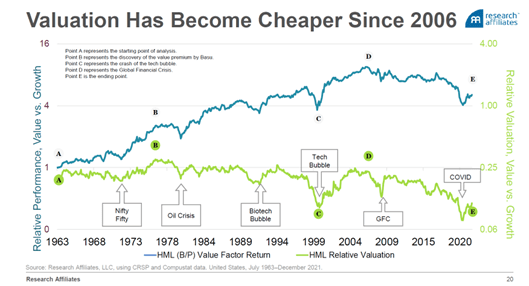
While the blue line does support the narrative that value lagged growth for five years prior to the value rotation, it’s important to also consider the green line’s trajectory during this time. The green line represents value’s cheapness relative to growth, as measured by price-to-book (P/B).
While on average relative valuation has hovered around 0.25 – meaning that growth is 4x as expensive as value – the graph indicates that during value’s underperformance from 2007-2020, growth became 12x as expensive as value.
The value factor: Alive and well from peak to trough
While each line is independently informative, Rob Arnott, Founder and Chairman of the Board of Research Affiliates, would draw our attention to the space between the blue and green lines.
“The key point in this graph lies in the gap between the two lines. That’s the structural alpha of value. You’ll notice that value has been consistently winning compared to its relative valuation over the past 60 years.”
If we examine the most recent stretch of value underperformance, we can observe that from its peak in 2007 to its trough in 2020, value underperformed growth by 58% but cheapened by 73%.
This disparity points to improving fundamentals – book value in this case – indicating that contrary to popular belief, the value factor was alive and well in the years leading up to the value rotation.
Cleanly capturing the value factor
While style indexes can be effective tools for navigating the value rotation, the FTSE RAFI Indexes can offer investors an alternative approach. Instead of weighting index constituents by market values, the indexes weight them using a composite of fundamental factors, including total cash dividends, free cash flow, total sales, and book equity value. This approach trims growth stocks and boosts value stocks to their fundamental weight – cleanly capturing the value effect.
As shown in the graph, cumulative value factor returns have soared in recent months, as correlations with changes in US short-term rates have increased to an economically and significantly positive level – signaling a clear rotation into value.
© 2022 London Stock Exchange Group plc and its applicable group undertakings (the “LSE Group”). The LSE Group includes (1) FTSE International Limited (“FTSE”), (2) Frank Russell Company (“Russell”), (3) FTSE Global Debt Capital Markets Inc. and FTSE Global Debt Capital Markets Limited (together, “FTSE Canada”), (4) FTSE Fixed Income Europe Limited (“FTSE FI Europe”), (5) FTSE Fixed Income LLC (“FTSE FI”), (6) The Yield Book Inc (“YB”) and (7) Beyond Ratings S.A.S. (“BR”). All rights reserved.
FTSE Russell® is a trading name of FTSE, Russell, FTSE Canada, FTSE FI, FTSE FI Europe, YB and BR. “FTSE®”, “Russell®”, “FTSE Russell®”, “FTSE4Good®”, “ICB®”, “The Yield Book®”, “Beyond Ratings®” and all other trademarks and service marks used herein (whether registered or unregistered) are trademarks and/or service marks owned or licensed by the applicable member of the LSE Group or their respective licensors and are owned, or used under licence, by FTSE, Russell, FTSE Canada, FTSE FI, FTSE FI Europe, YB or BR. FTSE International Limited is authorised and regulated by the Financial Conduct Authority as a benchmark administrator.
All information is provided for information purposes only. All information and data contained in this publication is obtained by the LSE Group, from sources believed by it to be accurate and reliable. Because of the possibility of human and mechanical error as well as other factors, however, such information and data is provided “as is” without warranty of any kind. No member of the LSE Group nor their respective directors, officers, employees, partners or licensors make any claim, prediction, warranty or representation whatsoever, expressly or impliedly, either as to the accuracy, timeliness, completeness, merchantability of any information or of results to be obtained from the use of FTSE Russell products, including but not limited to indexes, data and analytics, or the fitness or suitability of the FTSE Russell products for any particular purpose to which they might be put. Any representation of historical data accessible through FTSE Russell products is provided for information purposes only and is not a reliable indicator of future performance.
No responsibility or liability can be accepted by any member of the LSE Group nor their respective directors, officers, employees, partners or licensors for (A) any loss or damage in whole or in part caused by, resulting from, or relating to any error (negligent or otherwise) or other circumstance involved in procuring, collecting, compiling, interpreting, analysing, editing, transcribing, transmitting, communicating or delivering any such information or data or from use of this document or links to this document or (B) any direct, indirect, special, consequential or incidental damages whatsoever, even if any member of the LSE Group is advised in advance of the possibility of such damages, resulting from the use of, or inability to use, such information.
No member of the LSE Group nor their respective directors, officers, employees, partners or licensors provide investment advice and nothing in this document should be taken as constituting financial or investment advice. No member of the LSE Group nor their respective directors, officers, employees, partners or licensors make any representation regarding the advisability of investing in any asset or whether such investment creates any legal or compliance risks for the investor. A decision to invest in any such asset should not be made in reliance on any information herein. Indexes cannot be invested in directly. Inclusion of an asset in an index is not a recommendation to buy, sell or hold that asset nor confirmation that any particular investor may lawfully buy, sell or hold the asset or an index containing the asset. The general information contained in this publication should not be acted upon without obtaining specific legal, tax, and investment advice from a licensed professional.
Past performance is no guarantee of future results. Charts and graphs are provided for illustrative purposes only. Index returns shown may not represent the results of the actual trading of investable assets. Certain returns shown may reflect back-tested performance. All performance presented prior to the index inception date is back-tested performance. Back-tested performance is not actual performance, but is hypothetical. The back-test calculations are based on the same methodology that was in effect when the index was officially launched. However, back-tested data may reflect the application of the index methodology with the benefit of hindsight, and the historic calculations of an index may change from month to month based on revisions to the underlying economic data used in the calculation of the index.
This document may contain forward-looking assessments. These are based upon a number of assumptions concerning future conditions that ultimately may prove to be inaccurate. Such forward-looking assessments are subject to risks and uncertainties and may be affected by various factors that may cause actual results to differ materially. No member of the LSE Group nor their licensors assume any duty to and do not undertake to update forward-looking assessments.
No part of this information may be reproduced, stored in a retrieval system or transmitted in any form or by any means, electronic, mechanical, photocopying, recording or otherwise, without prior written permission of the applicable member of the LSE Group. Use and distribution of the LSE Group data requires a licence from FTSE, Russell, FTSE Canada, FTSE FI, FTSE FI Europe, YB, BR and/or their respective licensors.
Editor’s Note: The summary bullets for this article were chosen by Seeking Alpha editors.
Be the first to comment