


shutter_m/iStock via Getty Images
In the current macro environment, we are hit in the face every morning with more bad news. After reaching a new 40-year high in June, inflation remains top of mind for investors.
Investing is more critical than ever. The higher the inflation rate, the quicker cash loses value. In this context, staying in cash is not an option.
Many investment vehicles can help soften the blow of inflation, such as TIPS (Treasury Inflation-Protected Securities) and REITs (real estate investment trusts).
A diversified portfolio of stocks is an excellent way to beat inflation. Backtesting as far as possible, the results remain consistent:
- Stocks deliver the highest return over an extended period.
- Stocks will suffer more significant draw-downs when they have a bad year.
The chart below shows the range of stock and bond annual returns. The longer the holding period, the narrower the range of outcomes.
Over a 1-year timeframe, returns can go from a loss of -39% to a gain of 47%. However, the longer the time horizon, the less likely you will lose money. Over 20 years, investing in stocks has consistently yielded positive returns.
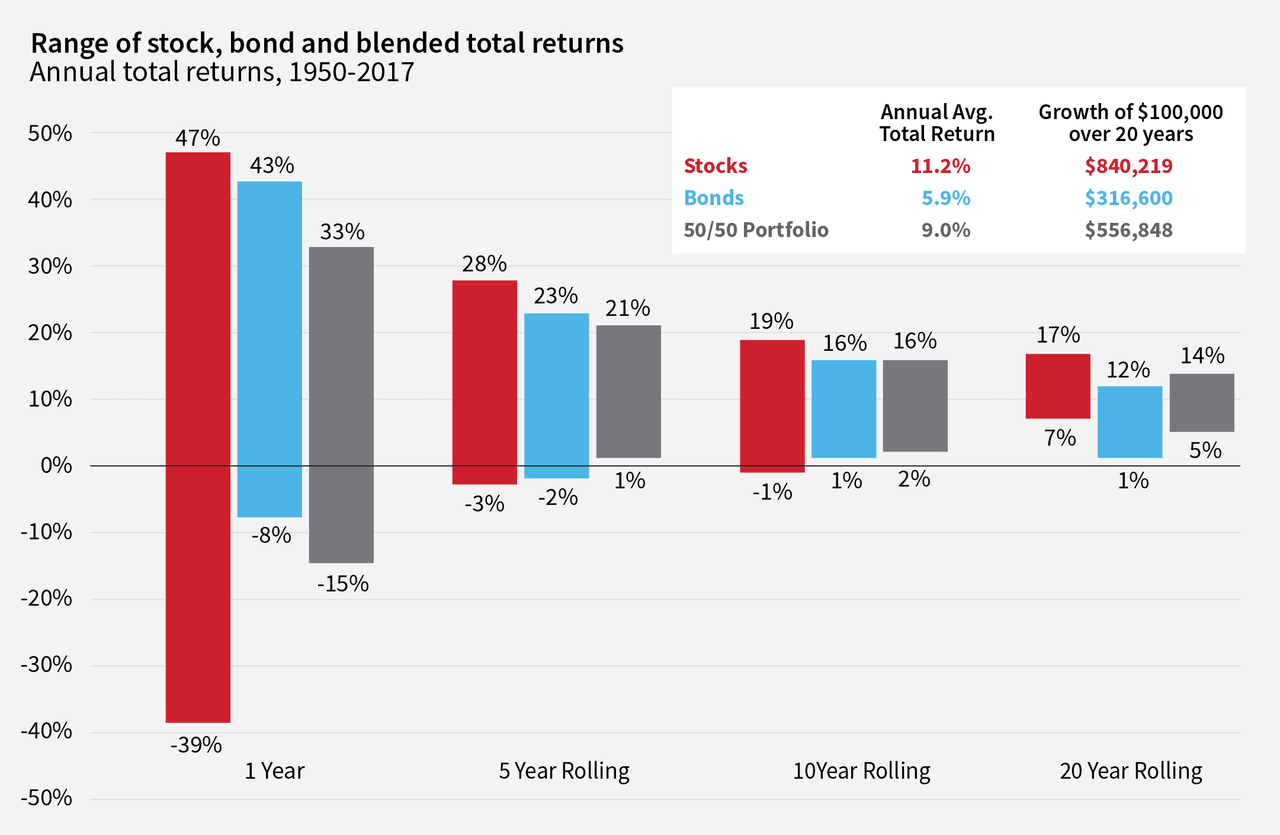
Range of Stocks and Bonds Returns (First Command)
According to US inflation data, the average and median annual inflation rate since 1914 has been ~3%. As a result, with the worst 20-year rolling period leading to a 7% annual return, stocks are a fantastic way to protect our assets against inflation over the long term.
However, while stocks perform well over time for investors who can expand their time horizon, not all businesses are inflation-proof.
So what should we be looking for?
For one thing, low-cost ETFs can provide immediate exposure to a diversified portfolio with exposure to the global stock market.
When it comes to individual stocks, there are certain qualities to look for if you are facing an inflationary environment.
Warren Buffett explained at a previous Berkshire Hathaway (BRK.A) (BRK.B) shareholder meeting that the best protection against inflation is:
- Your own earning power. You’ll continue to get your share of the economic pie over time, based on the value you provide.
- The earning power of a wonderful business that doesn’t require heavy capital investment.
The wisdom bombs dropped by Uncle Warren never cease to amaze me.
What is a wonderful business, you may ask?
In a letter to shareholders 40 years ago, Buffett wrote that companies that tend to withstand an inflationary environment must have:
- “An ability to increase prices rather easily” without fear of significant market share or unit volume loss.
- “An ability to accommodate large dollar volume increases in business” with only minor additional capital investment.
Because of their deflationary nature, I’ve been an investor in software businesses for a long time. Technology can help lower expenses and improve efficiencies.
Regardless of the sector or category, not all businesses are well-equipped to face high inflation. So let’s dive in and review the traits likely to help a business thrive in this environment.
1) High gross margin
In his most recent semi-annual letter, Terry Smith of Fundsmith explained the importance of a high gross margin:
Inflation causes an increase in the cost of the ingredients, components and other inputs which constitute companies’ Cost of Goods Sold (‘COGS’). The best defence against this inflation is a high gross margin — the difference between sales revenues and COGS. On average last year the companies in our portfolio had a gross margin of 60% compared with about 40% for the average large, listed company. Our companies make things for £4 and sell them for £10 whereas the average company makes things for £6 and sells them for £10. A 10% rise in the COGS clearly has much less effect on the profitability of the companies in our portfolio than the average. Moreover, if they want to compensate for say a 10% rise in COGS, our portfolio companies can achieve this with a much smaller price rise than the average company. The effect on COGS is not the only effect of inflation but it is clear that the high and sustainable gross profit margins of our companies provide a robust first line of defence.
I could not agree more with Terry Smith. I’ve used this approach for many years. On average, companies in the App Economy Portfolio have a gross margin of 62%, slightly ahead of Fundsmith.
A high gross margin is not only a positive trait to fight inflation but also a sign of a strong product/market fit.
According to Marc Andreessen:
Product/market fit means being in a good market with a product that can satisfy that market.
Here again, we can return to Uncle Warren to gain some wisdom. In the book Warren Buffett and the Interpretation of Financial Statements, David Clark and Mary Buffett review Warren’s threshold for gross margin.
According to Buffett, companies with a gross margin above 40% tend to have a competitive advantage, while companies below 20% suffer from fierce competition.
It’s essential to look at the gross margin over an extended period. Is it stable, improving, or worsening?
To illustrate, the chart below shows the quarterly gross profit margin of six different businesses:
- Three of them show a stable gross margin north of 70%, such as Paycom (PAYC), The Trade Desk (TTD), and Salesforce (CRM). These three companies are part of the App Economy Portfolio.
- Conversely, three of them show a gross margin below 40%, such as Criteo (CRTO), Spotify (SPOT), and Bed Bath & Beyond (BBBY). I would avoid these investments at all costs (though Spotify is showing signs of improvement that could be worth revisiting later on).
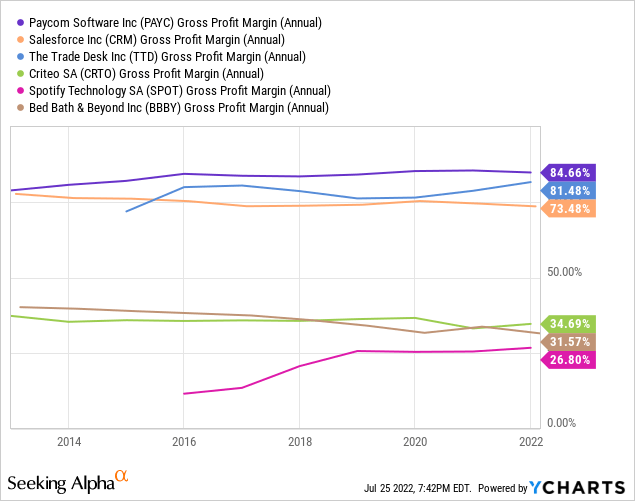
Overall, the gross margin of a business shows its capacity to withstand a rise in its cost structure without impacting its profitability.
2) Pricing power
Pricing power is a critical lever to fight inflation. It’s essentially the ability to raise prices without reducing demand and profitability.
Here again, Buffett says it best:
The single most important decision in evaluating a business is pricing power. If you’ve got the power to raise prices without losing business to a competitor, you’ve got a very good business. And if you have to have a prayer session before raising the price by 10 percent, then you’ve got a terrible business.
Unfortunately, not every company has this flexibility. It depends on how indispensable a product is and where it sits on the value chain.
According to the UBS Equity Strategy team:
With inflation pressures surging, pricing power relative to cost exposures will be a key theme and source of [absolute outperformance] for global equity markets.
Historically, whenever the two-year US breakeven inflation rate is above 2.5%, UBS noted that “companies with strong pricing power have outperformed their weak counterparts by nearly 14% on average over the next 12 months.”
The best businesses offer:
- A product that is needed and hard to replace.
- A price that is negligible to the customer compared to the benefit.
- A leading position in their category (market share, review score, etc.)
So how can we identify evidence of pricing power?
The financials can help find tangible evidence:
- High gross margin (as discussed above).
- Growing revenue (overall and per customer).
- Stable or expanding margins.
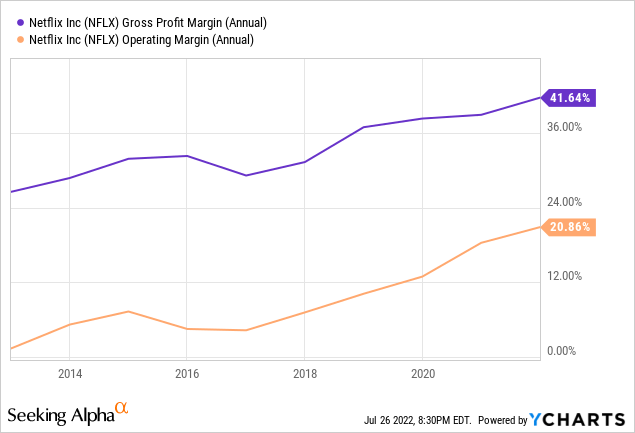
Netflix (NFLX) is going through a challenging time with two consecutive quarters of subscriber loss. However, looking at the performance in the past decade, the company has demonstrated a strong pricing power.
First, we can see multiple price hikes followed by a continued rise in subscribers.
Second, margins have steadily expanded over the years.
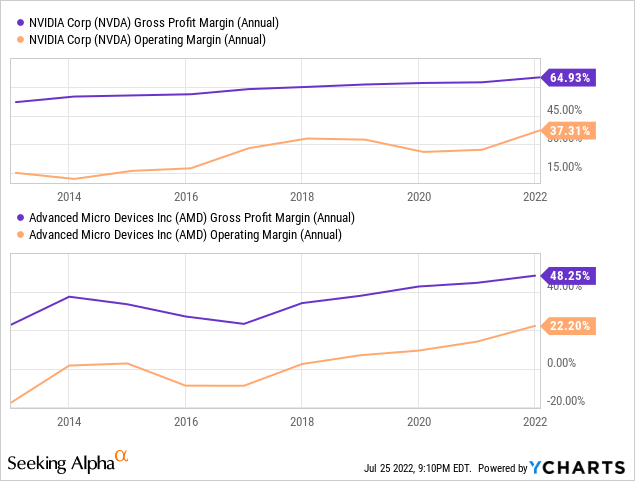
Other great examples of companies demonstrating pricing power are the chip designers NVIDIA (NVDA) and Advanced Micro Devices (AMD).
Many software companies add new features to their existing offerings or embrace a platform strategy leading to multi-product adoption (more on that later when we cover net retention).
Salesforce is the poster child, but other businesses have followed in the past decade, such as CrowdStrike (CRWD) or HubSpot (HUBS). They demonstrate their ability to scale by maintaining or expanding their margin while growing revenue at a fast clip.
I would be remiss not to mention most popular consumer brands like Apple (AAPL) or NIKE (NKE) that have demonstrated the strength of their brand name recognition over multiple decades.
3) Strong retention metrics
Since the release of the first iPhone in 2007, the world has shifted to cloud and mobile. The rise of the App Economy has impacted the past 15 years.
Since Marc Andreessen published his essay Why Software Is Eating The World in 2011, software companies have been some of the best-performing public equities.
Many categories are going through a digital transformation: entertainment, commerce, healthcare, finance, traveling, education, and more. As a result, companies across all sectors are now impacted by the trifecta of software businesses: acquisition, retention, and monetization.
Retention is an excellent indicator of a company’s product/market fit, and it’s the most important predictor of the longevity of a business. In addition, it’s more efficient and cost-effective to retain existing customers than to acquire new ones.
There are two essential types of retention to be aware of:
- Customer retention: The ability to retain customers over time. It’s a measure of customer loyalty. The maximum is 100%. A great example of a successful company is The Trade Desk, with customer retention of over 95% in the past eight years.
- Net revenue retention: It’s the percentage of revenue retained from existing customers over time. It’s a measure of customer engagement. It can be above 100% (if customers spend more over time).
Over the years, some customers pay for more services, some scale back their usage, and some leave altogether. As a result, the dollar-based net retention rate (or net revenue retention rate) is the ultimate performance indicator that tells you how much money a company is still making from a cohort of customers after a full year.
Sammy Abdullah, a co-founder of Blossom Street Ventures, explains:
Net dollar retention tells you what percent of revenue from current customers you retained from the prior year, after accounting for upgrades, downgrades, and churn.
If the dollar retention rate is above 100%, you are looking at a company that would be growing its top line even without adding new customers.
Some companies use their own definition of this metric or name it differently. It’s essential to read the fine print and understand the KPI you are looking at. For example, a company like Twilio (TWLO) shares its dollar-based net expansion rate as part of its earnings reports. A retention metric needs to include the impact of churn.
Churn measures the rate at which you are losing customers. It is usually measured as the percentage of customers who discontinued their subscriptions in the past year. The churn rate is immensely important for businesses that rely on a subscription model.
Jamin Ball, a partner at Altimeter Capital, does a fantastic job synthesizing SaaS company earnings and comparing their KPIs. After the first earnings season of the year, he posted a summary chart of the net revenue retention.
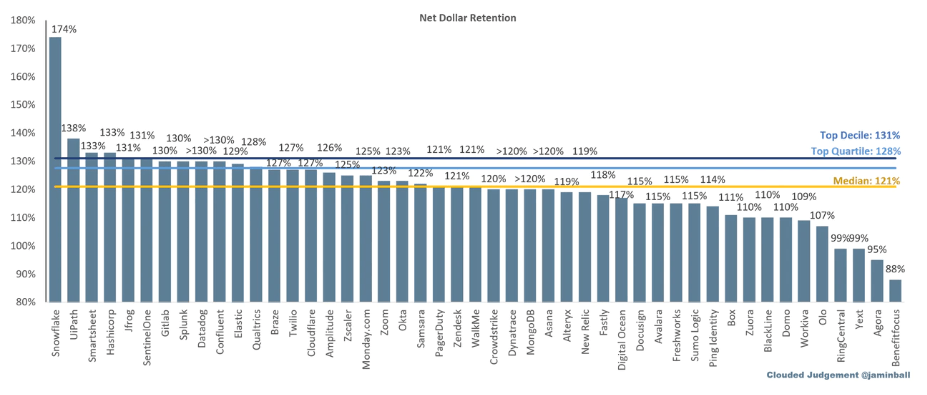
Net dollar retention Q1 FY22 (Jamin Ball, Clouded Judgment)
A recurring revenue model combined with a high net revenue retention rate is an excellent indicator of the sustainability of a business in the near term. In an inflationary environment, it’s a desirable trait to look for. It’s a tangible way to assess the health of a service, its sustainability, and its relevance to customers.
Since this KPI is so important, you’ll often find a strong correlation between the net revenue retention and the valuation of a company. In other words, be careful before investing in SaaS companies with a cheaper valuation. As with most things in life, you often get what you pay for.
4) Capital efficient growth
Capital efficiency measures how efficiently a company uses its cash to run its operations and grow.
There are several ways to measure capital efficiencies, such as ROCE (return on capital employed) or the cash flow margin trends relative to the overall growth of the business.
Below is an excellent example with Docebo (DCBO). The company grew its ARR (annual recurring revenue) by more than 10X since 2016 to $118M while only using $13M in cash from operations.
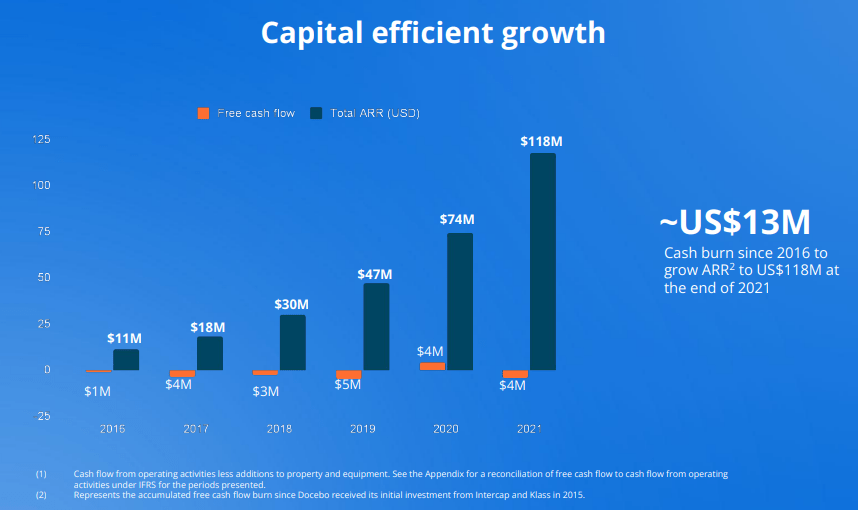
Capital Efficient Growth example (Docebo Company Earnings Presentation)
This article provides more details on how I look at the company’s recent performance.
High inflation has led to a hawkish Federal Reserve with multiple rate hikes planned in the months ahead. As a result, raising capital in this environment will become increasingly challenging.
As a result, companies with breakeven or positive cash flow margins are better positioned to stay in control of their destiny.
In addition, I tend to solely focus on companies with a significant net cash position on their balance sheet. Net cash refers to a company’s cash balance (cash and short-term investments) after deducting its liabilities.
A large net cash position allows a company to stay dynamic and flexible. It can fund several quarters of a slowdown in activity when large enough. Given the consensus around an upcoming recession, it could prove essential.
In their book, Warren Buffett and the Interpretation of Financial Statements, Mary Buffett, and David Clark touch on long-term debt. They write:
“Warren has found that a company with [a] durable competitive advantage spins off a lot of cash and has little or no need for debt.”
To assess a company’s financial health, you can divide its long-term debt by its free cash flow over the past 12 months. By doing so, you can determine how many years the company would take to pay off its long-term debt with its existing cash flows.
Buffett’s historic purchases indicate that a company should have sufficient yearly free cash flow to pay all long-term debt within 3 or 4 years.
There are exceptions and extenuating circumstances. However, if you see a company with a net debt position and an FCF to debt ratio below 25%, you might want to think twice before adding it to your portfolio.
5) Asset-light
The growing shift toward digitization is poised to benefit asset-light companies.
Ernst & Young provides the following definition:
We define asset-light companies as those that have a five-year PPE (property, plant and equipment) to sales ratio average lower than their respective sector mean.
The global pandemic has disrupted many businesses overnight, upending the service and travel industries and disrupting supply chains globally. It perfectly illustrates how companies can be impacted by a black swan event with a wide range of outcomes.
Even mega caps like Alphabet (GOOG), Meta (META), or Amazon (AMZN) are inherently asset-light. Additionally, the companies of the App Economy shine on this feature because their main cost is their headcounts:
- Enterprise software like CrowdStrike or Datadog (DDOG).
- Digital platforms like Match Group (MTCH) or Airbnb (ABNB).
- Marketplaces like Etsy (ETSY) or Fiverr (FVRR).
- Fintech like Visa (V) or Block (SQ).
The recent earnings report from Walmart (WMT) shows the challenges stemming from monitoring inventory levels. Large retailers in many categories suffer from pricing pressure on their inventory, with some products becoming obsolete in weeks or generating high costs if they don’t find a buyer.
EY previously highlighted that asset-light companies had outperformed their asset-heavy peers on total shareholder returns by four percentage points in the five years leading to COVID.
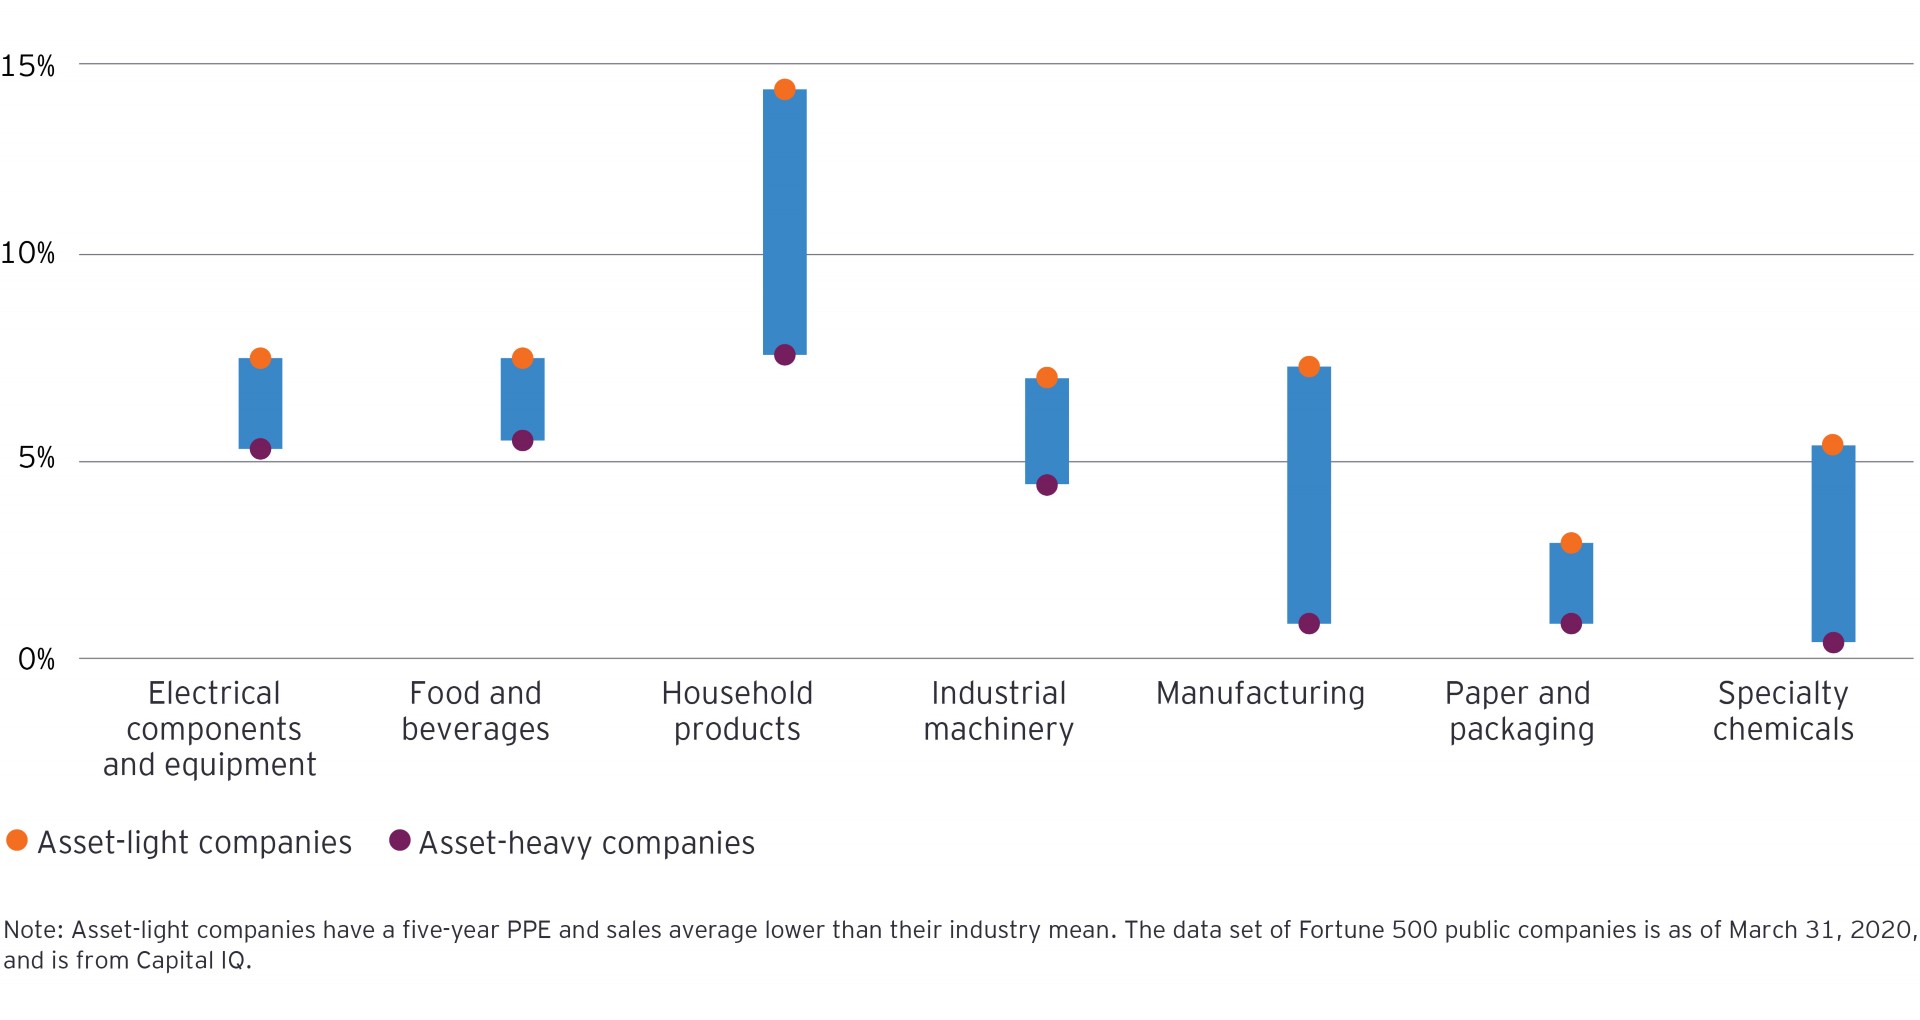
Asset-light outperformance (Ernst & Young)
In particular, EY emphasized several benefits of the asset-light model:
- Revenue opportunities: Great management focus on next-generation customer needs and new offerings.
- Innovation: Leveraging collaboration to drive new products, sustainability, and speed to market.
- Complexity reduction: Reduces operational complexity (e.g., suppliers, SKUs, personnel).
- Cash and margins: Improve gross margin and release cash tied to assets.
- Asset leverage: Drive higher returns on capital employed.
As you can see, the benefits of this business model improve just about all other qualities featured in this article.
Bottom Line
The macro environment will be top of mind for the foreseeable future. With 40-high inflation, rising interest rates, and a potential recession, we must adapt and ensure our investment strategy is stacking the deck in our favor.
A high gross margin, pricing power, robust retention metrics, capital efficient growth, and an asset-light business model can do just that.
What about you?
- How do you position your investment to beat inflation?
- Do you seek specific qualities for your portfolio?
- What other features would you recommend?
Let me know in the comments!
Be the first to comment