

Leestat/iStock via Getty Images
Written by Sam Kovacs
Introduction
What if?
2 words, 6 letters, 1 question mark.
Maybe the most powerful question anyone can ask.
If you are asking the important questions, you’re that much closer to finding answers.
And as we wrap up the last week in October, I can’t help but ask myself this all important question:
What if the 2022 bear market is already over?
Now don’t get me wrong, I didn’t see this year coming. I had anticipated some correction, but that markets would generally reset then move higher.
Maybe I was right, but my timeline was wrong.
In these conditions, we had to put up a fight, make some tough decisions regarding our portfolios and stick to our strategy if we were going to beat the S&P 500.
So far, so good. The Dividend Freedom Tribe’s model portfolios are up between 1.2% and 6.5% YTD while the S&P 500 is down 19%. (These numbers include dividends).
With two months to go, we’re asking ourselves: What’s next? Asking this question, naturally leads to many “what ifs?”.
Exactly a month ago, when we shared our last public article on Seeking Alpha (we’ve been less active on the public side as we’ve been working overtime to deliver value to the Dividend Freedom Tribe), I said:
One important message I want to get through, is that the bottom is most likely closer than you think. Whether we crater to 2,800 or stabilize just a few points lower than we currently are, the rebound is within sight.
Many will be shocked at this idea. After all the recession is only just upon us. Yes but the market is forward looking. And while things could get worse, if you look at the half full glass, they might be on the verge of getting better.
Now is a great time to make sure your portfolio is full of undervalued, high quality stocks with good dividend yields.
For the TL;DR the 7 stocks we went on to highlight were Philip Morris (PM), Realty Income (O), American Tower (AMT), Intel (INTC), Aflac (AFL), Union Pacific (UNP), and Enbridge (ENB).
One month later, the index has jumped nearly 7%; some of these stocks have underperformed the index, some are slightly above.
Performance Chart vs SPY (Dividend Freedom Tribe)
Of course, I don’t care at all about these individual 1 month performance differences.
Anyone who tells you that they matter is not to be listened to.
Stocks will go up and down, and smart investors will follow some variation of the following:
- Buy high quality companies. If you can own a good business why would you want to own a bad one.
- Buy them when they’re cheap. You love getting a discount for anything, why not for stocks.
- Sell them when they’re high. Don’t wear stocks like a pin on your chest. If they are highly priced, ship it and replace it with something relatively cheap.
- A solid framework that ensures that you follow through on the above.
Dividend investing isn’t the only way to do this. But as a retail investor, it’s a damn good place to start. You get paid to wait, which naturally books some realized returns. You can measure relative to dividend yield and growth whether you’re buying the stock when it’s relatively cheap, and when you’re selling it whether it’s relatively expensive. And it naturally tilts you towards high quality companies because you don’t want your income to be slashed.
So we encourage our members to invest through thick and thin, and stay the course, as it is the best way for them to reach financial freedom in retirement.
This is easier said than done. Many investors make some adjustments to the way they invest because of fear and greed. When they’re greedy they’ll build up positions faster than they would when they’re scared, for instance.
These deviations are normal. We’re all human. This is why guessing the overall direction of the market does remain important.
It gives you some comfort in what you’ll doing.
And here’s the news: The overall direction of the market is up.
The United States of America remains the single most investable country in the earth, where shareholders remain largely protected and valued, which also offers:
- Technological edge: where are Google (GOOG), Amazon (AMZN), Apple (AAPL), Meta (META), and Tesla (TSLA) headquartered? Worldwide, consumers use these companies products and services.
- Cultural edge: I listen to American hiphop, American jazz. I watch American TV and films. I read American books. I wear Nike (NKE) sneakers. The best media and content comes from the states.
- A large single common market: China and India have this, but they don’t have the above points. They don’t have as free capital markets either. But Europe, will never really have this, as widespread mobility remains somewhat a pipe dream. If there is no work for Handymen in Missouri but there is in Texas, an American can move there, and while there might be some regional cultural differences, he shares the language and the American identity and can set up his life there with no issue. A Portuguese handyman who wants to move to Estonia faces language and cultural barriers which makes Europe a lot less mobile and efficient.
Whether the market goes up more and down more is irrelevant to the patient investors who takes opportunities to buy and sell as they arrive, while keeping constant exposure to the markets.
But still, we ask: What if the market has already bottomed?
If the market has already bottomed…
Then it means that this bear market would have lasted just over 10 months, and will have tumbled in total 25.4% from its high.
These metrics are within the normal ranges of both duration and decline. The median bear market decline post WWII is 27%, ranging from 19.9% in 1990 to 57% in 2008.
Charles Shwab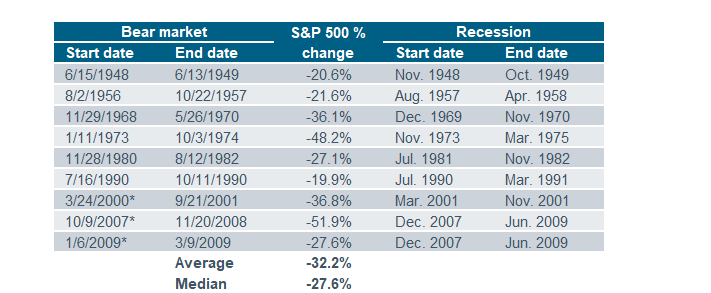
This in itself is quite a shallow analysis. Let’s look at another interesting metric: the forward looking nature of markets.
In 1949, the bear market ended`3 months before the recession ended.
In 1957, the bear market ended 6 months before the recession ended.
In 1970, the bear market ended`5 months before the recession ended.
In 1974, the bear market ended 6 months before the recession ended.
In 1982, the bear market ended`4 months before the recession ended.
In 1990, the bear market ended`5 months before the recession ended.
In 2001, the bear market ended`2 months before the recession ended.
In 2009, the bear market ended`3 months before the recession ended.
This suggests that while markets are forward looking, they are only forward looking by one or two quarters.
Do we believe that the US will exit a recession within the next 3-6 months?
Some might in fact argue that the recession which lasted during the first two quarters of this year, is already over as the US GDP increased by 2.6% in Q3.
Others will point to the fact that the recession is still looming, that consumer spending (which accounts for 70% of the GDP) is about to collapse.
The vast majority of economists expect a recession in the first half of next year.
Maybe they’re right.
Maybe they’re wrong. Everyone was wrong about inflation (well not everyone, but I’m not gonna gloat, again) (oops just did it).
The truth is you don’t know what you don’t know.
But if inflation has peaked, that the consumer remains resilient (two contradictory forces that need to coexist) then there might be a case for the worst to ALREADY be behind us.
One or two recessionary quarters next year followed by a recovery would still keep this recession in historical ranges.
If the market has already bottomed, then we must proceed with the final decade of the super cycle, and will likely see the S&P 500 go above 5,000.
If the market hasn’t already bottomed.
If the market hasn’t already bottomed, then the rally we have currently witnessed from the 3,520 or so low will be short lived, and eventually propel us to lower levels. 3,200 and 2,800 look likely.
But then it would be over.
The truth is, that we live in one of the most curious economic times of the past 30 years, where years of governmental experimentation with quantitative easing, helicopter money, and shaky economic theories give us contradictory reads on everything.
I look at the market today, and I remain cautiously optimistic.
Either the market has bottomed, or is within a few months, maybe as much as a quarter or two, of bottoming.
Whether it rains or shines tomorrow, we have no choice but to invest in a way which keeps us prepared for everything.
Hope for the best and plan for the worst.
Invest in All Weather dividend stocks
When Robert and I became crystal clear on our classification of stocks, we decided that we would focus primarily on stocks which we could classify as All Weather dividend stocks.
Note that the price of these stocks might go up and down, and they always do that somewhat in lockstep with the market.
All weather stocks are not lottery tickets. They’re just the smart play.
Whether the weather is good, fair, or outright bad, these companies will continue to pay their dividends like clockwork, because they are some of the best companies in the world.
They have what Warren Buffett would call a “moat”.
They have great management which is shareholder friendly. This is measured by how well they give back to their shareholders in the form of dividends and buybacks.
At the end of 2021, not too many of these were selling for great prices. At the end of 2019 or 2007, it was the same. Everything looked expensive. Today that’s not the case.
Let me just do a cursory run through a handful of All Weather stocks which are trading at clearance sale prices right now.
I’ll present their MAD Charts so that you can realize how different their current yields are to what was historically the norm for these stocks. (To learn more about MAD Charts, you can read this post).
We’ll look at 15 year MAD Charts so you can see relative valuations throughout the entire bull cycle.
First, let’s look at BlackRock (BLK), the leading asset manager on this planet.
The ETF trend made BlackRock blow up. But now it is yielding 3%. For 75% of the past 15 years, it has yielded less than it currently does.
BLK MAD Chart 15y (Dividend Freedom Tribe)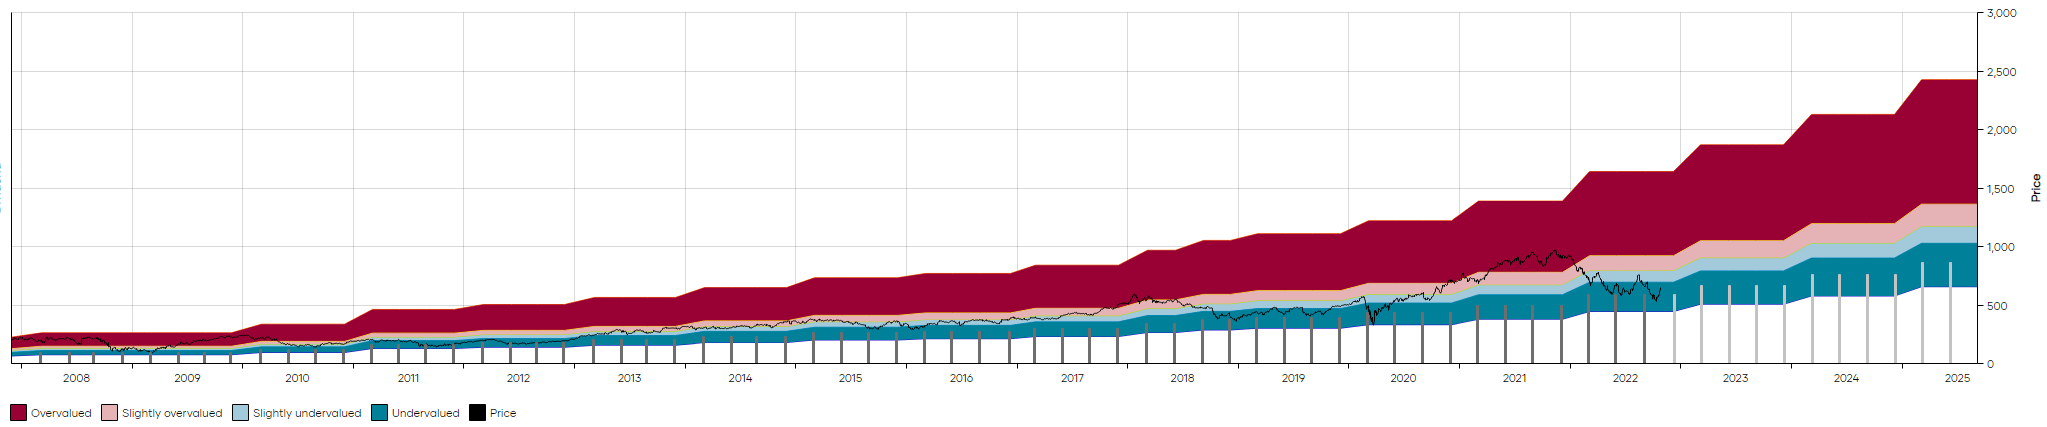
The company has grown its dividend at a 12.5% CAGR, and this has been accelerating in the past 5 years. But at the current price even 8% to 10% dividend growth would be satisfactory. That’s your margin of safety.
Is there any denying how great a business BlackRock is? I don’t think so, yet the market is giving you an opportunity to buy the stock at a basement price.
Goldman Sachs (GS) is another financial stock trading at basement valuations. Sure M&A is down, and M&A is a cyclical business, but on the next up cycle of M&A activity, who do you think is going to be the number one again? Of course, it will be GS.
They are the superior firm, with the superior culture.
GS MAD Chart 15y (Dividend Freedom Tribe)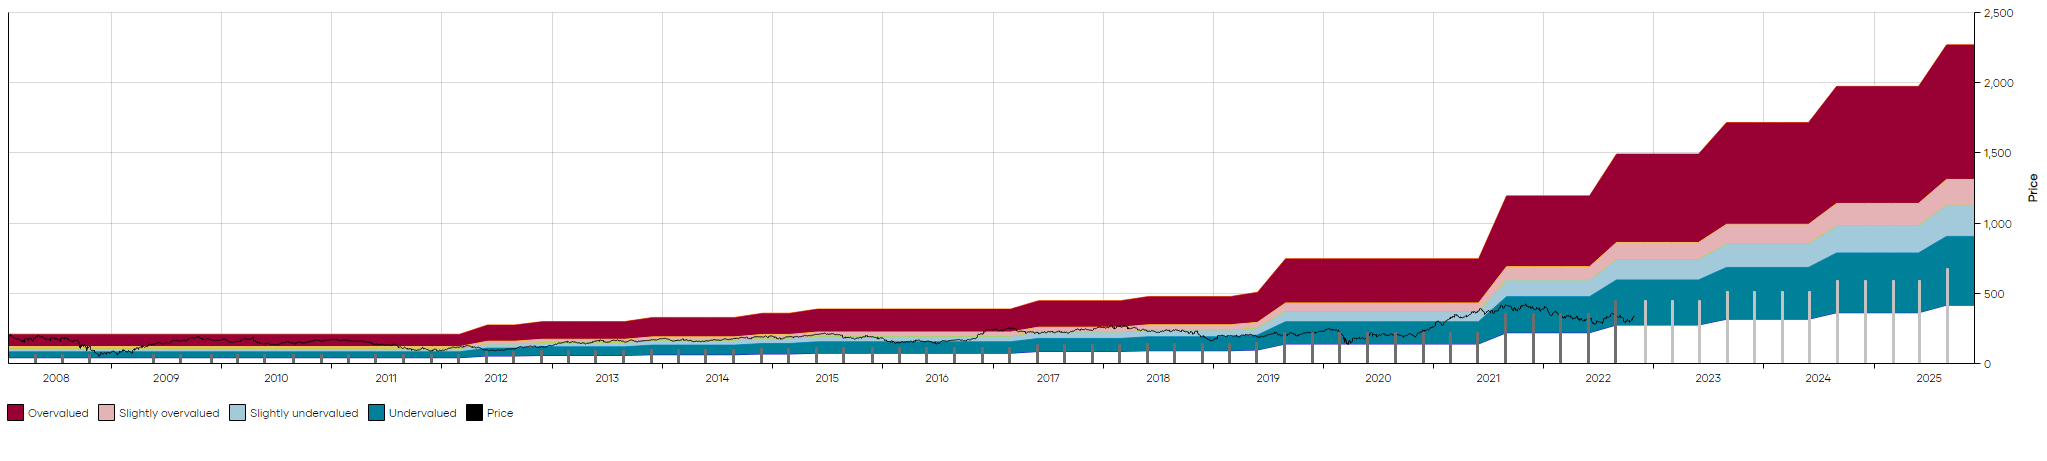
Yet the market is offering you a 3% yield, which is significantly more than the median 1.3% that the market has yielded in the past 15 years.
Moving away from financials and to tech, Broadcom (AVGO) is still misunderstood. I have written about it extensively in past public articles, and more recently in a note to members of the DFT.
The secular tailwinds for B2B semi stocks such as AVGO are huge.
Yet the market is giving you a 3.6% yield, significantly above the 2.1% median yield experienced over the past 11 years, since AVGO started paying a dividend.
AVGO MAD Chart 11y (Dividend Freedom Tribe)
Keep in mind that AVGO only pays out 50% of its free cashflow, which gives it a massive cushion when the semi cycle invariably corrects itself.
In consumer discretionary, you get two very interesting picks.
Home Depot (HD) which many see as one of the best dividend stocks ever. The company has managed to maintain a culture of mega growth for decades.
HD MAD Chart 15y (Dividend Freedom Tribe)
It currently yields 2.6%, which has historically been the breakpoint for getting a fantastic deal on HD. HD always gravitates back towards a 2% or so yield, and why would it be any different down the line?
Conclusion
I am not analyzing these stocks in detail in this article, as the point is to consider the possibility that a recovery might be underway.
It also might not be, there are no clear signs at this point, as contradictory information suggests it could go either way. Do not get sucked in to the perma-bear messages that everything is just going to get worse.
If you’re in it for the ride, you should capitalize on good opportunities as often as you can. This will ensure that as the cycles pass, you end up doing better than average.
Our secret is that we don’t have any secrets. We employ a common sense strategy systematically, and remain disciplined through thick and thin.
Be the first to comment