

Khanchit Khirisutchalual/iStock via Getty Images
Up until June 8th, the Energy sector was the only thing working in the market. However, the sector has reversed dramatically, falling close to 25% since. This comes as the price of oil pulls back and the White House targets the entire vertical with accusations of profiteering. As any investor knows, the price of oil is not set by individual energy companies, but rather by the forces of the market. Interestingly, the same administration that is pressuring oil companies to increase supply campaigned on the fact that they would not allow for drilling permits to be renewed on federal land, so the current rhetoric is… interesting to say the least. To quote Biden himself: “Number one, no more subsidies for the fossil fuel industry. No more drilling on federal lands. No more drilling, including offshore. No ability for the oil industry to continue to drill, period.” Rhetoric like this can logically cause a reduction in domestic energy investments, as CFOs adjust capital expenditures based on added legislative risk.
Nonetheless, the price of oil has pulled back significantly, which causes compression in gross margins for suppliers. Oil is currently trading at about $100 per barrel. Although oil is still up over 33% YoY, it has pulled back by 23.3% relative to highs. Most industries will breathe a sigh of relief, but energy companies will be in the other camp. Notably, crude recently broke its uptrend, and seven of the last 15 trading days have seen declines of 3% or more.
Author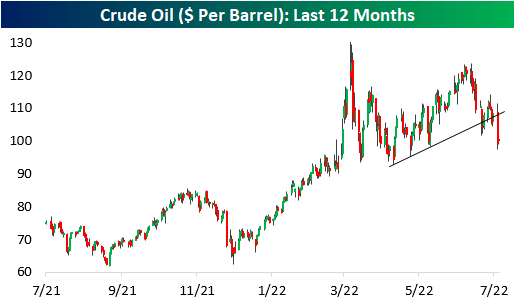
Below is a chart showing the rolling % of 3%+ daily declines over all 15-day periods. As you can see, this is an extremely elevated reading, surpassed by just the Great Recession and the COVID Crash. Following the high reading in 2008, XLE rebounded 8.9% in the next week and 7.8% over the next month. In March of 2020, XLE fell by an additional 13.1% over the next week but rebounded 14.7% over the following month after the peak reading.
Author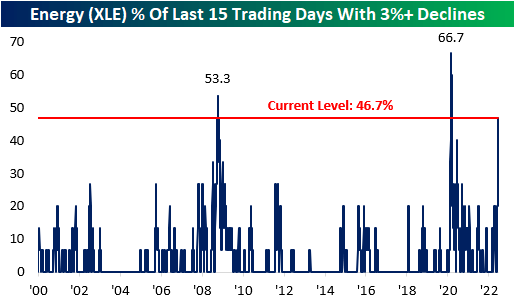
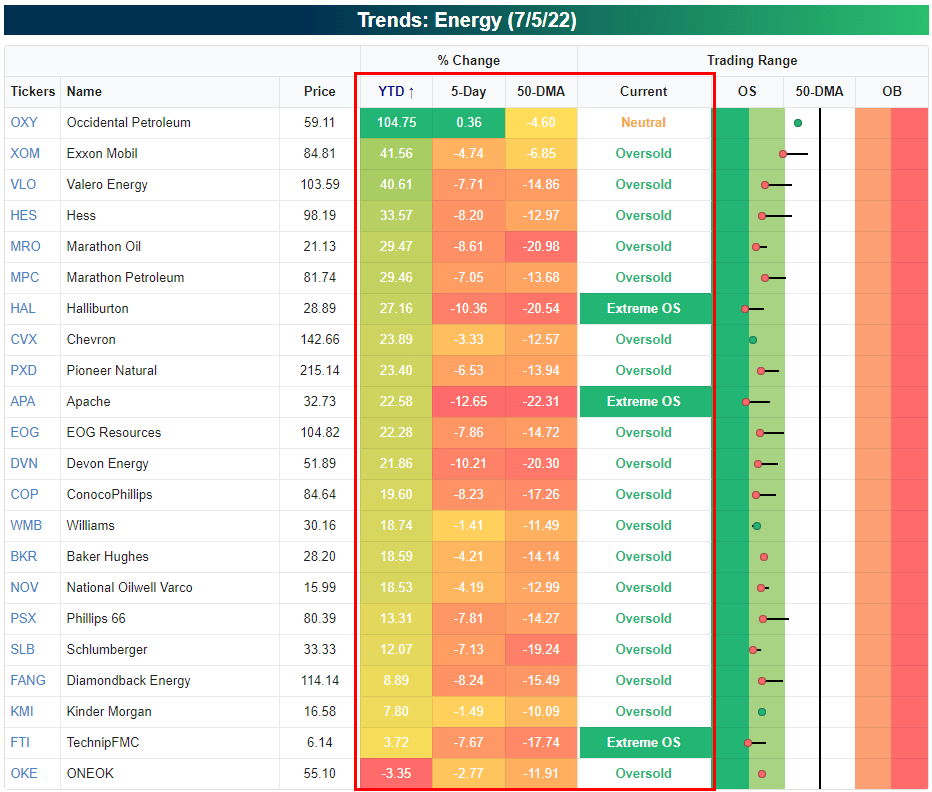
Below are snapshots of S&P 500 Energy stocks as they currently stand versus where they stood on June 8th when XLE peaked. All but one of the stocks have entered an oversold range after every single one was overbought as of 6/8. What a difference a month can make! On average, these stocks were up 66% YTD (median: 64.8%) on June 8th, but are now up an average of just 22.3% on a YTD basis (median: 18.0%). Between the close on 6/8 and 7/5, the average stock on this list fell by 26.1% (median: -26.7%), delivering pain to investors who bought the rip.
Energy Energy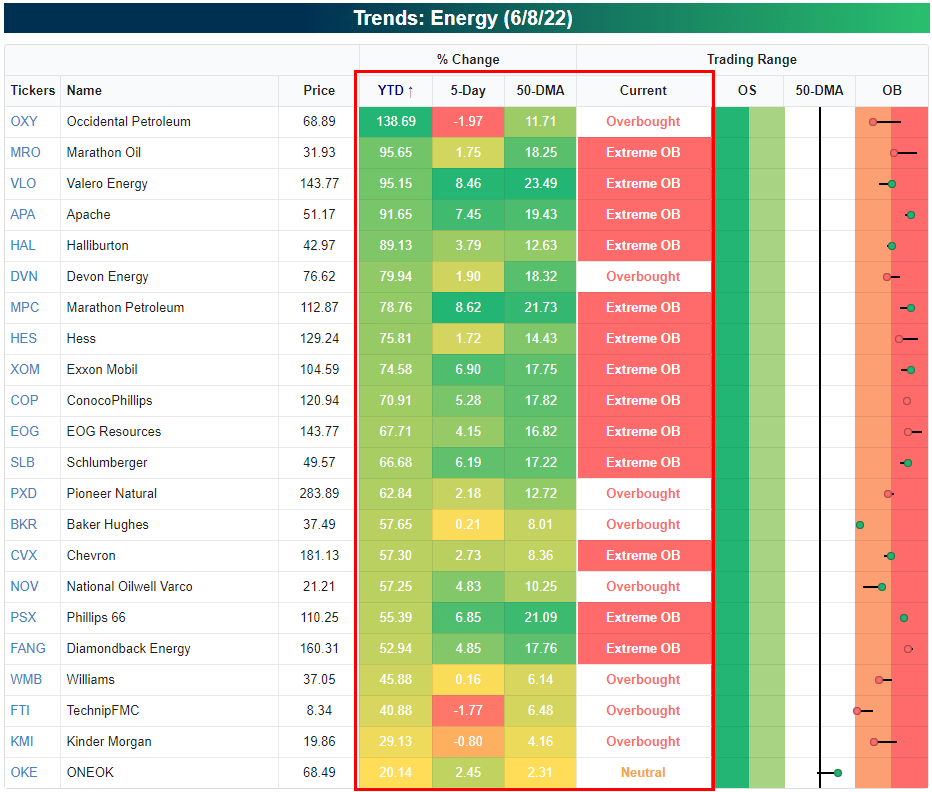
Editor’s Note: The summary bullets for this article were chosen by Seeking Alpha editors.
Be the first to comment