

Juan Jose Napuri/iStock via Getty Images
It was a mixed Q2 Earnings Season for the Gold Miners Index (GDX), with several producers meeting their production estimates but coming in high on costs. This was largely out of the control of most companies, impacted by inflationary pressures, supply chain headwinds, and a tight labor market. Unfortunately for Wesdome (OTCQX:WDOFF), these headwinds were exacerbated by other one-time issues for Wesdome, including a manufacturing defect with a hoist rope, a leach tank failure, and grade variability at the Falcon Zone. The result was a massive miss vs. estimates and a significant guidance cut.
While this contributed to a very ugly Q2 report, most of these issues are in the rear-view mirror, and 2023 should be a completely different year for the company. This is because costs should improve dramatically with a more meaningful contribution from Kiena, and the sharp increase in consolidated production is still on deck, just a year behind schedule. So, given Wesdome’s attractive organic growth profile and the fact that it’s one of the better exploration stories sector-wide, I would view any pullbacks below US$6.16 as buying opportunities.
All figures are in United States Dollars unless otherwise noted at an exchange rate of 1.25 USD/CAD.
Q2 Production & Future Outlook
Wesdome released its Q2 production results in mid-July, and as I discussed in late July, this has set the company up for a very rough Q2 report. The reason for this softer report was due to several issues, including a hoist rope manufacturing defect, a leach tank failure, plus the delayed receipt of underground equipment and key electrical components for the paste fill plant. The result was the production of a mere ~27,200 ounces in Q2, an 11% decline from the year-ago period despite a steady ramp-up in mining rates at its newly producing asset, Kiena.
Wesdome Mines – Quarterly Production (Company Filings, Author’s Chart)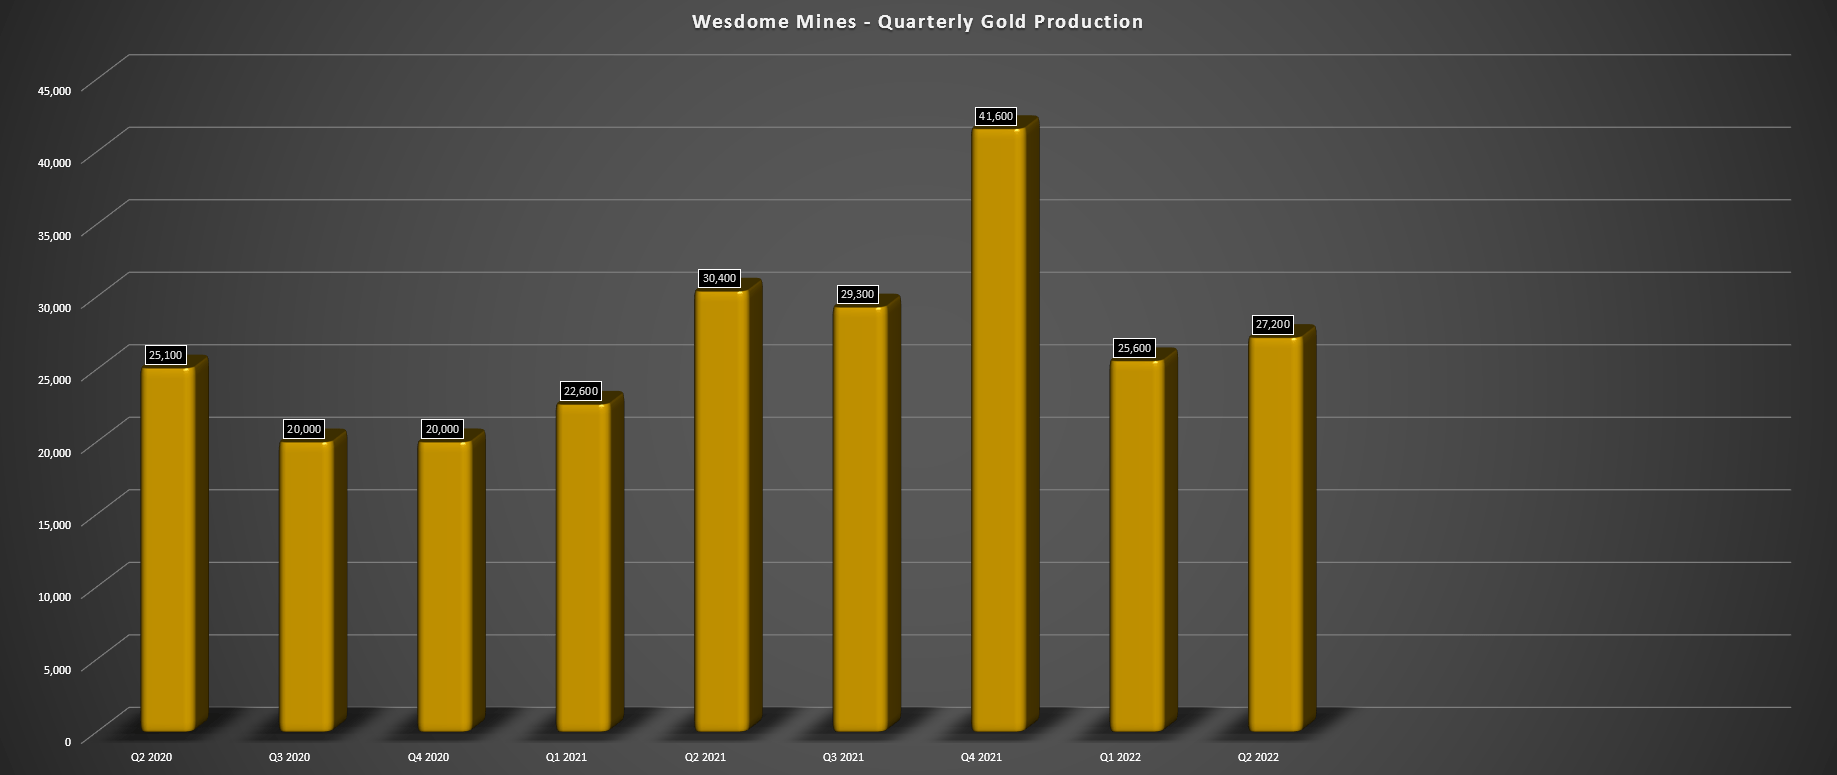
This kitchen sink quarter is similar to what we saw out of K92 Mining (OTCQX:KNTNF) in Q1 2021, which is also one of the highest-grade gold producers globally. Not only did the company see impacts from COVID-19 on its workforce, but it saw a shortage of bulk emulsion explosives and an incident involving an underground loader preventing backfill operations. The result was a sharp cost increase and a violent sell-off in the stock, with significantly fewer ounces sold. However, from the trough of this post-earnings sell-off, K92 Mining traded 35% higher over the following 12 months despite only a moderate upside in the gold price.
This is worth pointing out because we could see a similar recovery for Wesdome if it can get operations back on track. Besides, the key differentiator in these two instances is that both K92 and Wesdome are growing production, and each has a track record of under-promising and over-delivering, meaning that any missteps for each company are rare. That said, while K92 Mining managed to patch things up immediately and came close to meeting its initial FY2021 guidance, Wesdome’s issues have had a more pronounced effect, forcing it to slash its FY2022 production guidance (planned maintenance at both mines in July is impacting the pace of the recovery in production).
Wesdome Updated Guidance (Company News Release)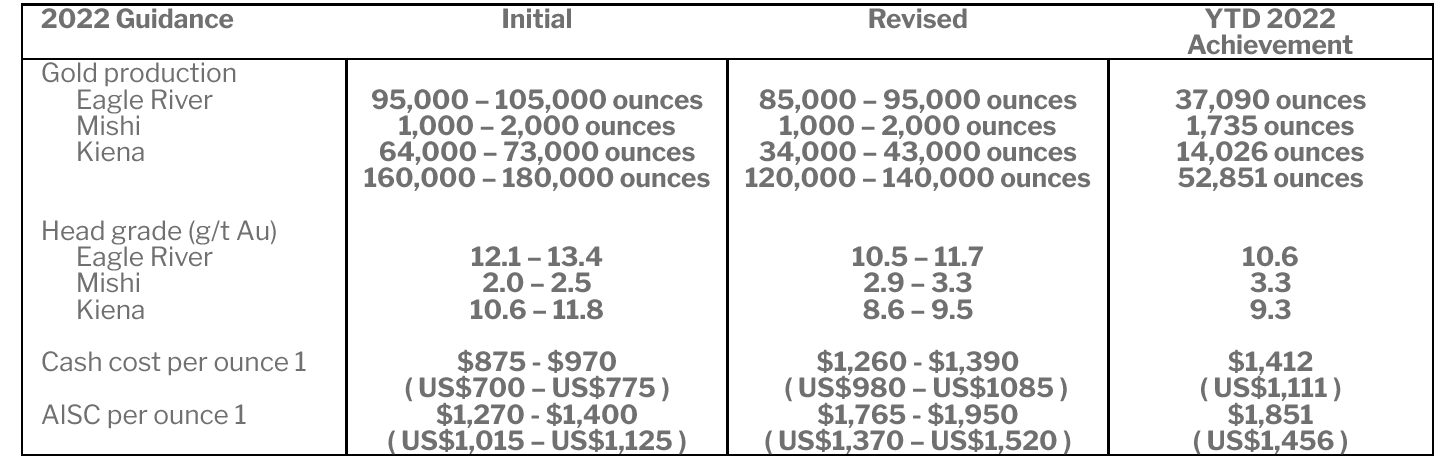
Looking at the updated guidance above, Wesdome has cut its production guidance by 40,000 ounces at the mid-point (130,000 ounces vs. 170,000 ounces), with grades expected to be much lower at both Eagle River and Kiena. The grade underperformance at Eagle River is related to more conservative grade estimates due to lower grades than expected in the Falcon Zone. At Kiena, the forecast for lower grades is related to the delayed commissioning of the paste fill plant (now planned for Q4), which will speed up the production cycle vs. mechanically placing cemented rock fill in the open voids.
Wesdome – Annual Production & Forward Estimates (Company Filings, Author’s Chart & Estimates)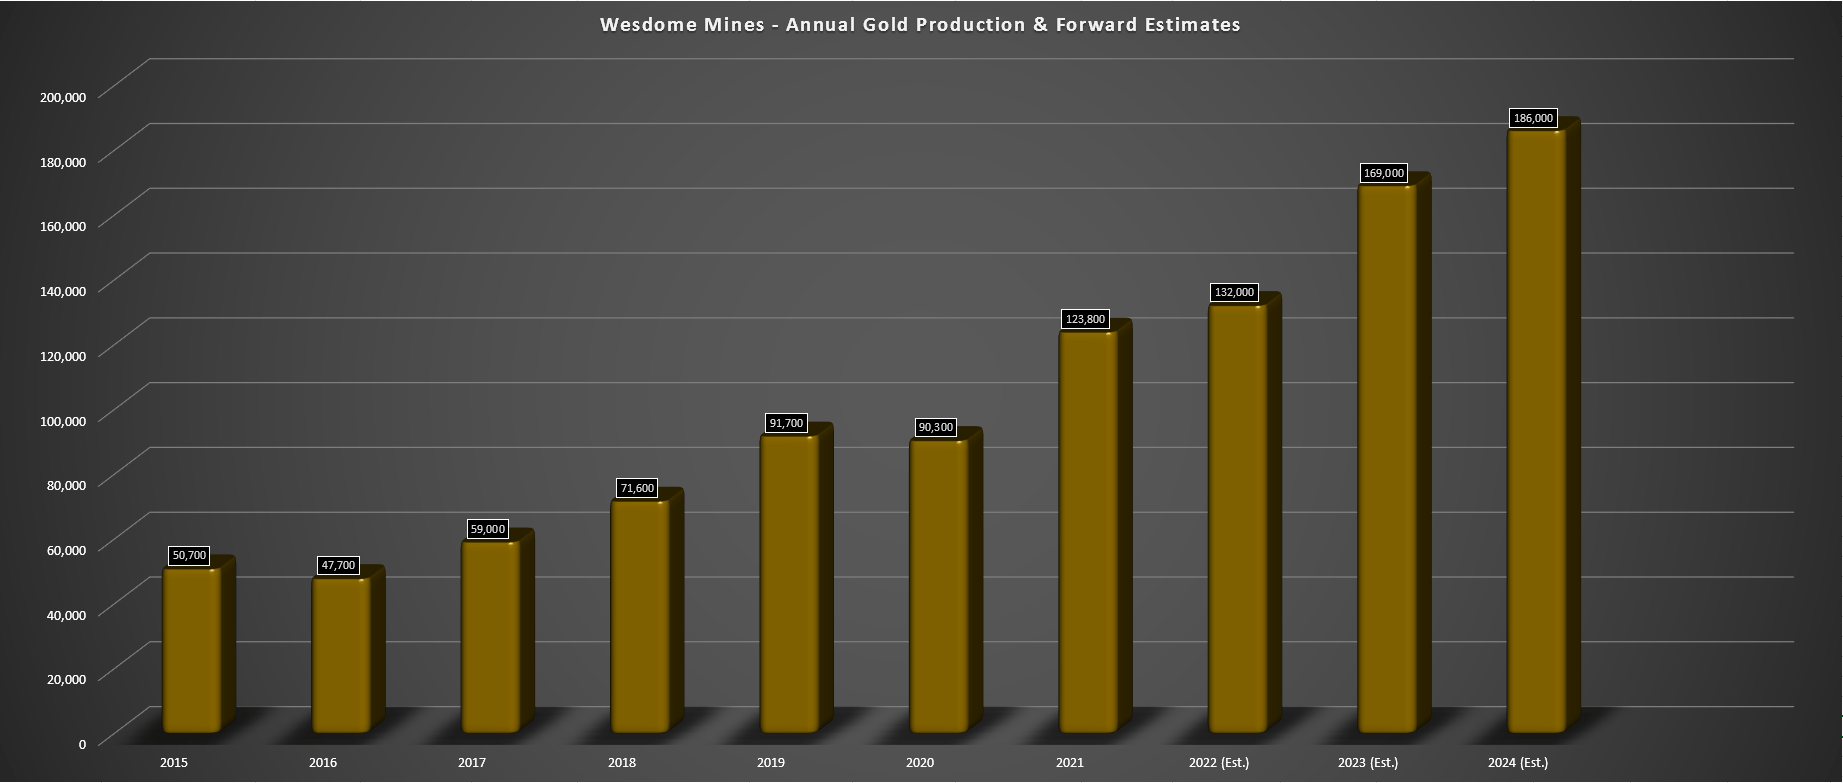
The good news is that FY2023 should be a much better year for the company, and I believe Wesdome should be able to produce at least 169,000 ounces, up from my estimates of 132,000 ounces in FY2022. This would translate to 28% production growth year-over-year, with further growth looking ahead to FY2024 as grades improve even further at Kiena. So, while I wouldn’t expect much improvement in the Q3 figures due to the maintenance completed in July, the next three years should be much better years for Kiena, providing a tailwind from a production and margin standpoint.
This is based on average head grades of ~12 grams per tonne of gold in FY2023 through FY2025 and higher processing rates vs. a mid-point of ~9.0 grams per tonne in FY2022.
Costs & Margins
Moving over to cost performance, Wesdome is fortunate that it’s not as sensitive to energy prices, operating two relatively low-volume, high-grade mines with access to hydroelectric power at Kiena from Hydro-Quebec. This is a major benefit compared to other producers moving a considerable amount of rock per ounce produced and relying on diesel generators in some jurisdictions. That said, the company has not been immune from labor tightness especially given that it’s in prolific mining areas, surrounded by several mines at Eagle River and Kiena. Combining these inflationary pressures (fuel, energy, labor) with a lower denominator (fewer ounces sold) led to a sharp increase in unit costs in Q2.
Eagle River Operations (Company Filings, Author’s Chart)
If we look at the chart below, Wesdome’s consolidated cash costs rose to $1,205/oz while its all-in sustaining costs [AISC] increased to $1,582/oz, a more than 60% increase from the year-ago period. One might expect this from operators like Iamgold (IAG) and Argonaut (OTCPK:ARNGF), which operate relatively low-grade mines with poor cost controls, not Wesdome, which operates two of the highest-grade gold mines globally. The result was a free cash outflow of ~$22.8 million in Q2 and a significant decline in operating cash flow to just ~$9.7 million. Although this free cash flow figure is quite ugly, it’s worth noting that spending is elevated, with higher capital expenditures in the period with a sharp increase in mining equipment and infrastructure upgrades.
During Q2 2022, capital expenditures came in at ~$25.0 million vs. ~$10.2 million in the year-ago period, more than offsetting the benefit of a higher gold price ($1,903/oz vs. $1,791/oz).
Wesdome – Quarterly All-in Sustaining Costs (Company Filings, Author’s Chart)
This cost performance was especially disappointing given the weakness in the Canadian Dollar vs. the US Dollar (UUP), which was a minor tailwind for the company relative to last year’s levels given that it has solely Canadian mines. However, while it’s fine to be negative and cross Wesdome off of one’s watchlists for potential buy-the-dip candidates, this horrid quarter is now out of the way, and the forward outlook is much better. Meanwhile, exploration success continues to be quite encouraging, suggesting that Kiena’s 7-year mine life is likely closer to a 12-year mine life with a likely lift in average grades, a tailwind to net asset value at this asset as prospective resources are converted to reserves. Some highlight intercepts are as follows:
- 5.5 meters (true width) at 50.7 grams per tonne of gold
- 5.0 meters (true width) at 18.7 grams per tonne of gold
- 5.0 meters (true width) at 74.6 grams per tonne of gold
- 6.0 meters (true width) at 38.3 grams per tonne of gold
- 7.0 meters (true width) at 35.9 grams per tonne of gold
USD/CAD Chart (TC2000.com)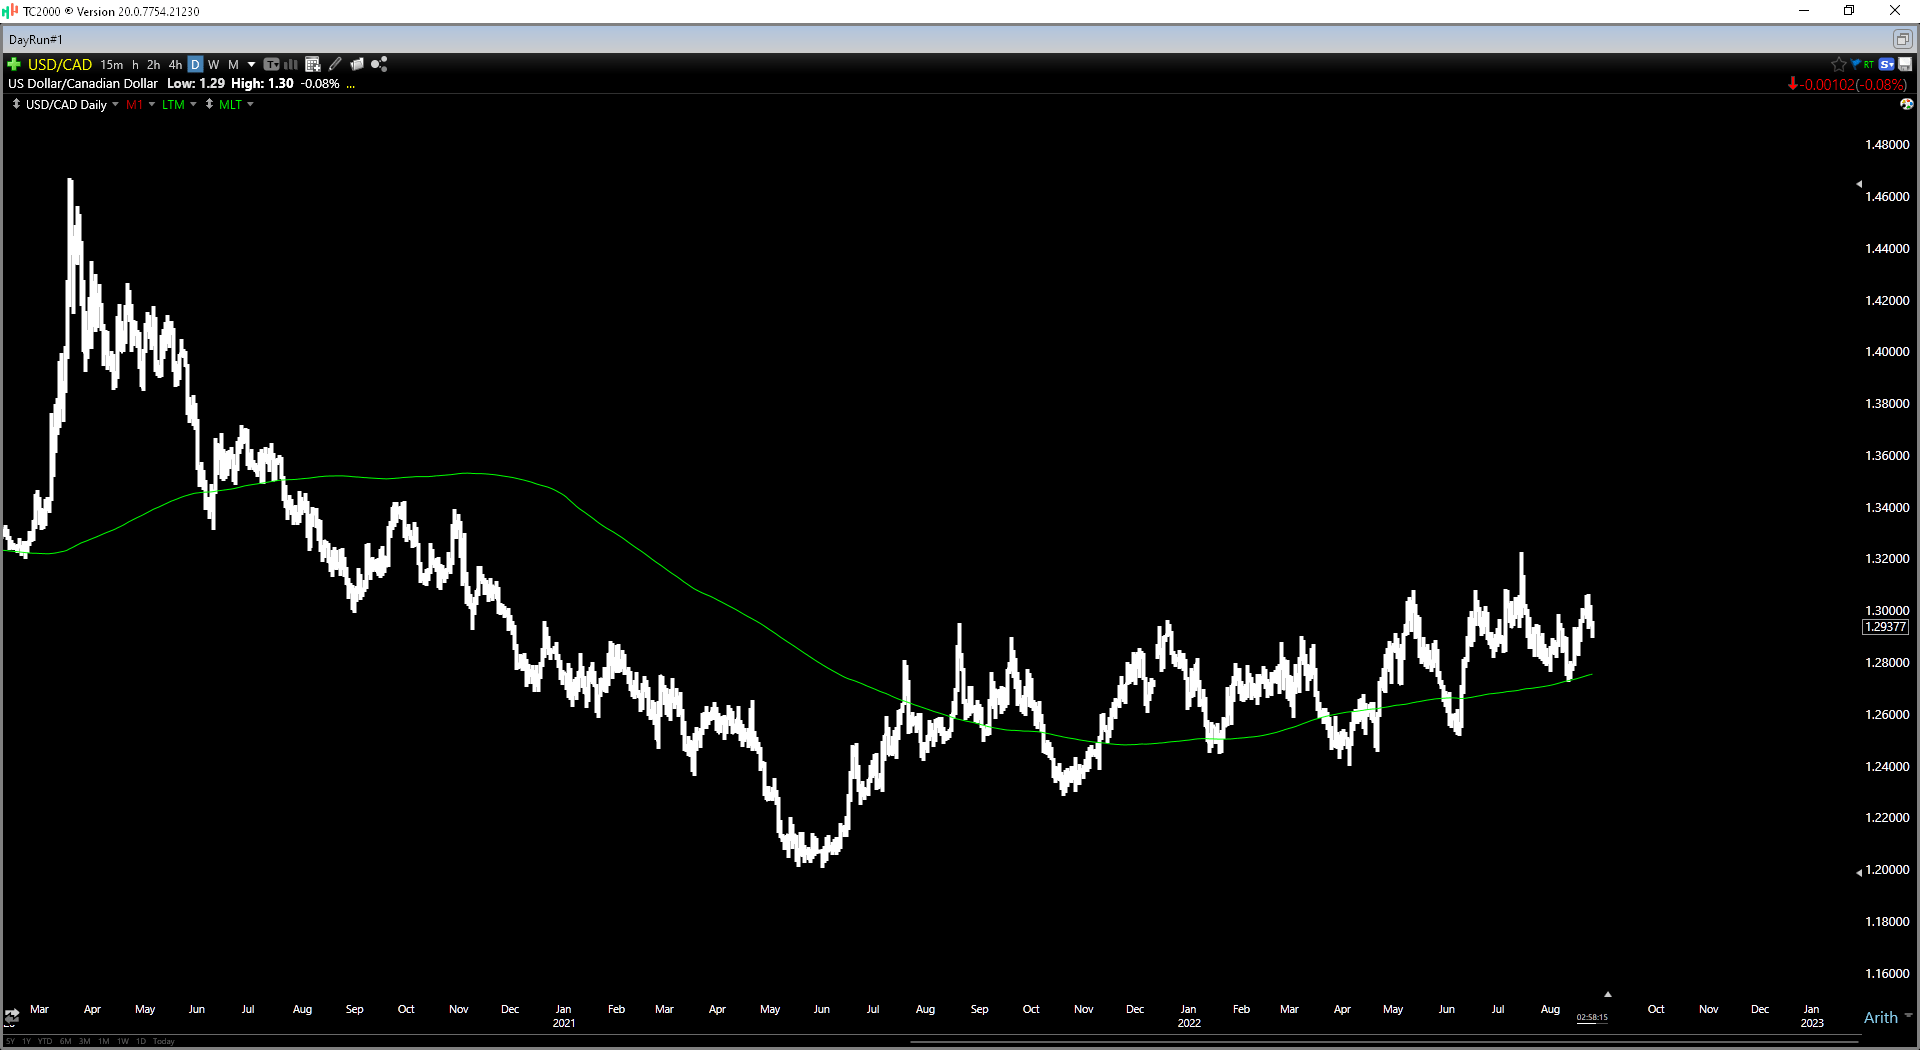
Finally, while the spike in costs (yellow bar shown below) this year is certainly disappointing, given that its costs are likely to come in above $1,400/oz (FY2021: $1,162/oz), we should see a significant improvement in costs in FY2023. This is because we’ll see a higher contribution of consolidated production from Kiena and much higher production at both assets. I would expect this to lead to a decline in costs below $1,200/oz even after factoring in the negative impact of inflationary pressures, which are likely to remain sticky for labor. So, while the trend in costs is certainly not attractive currently, Wesdome’s costs should dip back below the industry average in FY2023 vs. my estimate for industry average costs of $1,255/oz.
Gold Producers – All-in Sustaining Costs (2019 – 2022 Actual & Estimates) (Company Filings & Guidance, Author’s Chart & Estimates)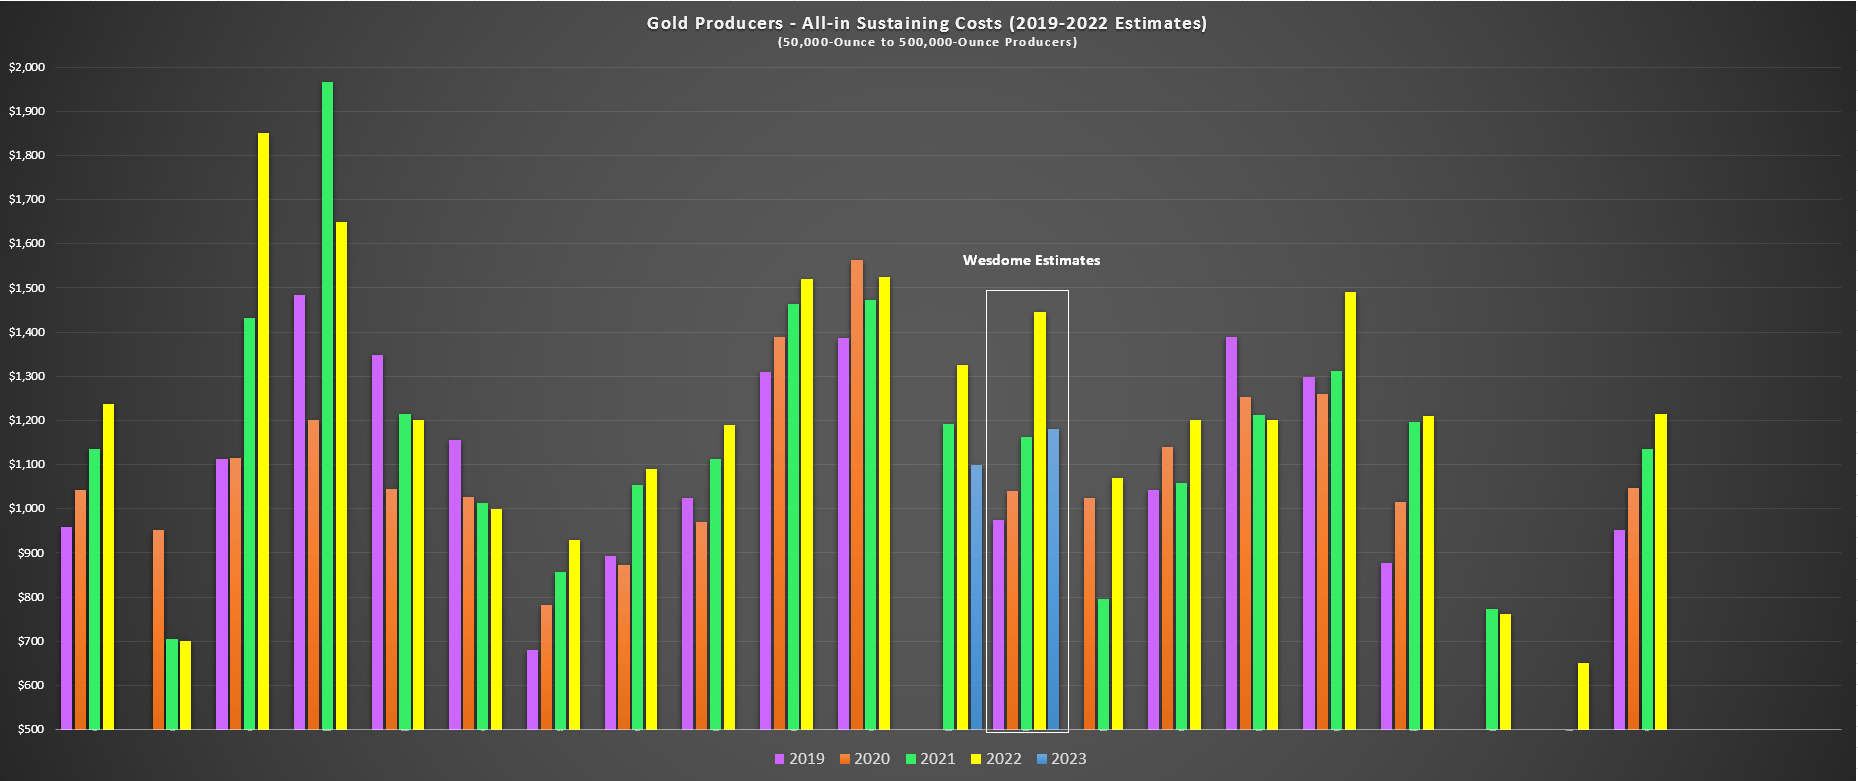
Valuation & Technical Picture
Based on ~145 million fully diluted shares and a share price of US$6.65, Wesdome trades at a market cap of $964 million. This has left Wesdome trading at a rare discount to its estimated net asset value of ~$1.20 billion, with Wesdome currently trading at 0.80x P/NAV. While this might appear to be a steep multiple when some mid-tier producers trade below this metric, Wesdome owns two of the highest-grade gold mines globally, has an enviable organic growth profile, and is one of the best exploration stories sector-wide. Given its similarities with the Kirkland Lake Gold of 2016-2018 (pre-Detour acquisition), I believe the stock can easily command a multiple of 1.40x P/NAV when Kiena proves it can perform according to plan.
Kiena 2021 PFS (Company Presentation)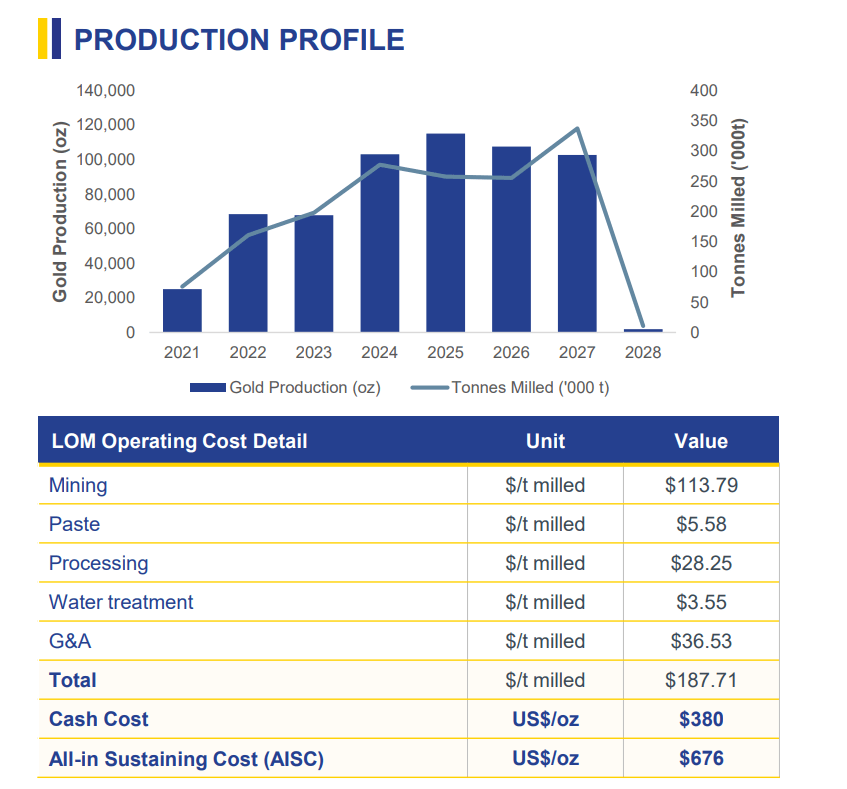
Obviously, the major difference between Wesdome and Kirkland Lake 2016-2018 is that it’s a smaller producer (~200,000 ounces vs. ~700,000 ounces), and while Kiena’s costs are expected to be industry-leading, it’s not a sub $200/oz cash cost mine. That said, even if we apply a 10% increase to the estimated life-of-mine costs in its 2021 Pre-Feasibility Study to account for inflationary pressures, it would have some of the lowest operating costs sector-wide (~$745/oz). For this reason, I believe a 1.30x P/NAV multiple is more appropriate vs. the much higher multiple of 2.0x P/NAV Kirkland Lake commanded in its high growth phase (Wesdome has organic growth, Tier-1 jurisdictions, but not a sub $600/oz cost profile on a consolidated basis).
Based on a multiple of 1.30x P/NAV, I see a fair value for the stock of US$10.94. This translates to more than 45% upside from current levels, offering investors that want a position in the stock a much lower-risk buy point than when the stock was levitating higher and outperforming its peer group massively over the past three years. So, from a valuation standpoint, I see Wesdome as attractive, and the stock has finally dipped into a low-risk buy zone. Let’s take a look at the technical picture:
WDOFF Daily Chart (TC2000.com)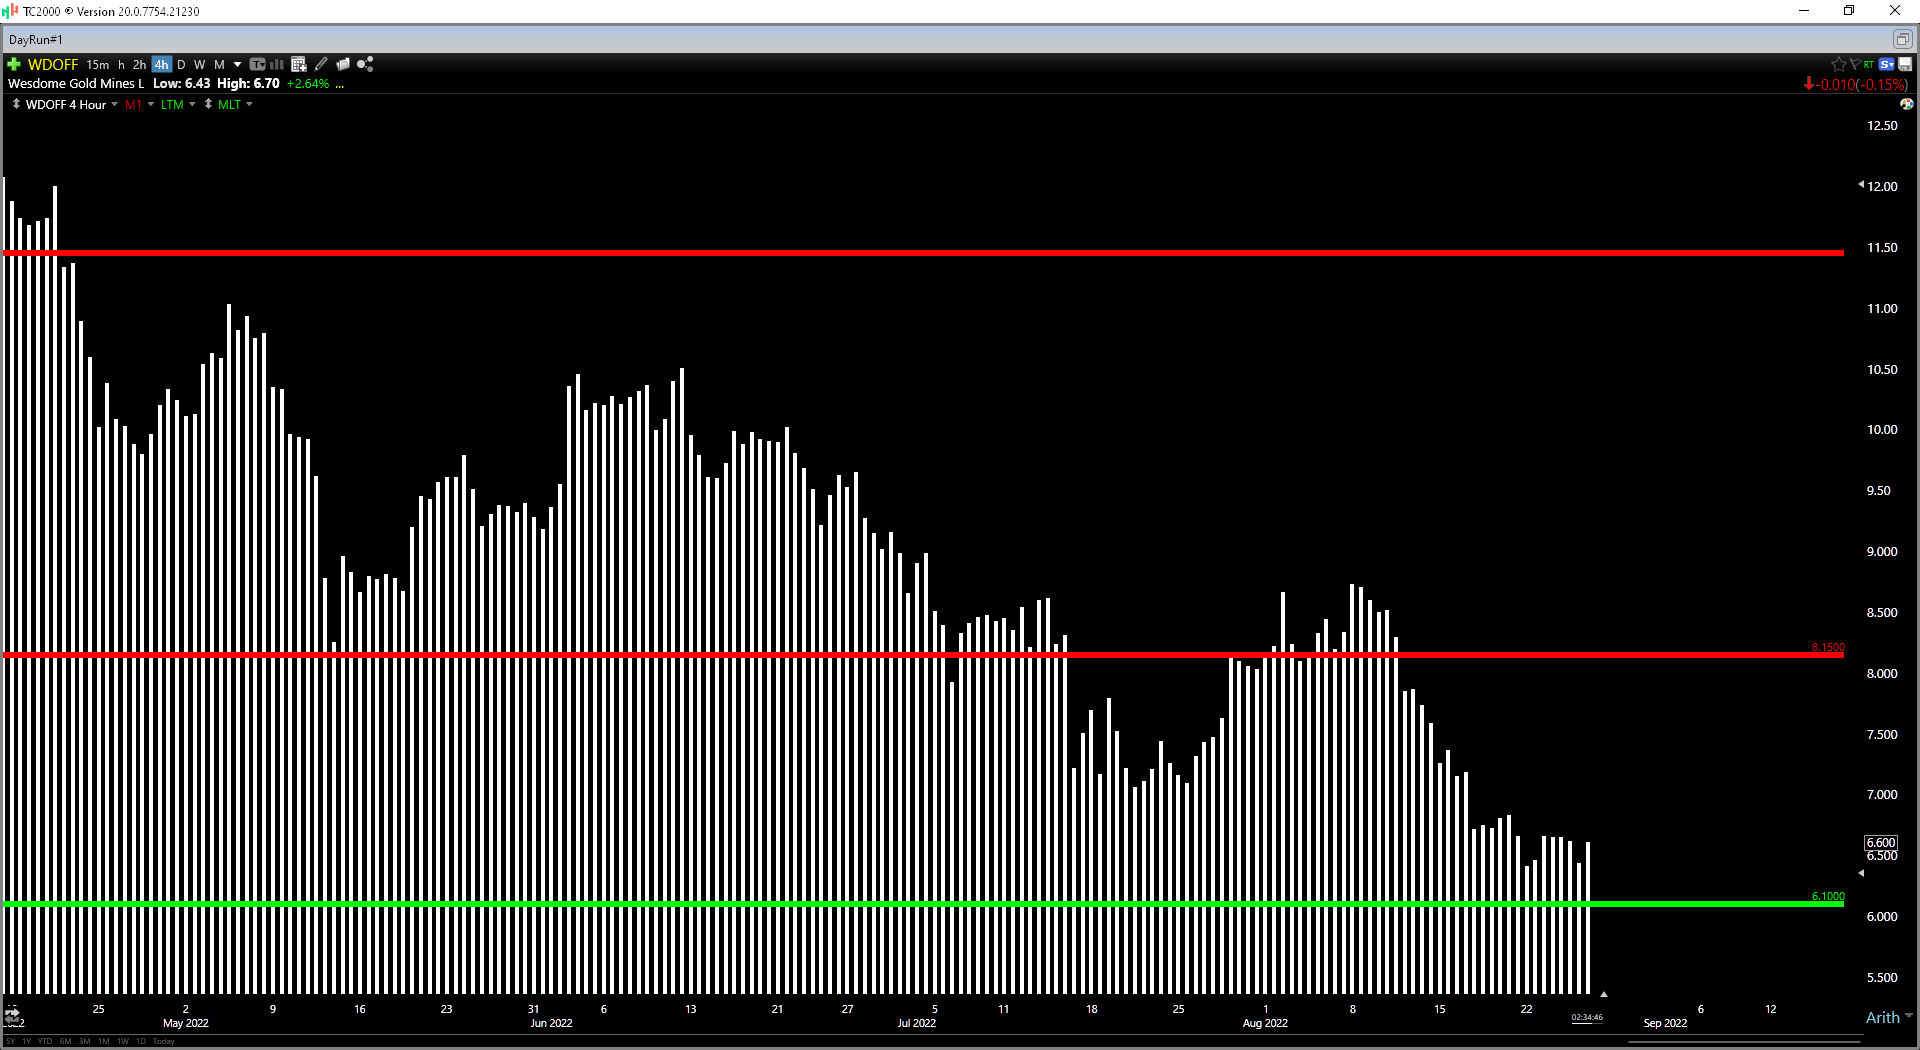
Looking at the technical picture above, Wesdome has a new resistance level at US$8.15, and its next support level doesn’t come in until US$5.85. If we measure from a current share price of US$6.60, this translates to a reward/risk ratio of 2.1 to 1.0, which is below my required reward/risk ratio of 6.0 to 1.0 to justify starting new positions in small-cap names. So, while the valuation is attractive, the lower-risk buy point for the stock would come in at US$6.15. This doesn’t mean that the stock can’t go higher, but I prefer to buy as close to support as possible, with the ideal buy zone for a swing trade being US$5.85 – US$6.15.
Summary
Wesdome had a brutal quarter which shouldn’t be surprising given the pre-released numbers in mid-July. The good news is that most of these problems are one-time issues, and with Wesdome down 50% from its highs, much of this negativity looks to be priced in. The bad news is that this technical breakdown has created a lot of resistance in the US$8.15 – US$8.30 area, where the stock is likely to be rejected if it heads here before year-end. So, while I think this is one of the better stories in the gold space, I remain on the sidelines for now. However, if Wesdome were to dip below US$6.16, I would consider a position for a swing back towards resistance.
Be the first to comment