

Richard Drury
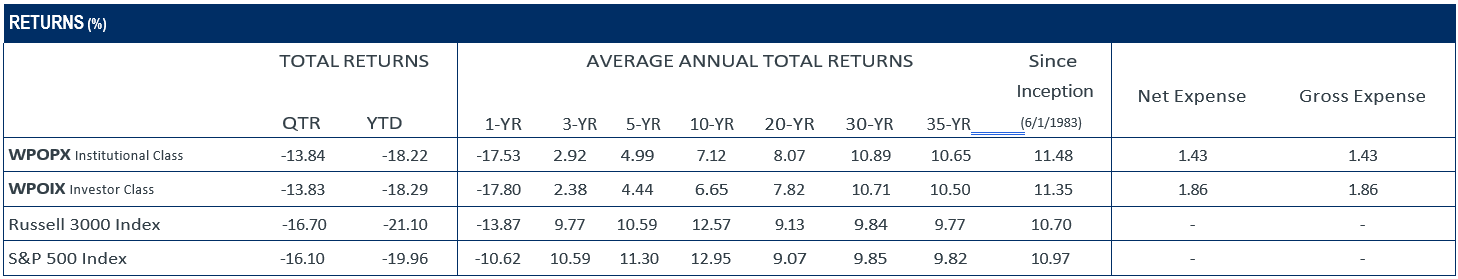
The Partners III Opportunity Fund’s Institutional Class returned -13.84% in the second quarter, compared to -16.10% for the S&P 500 and -16.70% for the Russell 3000. Year-to-date, the Fund’s Institutional Class returned -18.22% compared to -19.96% for the S&P 500 and -21.10% for the Russell 3000.
Equity market returns in the first and second quarters of 2022 made for the most challenging start to a year in decades, as inflation approached a 40-year high. After years of accommodative monetary policy, the Federal Reserve has assertively reversed course, engaging in a series of progressively larger interest rate hikes.
The Fed has acknowledged these actions have increased recessionary risks but are necessary to quash inflation expectations before they fully take root. The inflation fight is far from over, however, with more interest rate hikes on the horizon. Meanwhile, swift market declines reflect investors’ diminishing hopes for a so-called “soft landing” (i.e., implementing tighter monetary policy without triggering a recession).
The breadth and depth of declines this quarter left investors with no place to hide. Last quarter’s top performer, Berkshire Hathaway (BRK.A, BRK.B), reversed course and became the largest detractor to quarterly performance (but remains a year-to-date relative outperformer).
Amazon.com (AMZN) shares have lagged as the company works through a pandemic-induced growth hangover, while investors continue to take a “wait and see” approach to Meta Platforms’ (META, Facebook parent) ability to monetize its “Reels” short-form video format while working through challenges from Apple’s (AAPL) iOS advertising changes.
Alphabet (GOOG, GOOGL) and Liberty SiriusXM (LSXMA) round out the quarter’s top detractors, though that is a function of their large position sizes rather than outsized stock price declines.
As market declines intensified, our short positions against ETFs that track the S&P 500 and Nasdaq 100 indexes were the primary bright spots in the second quarter and year-to-date.
Coming into 2022, the Fund’s short exposure was 22% of net assets, and our effective net long position was 76%. As the market selloff accelerated, we stepped up our activity covering shorts in the second quarter. At quarter end, we maintained a modest 3% short position against an S&P 500 ETF, the lowest level in recent years. Our Nasdaq 100 ETF short position has been fully closed.
We have written in recent quarters that as valuations become stretched, our short position allows us to reduce our equity exposure without selling any specific holding. In this way, we postpone taking realized gains, eliminate future timing decisions on when to buy something back, and allow our companies’ business value growth to continue compounding in our favor.
Conversely, when stocks fall, covering shorts allows us to increase our equity exposure to a carefully curated collection of businesses we know well and believe are well positioned for the future. Importantly, we are not trying to “call a bottom” for the market, and we acknowledge that stocks may fall further.
Nevertheless, with valuation levels well off their highs and a view that our own portfolio of high-quality businesses now trades at compelling prices, we elected to materially increase our effective net long position, ending the quarter at 94% of net assets (compared to 76% at the end of 2021).
Consistent with that approach, portfolio activity among our long holdings tilted toward purchases. We added to almost half our holdings by varying degrees, and we were pleased to initiate new positions in Danaher (DHR) and Roper Technologies (ROP) at attractive prices.
Danaher is a provider of instruments and diagnostic tools to medical, life science, and other desirable end-markets worldwide. Originally an industrial equipment manufacturer, Roper has successfully evolved into a provider of software and technology services. (Investors can find an in-depth discussion of our Roper Technologies investment thesis in colleague Barton Hooper’s November 2021 “Analyst Corner” feature.) Both businesses generate significant free cash flow, possess strong competitive positions, and have excellent management teams with demonstrated acquisition records.
As we describe in our latest “Value Matters,” we believe these are characteristics that allow companies to “make their own breaks,” regardless of the near-term challenges we may face. During the quarter, we sold our remaining shares of Qurate Retail’s (QRTEA) common equity but maintain a position in the company’s 8% preferred shares.
Looking ahead, although recent market declines have been painful, we believe we own a collection of very good businesses trading at attractive valuations. Investment returns never follow a schedule, but from these prices, we believe the potential exists for very good returns in the coming years.
Top Relative Contributors and Detractors
|
TOP CONTRIBUTORS (%) |
||||
|
Return |
Average Weight |
Contribution |
% of Net Assets |
|
|
SPDR S&P 500 ETF Trust (SPY) |
-16.73 |
-7.82 |
1.70 |
-3.1 |
|
INVSC QQQ TRUST SRS 1 ETF (QQQ) |
-20.52 |
-1.20 |
0.48 |
0.0 |
|
Black Knight, Inc.(BKI) |
12.74 |
2.53 |
0.19 |
2.6 |
|
Danaher Corp. |
6.08 |
0.84 |
0.08 |
2.0 |
|
TOP DETRACTORS (%) |
||||
|
Return |
Average Weight |
Contribution |
% of Net Assets |
|
|
Berkshire Hathaway, Inc. |
-22.65 |
9.95 |
-2.42 |
9.7 |
|
Amazon.com, Inc. |
-35.05 |
4.28 |
-1.59 |
4.3 |
|
Meta Platforms, Inc. |
-27.43 |
5.38 |
-1.58 |
4.9 |
|
Alphabet, Inc. |
-21.68 |
6.71 |
-1.54 |
6.7 |
|
Liberty Media Corp-Liberty SiriusXM |
-21.25 |
5.98 |
-1.33 |
5.1 |
Data is for the quarter ending 06/30/2022. Holdings are subject to change and may not be representative of the Fund’s current or future investments. Contributions to performance are based on actual daily holdings. Returns shown are the actual returns for the specified period of the security. Additional securities referenced herein as a percent of the Fund›s net assets as of 06/30/2022: Apple, Inc. 0.0%, Qurate Retail, Inc. – Preferred 2.4%, and Roper Technologies, Inc. 2.0%.
Editor’s Note: The summary bullets for this article were chosen by Seeking Alpha editors.
Be the first to comment