

Allkindza/E+ via Getty Images
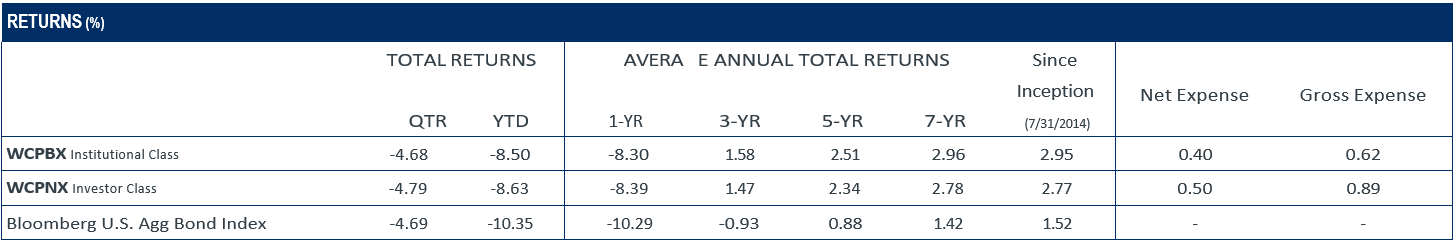
The Core Plus Income Fund’s Institutional Class returned -4.68% for the second quarter compared to a -4.69% return for the Bloomberg U.S. Aggregate Bond Index ((Agg.)). Year to date, the Fund’s Institutional Class returned -8.50% compared to -10.35% for the index. Negative absolute results are never pleasant to report despite solid relative results. Longer-term results (3-, 5-, and 7-year) continue to outpace the index.
Inflationary pressures remained stiff and showed no signs of abating in the second quarter. These pressures precipitated a large upward move in interest rates as the Federal Reserve announced a 75-basis point interest rate hike for the first time since 1994. On the other hand, investor sentiment has shifted, at least momentarily, from concerns about inflation to recession.
This shift was most visible in the U.S. high yield market, which declined almost 10% during the second quarter and recorded its worst first half on record in 2022 with a decline of 14.2%. The current yield to worst (YTW) of 8.9% for the Bloomberg U.S. Corporate High Yield index is the highest since the onset of the COVID lockdowns in March 2020, which peaked at over 11%.
The repricing of interest rates and credit spreads, while unpleasant, set the stage for more favorable forward returns. This can be seen in the Fund’s improved YTW metric. As a reminder, YTW has historically been a reasonable predictor of forward returns. The Fund’s YTW increased from 3.3% in the first quarter to 5.0% on June 30, 2022 — far exceeding the Agg’s YTW of 3.7% on June 30.
This is the widest (positive) gap in YTW for the Fund versus the index since March 2020. The positive variance compared to the index is partially attributable to the Fund’s approximately 21.6% weight in floating-rate securities compared to no exposure in the Agg. The YTW for our floating-rate securities incorporates the market’s current expectations for higher short- term interest rates of 3-3.5% by year-end.
Portfolio Positioning
The table below shows how we have allocated capital to various sectors over the past quarter and year. Since our goal is to invest in sectors that we believe offer the best risk-adjusted returns, our allocations may change significantly over time.
|
Sector Allocation (% of net assets) |
|||||
|
6/30/2022 |
3/31/2022 |
Qtr Over Qtr Change |
6/30/2021 |
Yr Over Yr Change |
|
|
Corporate Bonds |
22.2 |
22.9 |
-0.7 |
30.3 |
-8.1 |
|
Corporate Convertible Bonds |
0.5 |
0.6 |
-0.1 |
1.0 |
-0.5 |
|
Asset-Backed Securities (ABS) |
24.0 |
21.3 |
+2.7 |
20.4 |
+3.6 |
|
Corporate Collateralized Loan Obligations (CLOs)* |
10.7 |
10.4 |
+0.3 |
7.2 |
+3.5 |
|
Commercial Mortgage-Backed Securities (CMBS) |
10.6 |
10.9 |
-0.3 |
10.1 |
+0.5 |
|
Agency Mortgage-Backed (MBS) |
1.1 |
1.2 |
-0.1 |
0.3 |
+0.8 |
|
Non-Agency Mortgage Backed (RMBS) |
0.5 |
0.6 |
-0.1 |
0.5 |
0.0 |
|
Municipal Bonds |
0.6 |
0.6 |
0.0 |
0.0 |
+0.6 |
|
Non-Convertible Preferred Stock |
0.5 |
0.7 |
-0.2 |
1.1 |
-0.6 |
|
U.S. Treasury |
37.5 |
37.0 |
+0.5 |
30.0 |
+7.5 |
|
Common Stock |
0.0 |
0.0 |
0.0 |
0.0 |
0.0 |
|
Cash & Equivalents |
2.5 |
4.2 |
-1.7 |
6.3 |
-3.8 |
|
TOTAL |
100 |
100 |
100 |
||
|
High Yield** |
12.1 |
12.9 |
-0.8 |
15.0 |
-2.9 |
|
Average Effective Duration |
5.2 |
4.8 |
+0.4 |
4.7 |
+0.5 |
|
Average Effective Maturity |
8.0 |
7.3 |
+0.7 |
6.4 |
+1.6 |
*Corporate CLOs are included in the ABS segment in the Fund’s schedule of investments but are additionally called out separately for the purposes of the discussion. **For the current period, high- yield exposure consists of investments in the Corporate, Corporate Convertible, ABS, and CMBS sectors.
The only meaningful change in sector allocation during the quarter was a 2.7% increase in asset-backed securities (ABS). Credit spreads in ABS have widened materially, which we believe has greatly improved their relative value compared to investment- grade corporate bonds.
In terms of overall portfolio metrics, average effective maturity increased to 8.0 years as of June 30, 2022, from 7.3 years as of March 31, 2022, and the average effective duration increased to 5.2 years from 4.8 years over the same timeframe. These measures provide a guide to the Fund’s interest rate sensitivity. A higher average effective maturity and longer average effective duration increase the Fund’s price sensitivity to changes in interest rates (either up or down). As of June 30, 2022, the average effective duration of the Agg was 6.4 years.
As of June 30, our high-yield exposure as a percent of net assets was 12.1%, down from 12.9% on March 31, 2022. We increasingly view the high yield market as attractive and will be looking to add exposure on further weakness.
Top Quarterly Contributors
Outside of cash, there were no segments of the portfolio that contributed positively to the Fund’s performance during the second quarter.
Top Quarterly Detractors
U.S. Treasury Bonds: U.S. Treasury holdings were the largest detractor to performance for the second quarter in a row. With an effective maturity of approximately 12 years, our Treasury portfolio was negatively impacted by rising interest rates across the curve.
Corporate Bonds: Investments in a wide variety of corporate bonds, including high yield, were the second largest detractor to performance in the quarter. High yield and longer maturity segments of our corporate bond portfolio underperformed the most.
Corporate CLOs: Corporate CLOs detracted from performance due to widening credit spreads.
Fund Strategy
Our approach consists primarily of investing in a diversified portfolio of high-quality bonds while maintaining an overall portfolio average duration of 3.5 to 7 years. We may seek to capture attractive coupon income and potential price appreciation by investing in longer-duration and lower-quality bonds when attractively priced. We may also invest up to 25% in fixed-income securities that are not considered investment-grade (such as high-yield and convertible bonds as well as preferred and convertible preferred stock), and we do so when we perceive the risk/reward characteristics to be favorable.
We do not, and will not, try to mimic any particular index as we construct our portfolio. We believe our flexible mandate and high-conviction portfolio will benefit investors over the long term. We utilize a bottom-up, research-driven approach and select portfolio assets one security at a time based on our view of opportunities in the marketplace. Our fixed income research is not dependent on, but often benefits from, the due diligence work our equity teammates conduct on companies and industries.
Overall, we strive to be adequately compensated for the risks assumed in order to maximize investment (or reinvestment) yield and to avoid making interest rate bets, particularly those that depend on interest rates going down. We have often maintained a lower duration profile than the index, particularly in very low-yield environments. Our shorter duration profile has benefited shareholders in periods of rising interest rates.
Maintaining a diversified portfolio and liquidity reserves is a key element of our risk management approach. As a result, we have not held back from owning U.S. Treasury bonds and, at times like now, ample cash reserves. We believe this approach has served our clients well, particularly in extreme market environments like the pandemic brought upon us in March 2020.
Outlook
While it is a near certainty that the Fed will continue raising short-term interest rates as the rest of the year progresses, the market has moved accordingly. Forward returns available to investors today have not been this attractive since the first and second quarters of 2020. Nominal rates on Treasuries have materially increased across the curve from a year ago. Credit spreads (the incremental return investors receive above Treasuries) have also increased materially, particularly in high yield. Please see this quarter’s Fixed Income Insights for further detail.
Some added historical perspectives of how long investors (particularly short-term) have been return/yield-starved — since April 2008, the Fed Funds rate (a key driver of returns for short-term investors) has spent only six months above 2%. The Fed appears set to breach that level (2%) — and then some in the second half of 2022. The more common experience for investors during and after the Great Financial Crisis of 2008/2009 was dealing with and suffering through nearly 9 (!) years of zero interest-rate policy (ZIRP). May ZIRP RIP.
Widespread worry/concerns/fears/confusion about the macro environment (further inflation, stagflation, possible recession, consumer spending slowdown, etc., etc.) often present opportunities for the fundamental investor. We believe now is one of those times — and the Weitz Core Plus Income Fund is well-positioned, as described above, to take advantage of today’s opportunities and any further valuation disparities that may develop. While there could still be some price declines ahead, as timing is always uncertain, we see greener pastures from today’s levels.
Editor’s Note: The summary bullets for this article were chosen by Seeking Alpha editors.
Be the first to comment