

Aussie Dollar, NZ Dollar Analysis
- Poor Chinese data and reports of further lockdowns in Shanghai weigh on AUD,NZD
- AUD/USD and NZD/USD risk further depreciation as key levels of support some into play
- US dominated risk events ahead: US CPI, PPI, FOMC minutes and consumer sentiment
Recommended by Richard Snow
Get Your Free AUD Forecast
Poor Chinese Data and Reports of further Lockdowns in Shanghai
China has been the subject of attention ever since lower revisions to global growth emerged. China is a massive global trading partner and proved to the top buyer of commodities during the expansion that ensued after global lockdowns, something that has changed since commodity markets peaked. According to the Asian Development Bank China is set to grow slower than the rest of developing Asia for the first time in three decades (5.3% vs 3.3%).
While China is an important player in the global economy, it is particularly important to the regions around it, like Australia and New Zealand, a phenomenon explained in the core-perimeter model. News of increased Covid cases in Shanghai – Chinas most populous city – once again threatens domestic growth which has a negative effect on AUD and NZD via association. In addition, China’s service PMI joined the composite reading in contractionary territory of 49.3.
Locally, measures of consumer confidence have seen a sharp decline as China’s zero Covid policy takes strain on output.
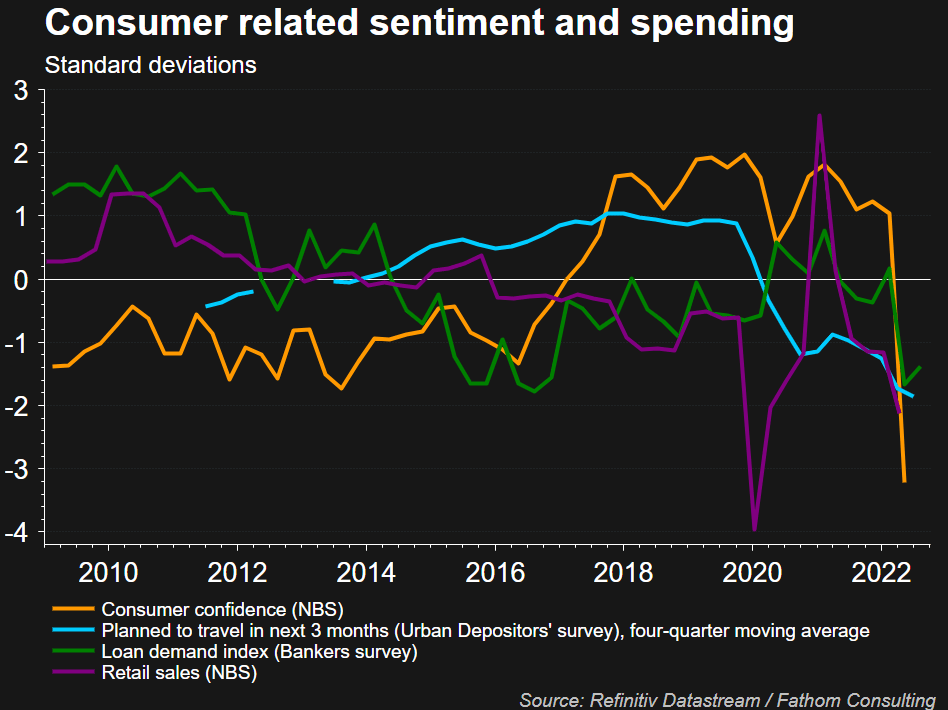
Source: Refinitiv, prepared by Richard Snow
The Australian dollar has taken another step lower, partly due to its correlation to risk assets like the S&P 500 which sold off after the strong NFP job gains on Friday, and partly due to the weak Chinese PMI data. Technically, AUD/USD appears to have broken below the long-term zone of support. The latest leg lower comes after a period of consolidation whereby it wouldn’t be out of the ordinary to see a pullback towards the now zone of resistance.
Levels of support appear very far away given the extremes that AUD/USD has dropped to, with the 2008 level of 0.6310 the nearest level insight.
AUD/USD Daily Chart
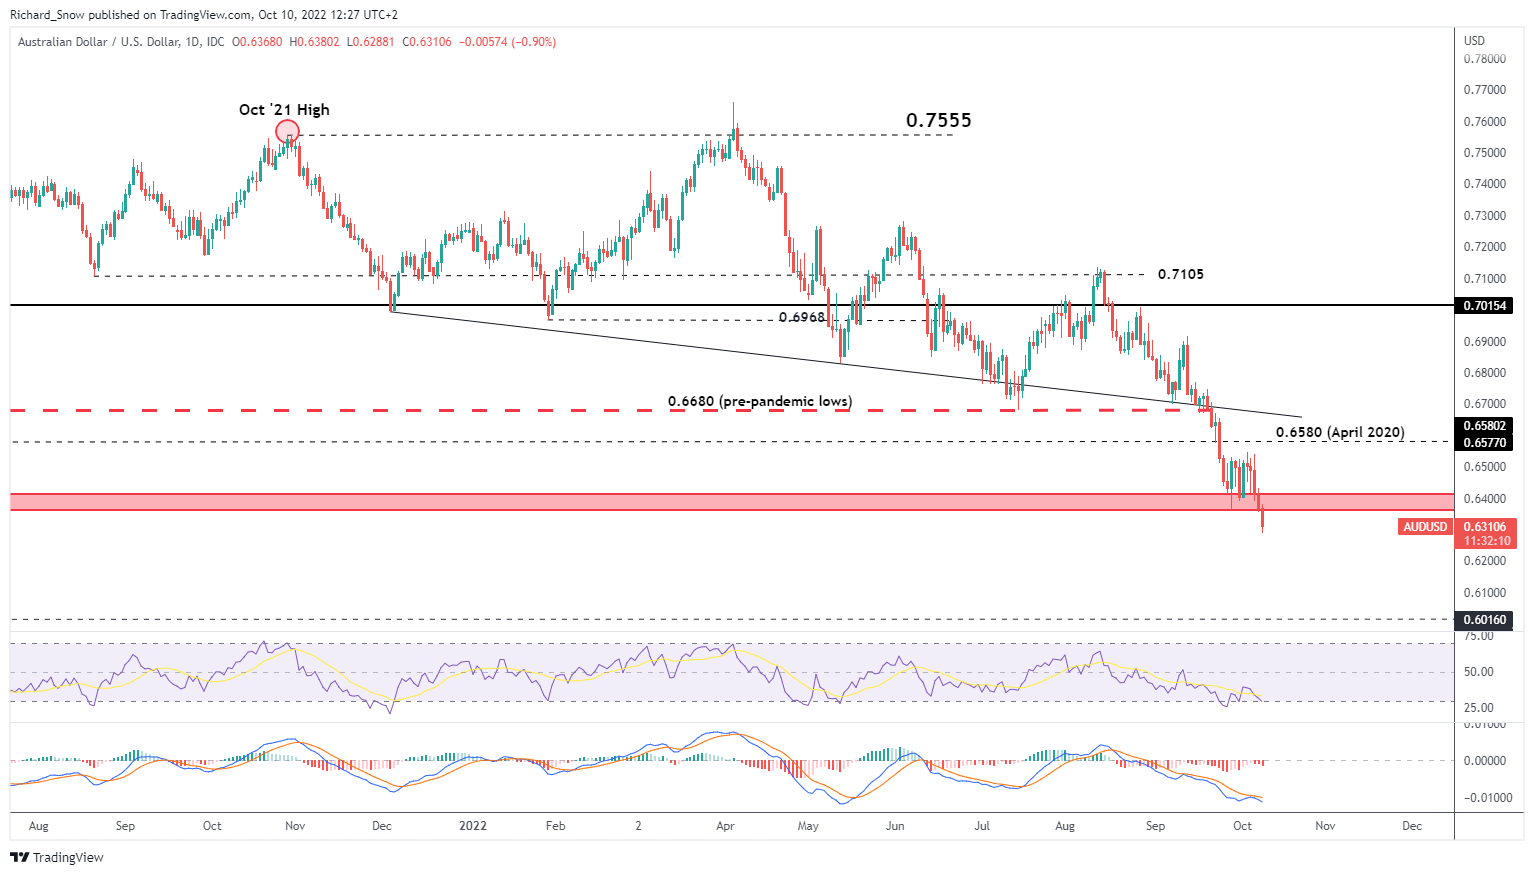
Source: TradingView, prepared by Richard Snow
NZD/USD has followed the same trajectory and has sold off since facing a short-term zone of resistance 0.5800, now heading towards the yearly low of 0.5565. A breakdown below the low would bring into focus the full retracement of the 2020-2021 major move at 0.5470, followed by the October 2008 level of 0.5357. Resistance appears back at 0.5800.
Despite the RBNZ hiking rates aggressively, the Kiwi dollar has really struggled to hold up against the dollar and the situation may get worse now that markets have just about priced in 75 bps for the Fed in November.
NZD/USD Daily Chart
Source: TradingView, prepared by Richard Snow
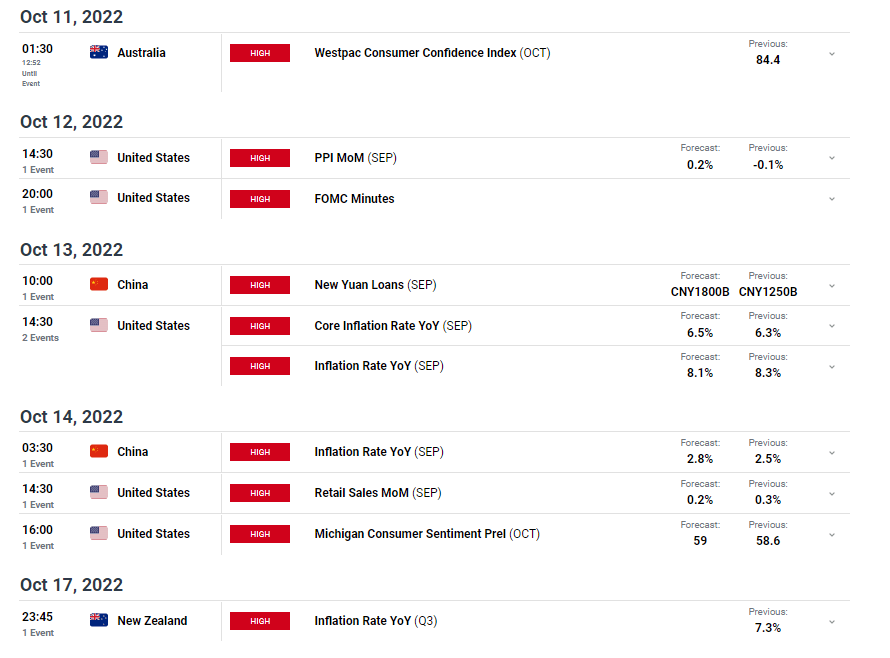
Main Risk Events Ahead
This week, we see a return to dominance for US data, with PPI data and FOMC minutes due on Wednesday. Thursday we see CPI data out of the US forecasted at 8.1%. Last month, markets propped up risk assets in anticipation of cooler inflation only for the move to be fully reversed upon the realization that inflation appears to be here to stay. On Friday, Chinese inflation, US retail sales and the University of Michigan consumer sentiment data rounds up the week
Customize and filter live economic data via our DaliyFX economic calendar
Trade Smarter – Sign up for the DailyFX Newsletter
Receive timely and compelling market commentary from the DailyFX team
Subscribe to Newsletter
— Written by Richard Snow for DailyFX.com
Contact and follow Richard on Twitter: @RichardSnowFX
Be the first to comment