

Joe Raedle/Getty Images News
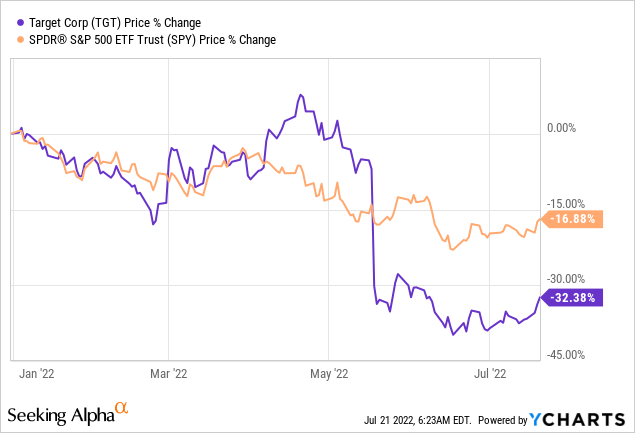
Target Corporation (NYSE:TGT) has lost more than 32% of its market value year-to-date, compared to the 17% decline of the S&P500. Elevated costs, driven by rising inflation and a challenging macroeconomic environment, cut into TGT’s bottom line, sparking a 25% drop in its share price in May. The underperformance of the stock in 2022 is mainly attributable to the weaker-than-expected first quarter results and guidance.
In our previous article, we highlighted several points what we like about Target’s business, including its safe and sustainable dividend payments and its long track record of share buybacks. However, we rated TGT’s stock as “hold,” due to its overvaluation. In this article, we will analyze how TGT’s stock price developed during periods of low consumer confidence in the last 20 years, and we will highlight why we believe that TGT’s stock could be attractive at the current valuation.
Performance during periods of low consumer confidence
Consumer confidence is normally referred to as a leading economic indicator, which could be used to predict potential near-term changes in the spending behavior of the consumer. U.S. consumer confidence has been declining steadily in 2022, falling below levels that were observed during the 2008-2009 financial crisis.
U.S. Consumer confidence (Tradingeconomics.com)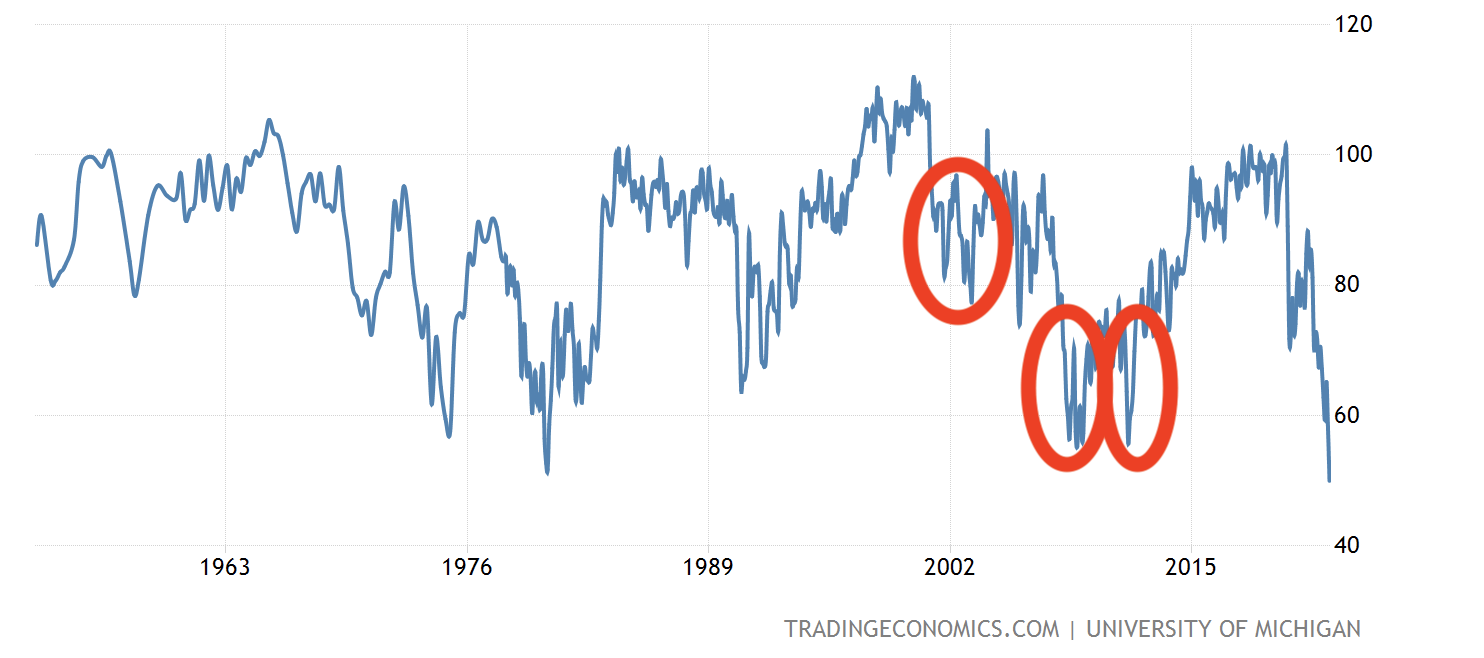
Low or declining consumer confidence is likely an indication that people are concerned about their financial situation/outlook and are more reluctant to spend larger sums of money. This could lead to a decreasing demand for durable, discretionary, non-essential products. As Target is selling products, which are mostly categorized as consumer discretionary, we believe that a low confidence could have an impact on its financial performance.
But let us take a look at how TGT has actually performed in the past during times of low confidence, marked by the red circles on the above graph.
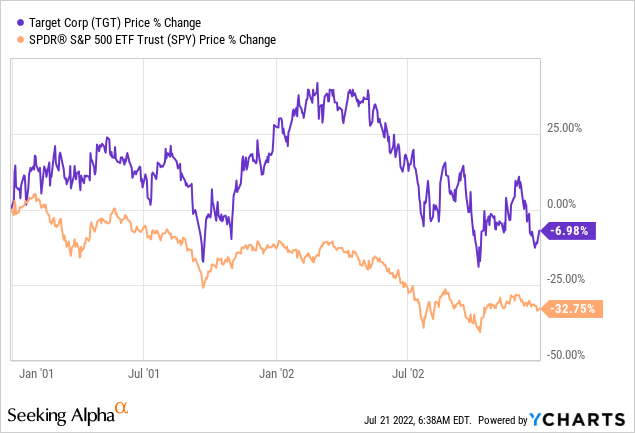
2001-2003
While the broader market has declined by as much as 33%, TGT has lost only 7% of its market value.
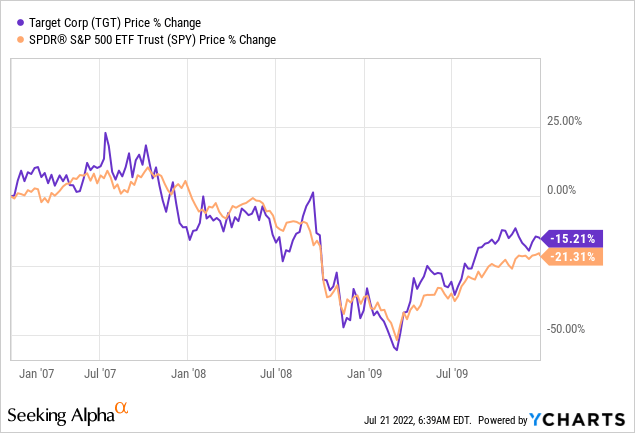
2007-2010
Between 2007 and 2010, the period primarily defined by the financial crisis, TGT has also outperformed the broader market. Despite being down at one point by more than 50%, in 2009, the stock has partially recovered, losing eventually only 15% of its market value in this time frame.
2011-2013
In this time period, however, TGT has actually underperformed. TGT’s stock price has declined by about 2%, while the broader market gained as much as 13%.
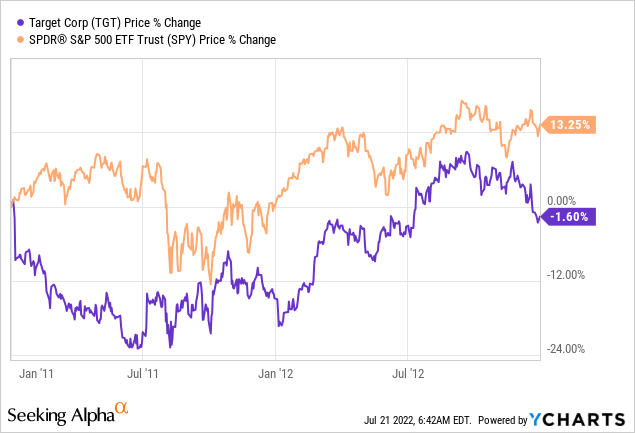
To sum up, TGT 2 out of 3 times has outperformed the broader market during periods of low consumer confidence. Although past performance is not always a suitable indicator for future performance, we believe that the negative impacts of declining consumer confidence, decreasing margins and various macroeconomic headwinds are already priced in. For this reason, we believe that TGT is well-positioned to outperform in the near term.
Let us now take a look at, what the fair value of TGT’s stock could be using the Gordon Growth Model (GGM).
Valuation
Gordon Growth Model
The Gordon Growth Model is one of the simpler dividend discount models, which can be applied to value the equity of firms that are paying dividends. The main underlying assumption of this model is that the dividend grows indefinitely at a constant rate. Because of this criterion, the model is particularly suitable for the valuation of firms that are:
-
Paying dividends
-
In the mature growth phase
-
Relatively insensitive to the business cycle
Also, an advantage is the firm has a long track record of dividend payments combined with dividend growth.
Although TGT may not be completely independent of business cycle fluctuations, we believe that its dividend and dividend growth history makes it a suitable candidate for the GGM.
The Gordon Growth Model is defined by the following formula:
Gordon Growth Model (Wallstreetprep.com)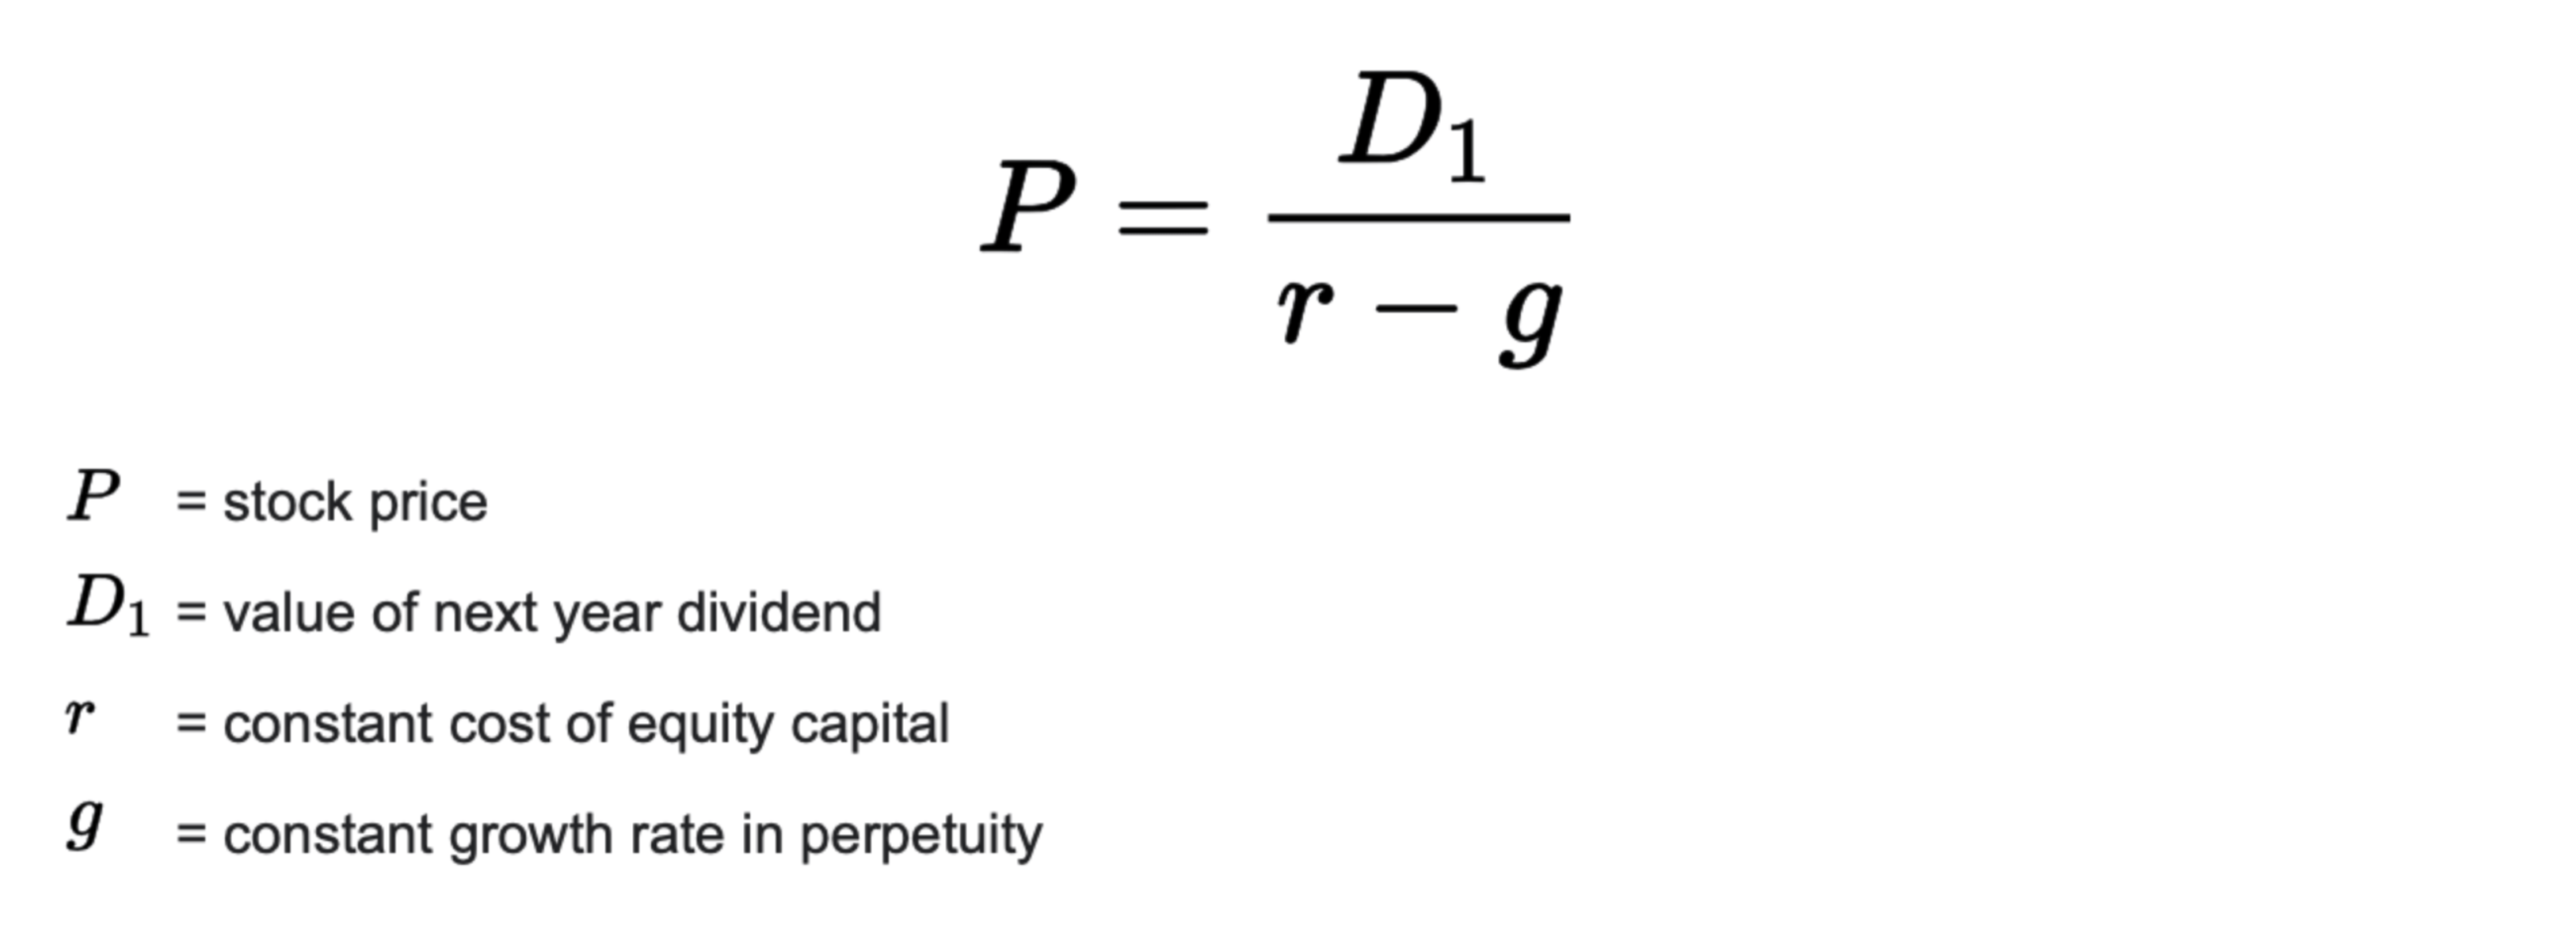
To evaluate the intrinsic value of the stock in a meaningful way, a set of assumptions need to be made:
1.) Required rate of return
When defining the required rate of return, we are normally inclined to use the firm’s weighted average cost of capital (WACC).
The firm’s WACC is estimated to be in the range of 6.5% to 7.75%. To stay on the conservative end of the spectrum, we will be using 7.5%.
WACC (Finbox.com)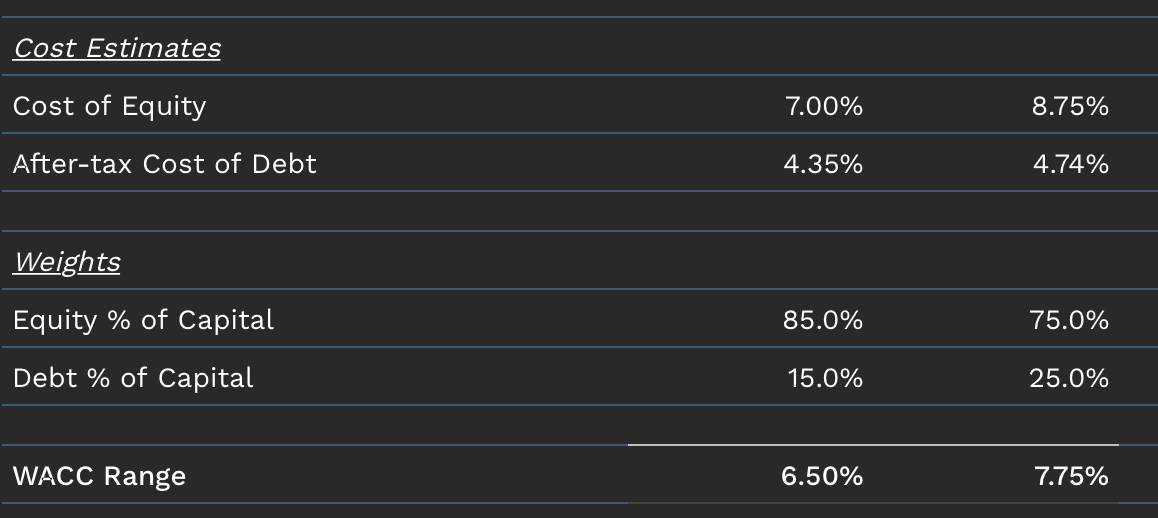
2.) Perpetual dividend growth rate
To determine a realistic rate, we have to take a look at TGT’s dividend payment history and try to establish a reasonable long-term trend.
The following shows depict TGT’s dividend payment history. The firm has been paying dividends for 54 years consecutively and has been increasing this dividend in each year. The current annual dividend payment is estimated to be $4.32 per share.
Dividend history (Seekingalpha.com)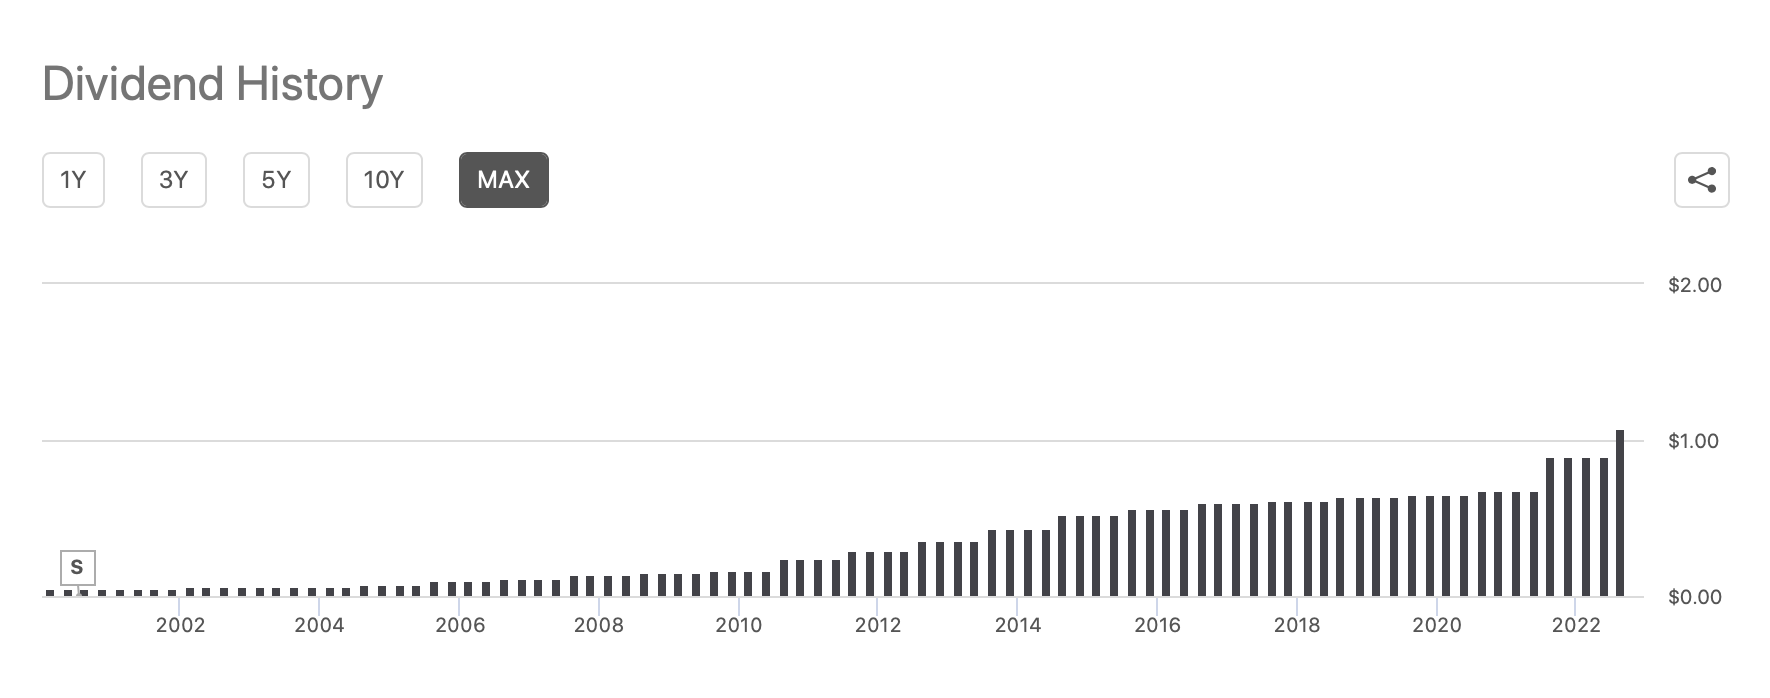
To account for uncertainty, we will be using a range of growth rates for our calculation.
Dividend growth (Seekingalpha.com)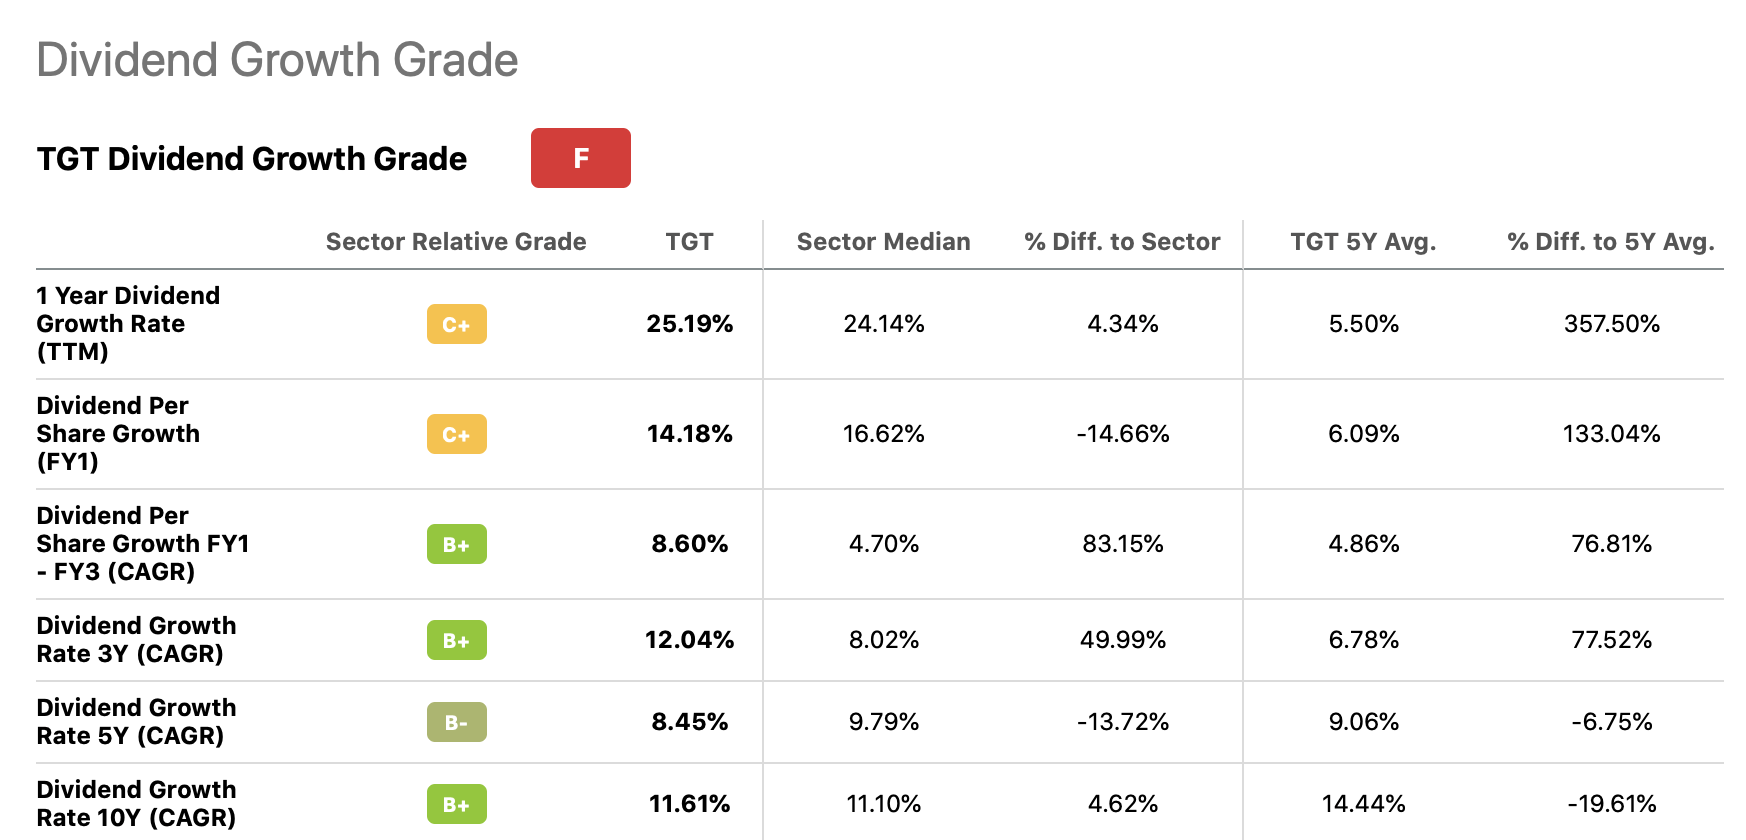
The historical dividend growth rates according to this table appear to be upward biased. The relatively large dividend increases in the last years distort the average growth rates for the above-mentioned periods. In our opinion, such high dividend growth rates are not likely to be sustainable in perpetuity.
On the other hand, in the period between 2016 and 2020, dividend growth rate has been relatively constant, about 4% per year.
For our calculation, we will be using a range of 3% to 5%. The results for these assumptions are summarized in the table below.
Results (Author)
Although at 4% the firm appears to be overvalued, we believe that we were relatively conservative with our assumptions. In our opinion, due to the higher dividend growth in the past years, the firm is about fairly valued at the current price.
Let us take a look at what the justified P/E ratio could be for TGT.
Justified price-to-earnings ratio
Price multiples are often used separately from present value models. Because of this, many criticize the use of such ratios, claiming that they are backward-looking. On the other hand, the Gordon growth model could be applied to relate fundamentals through a discounted cash flow model. This method makes it possible to determine a so-called justified price-to-earnings ratio.
Justified P/E (Corporatefinanceinstitute.com)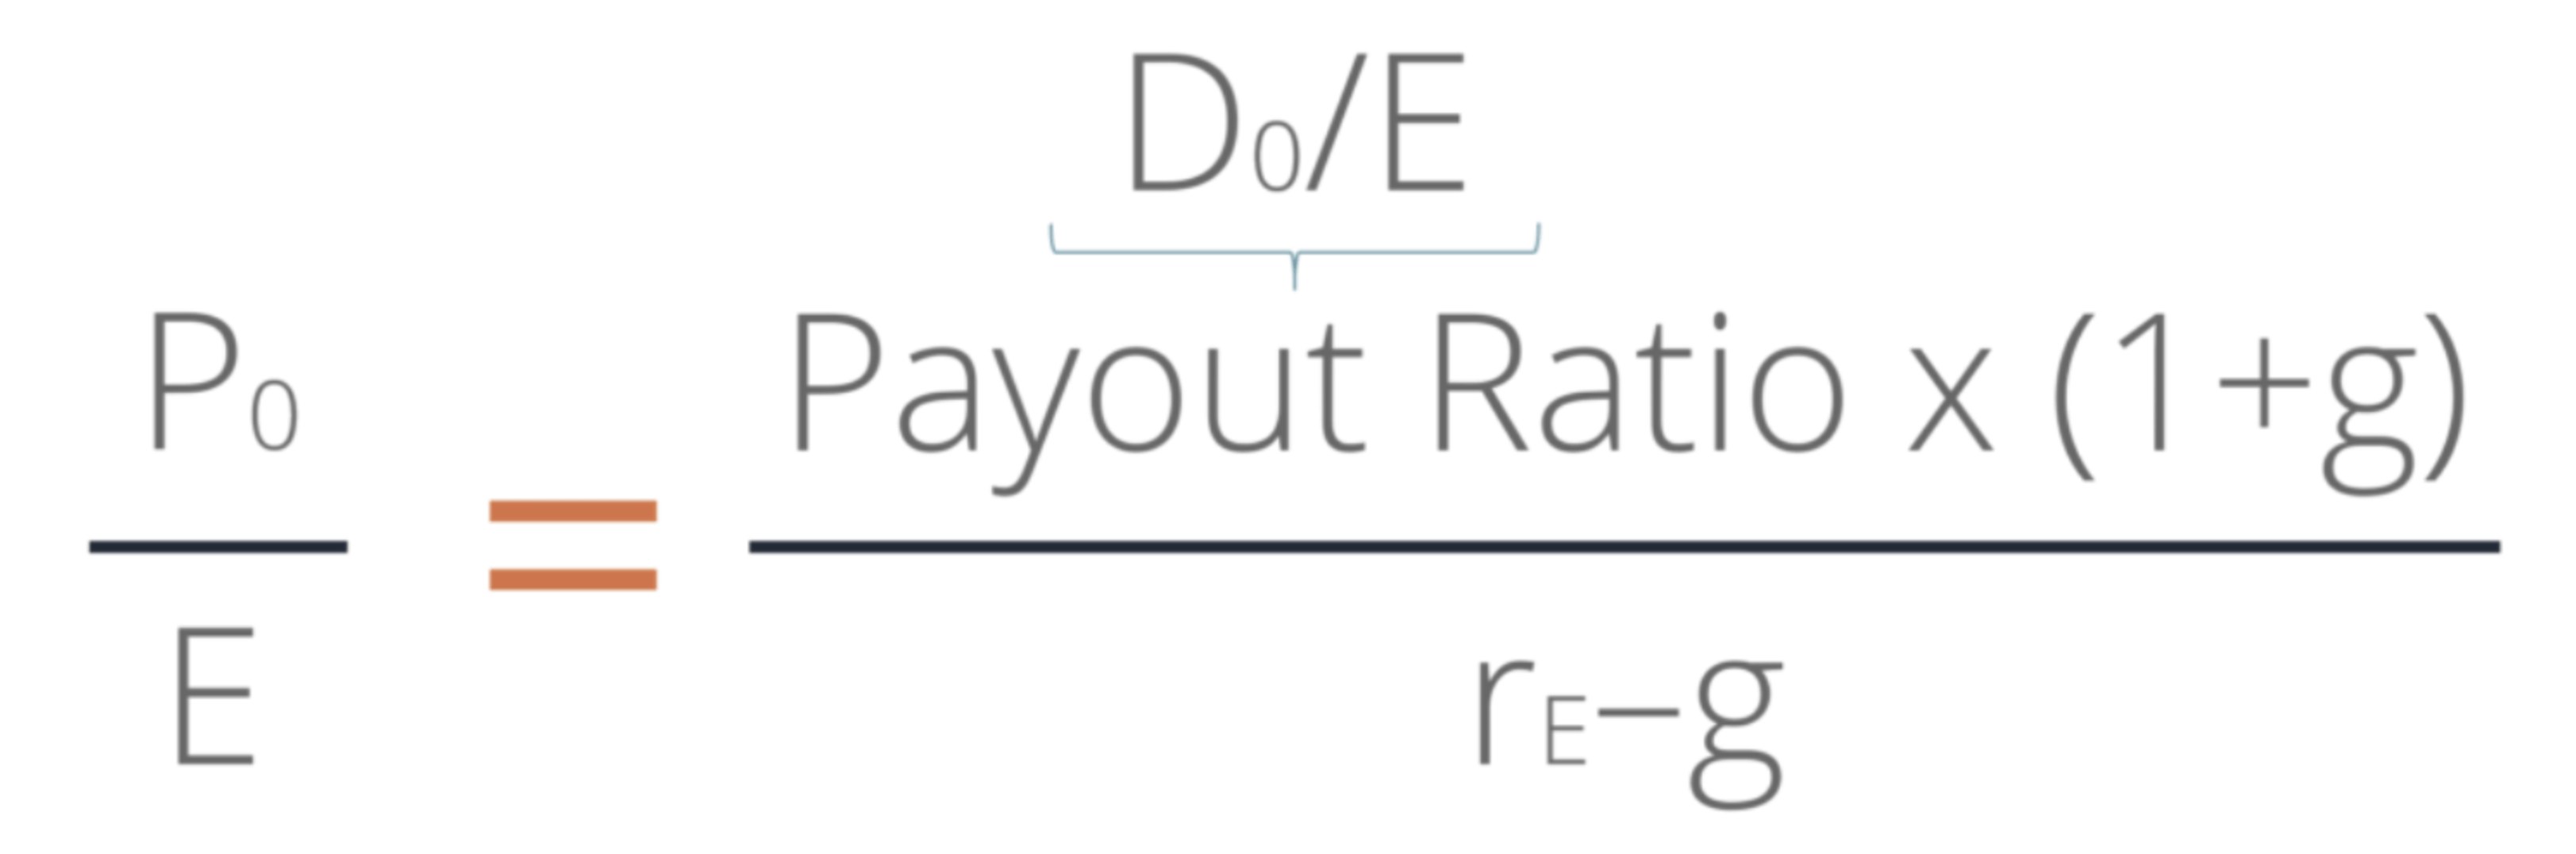
For this calculation, we stay with our previously defined required rate of return assumption of 7.5%. For the estimated dividend growth rate we also keep our the 3%-5% range.
The following chart and table depict the firm’s dividend payout ratios historically.
Dividend payout (Seekingalpha.com) Payout ratio (Seekingalpha.com)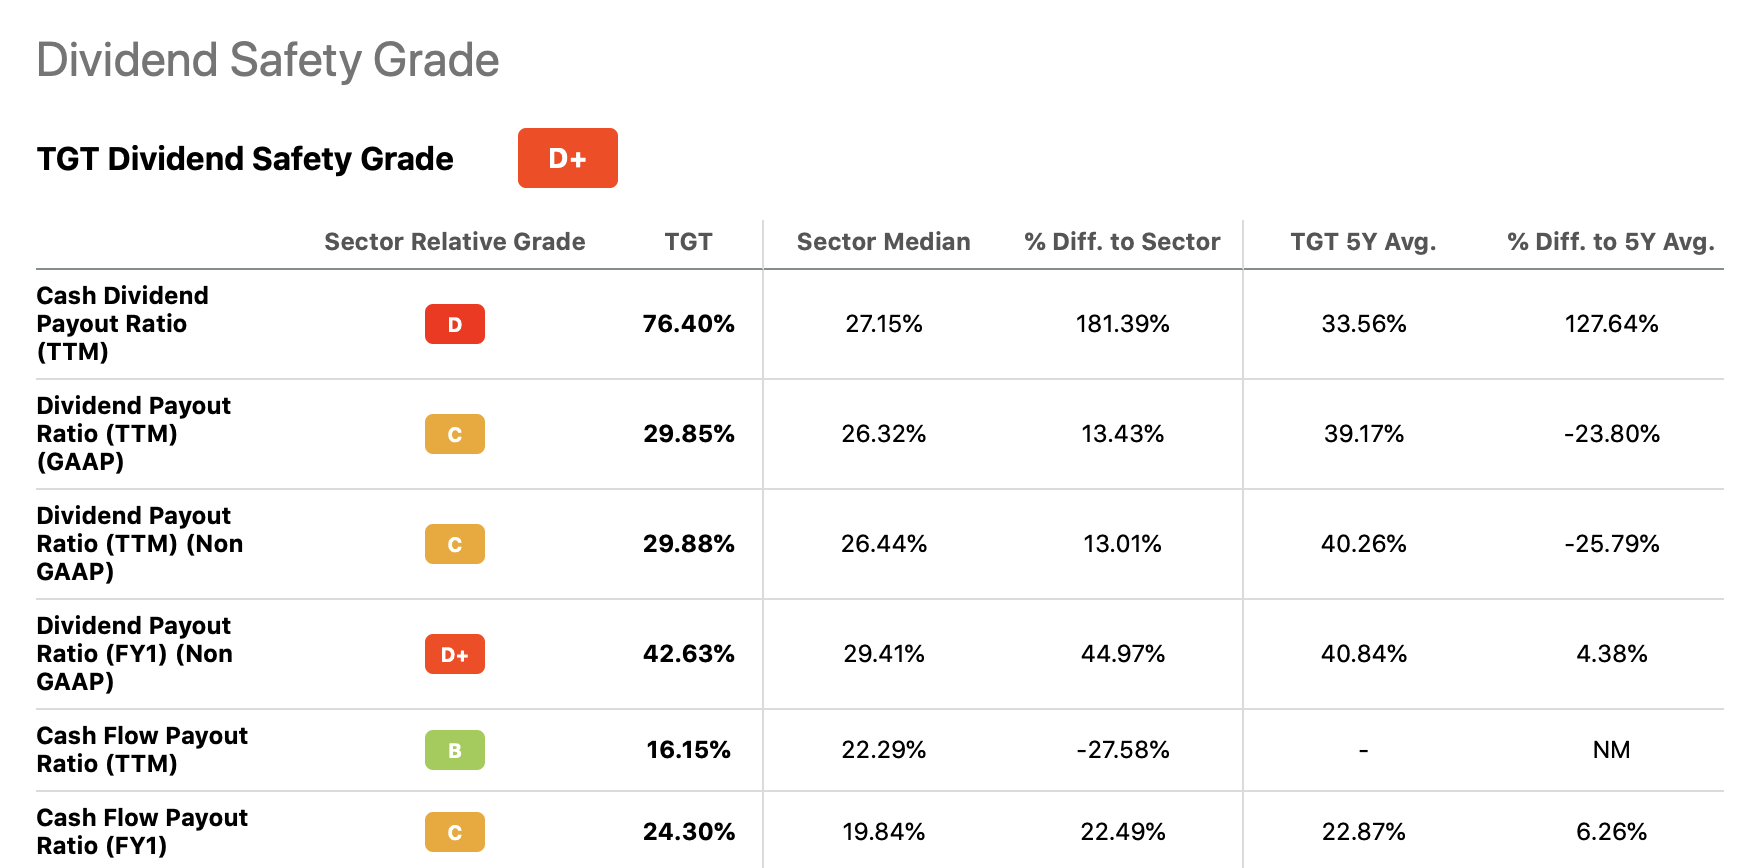
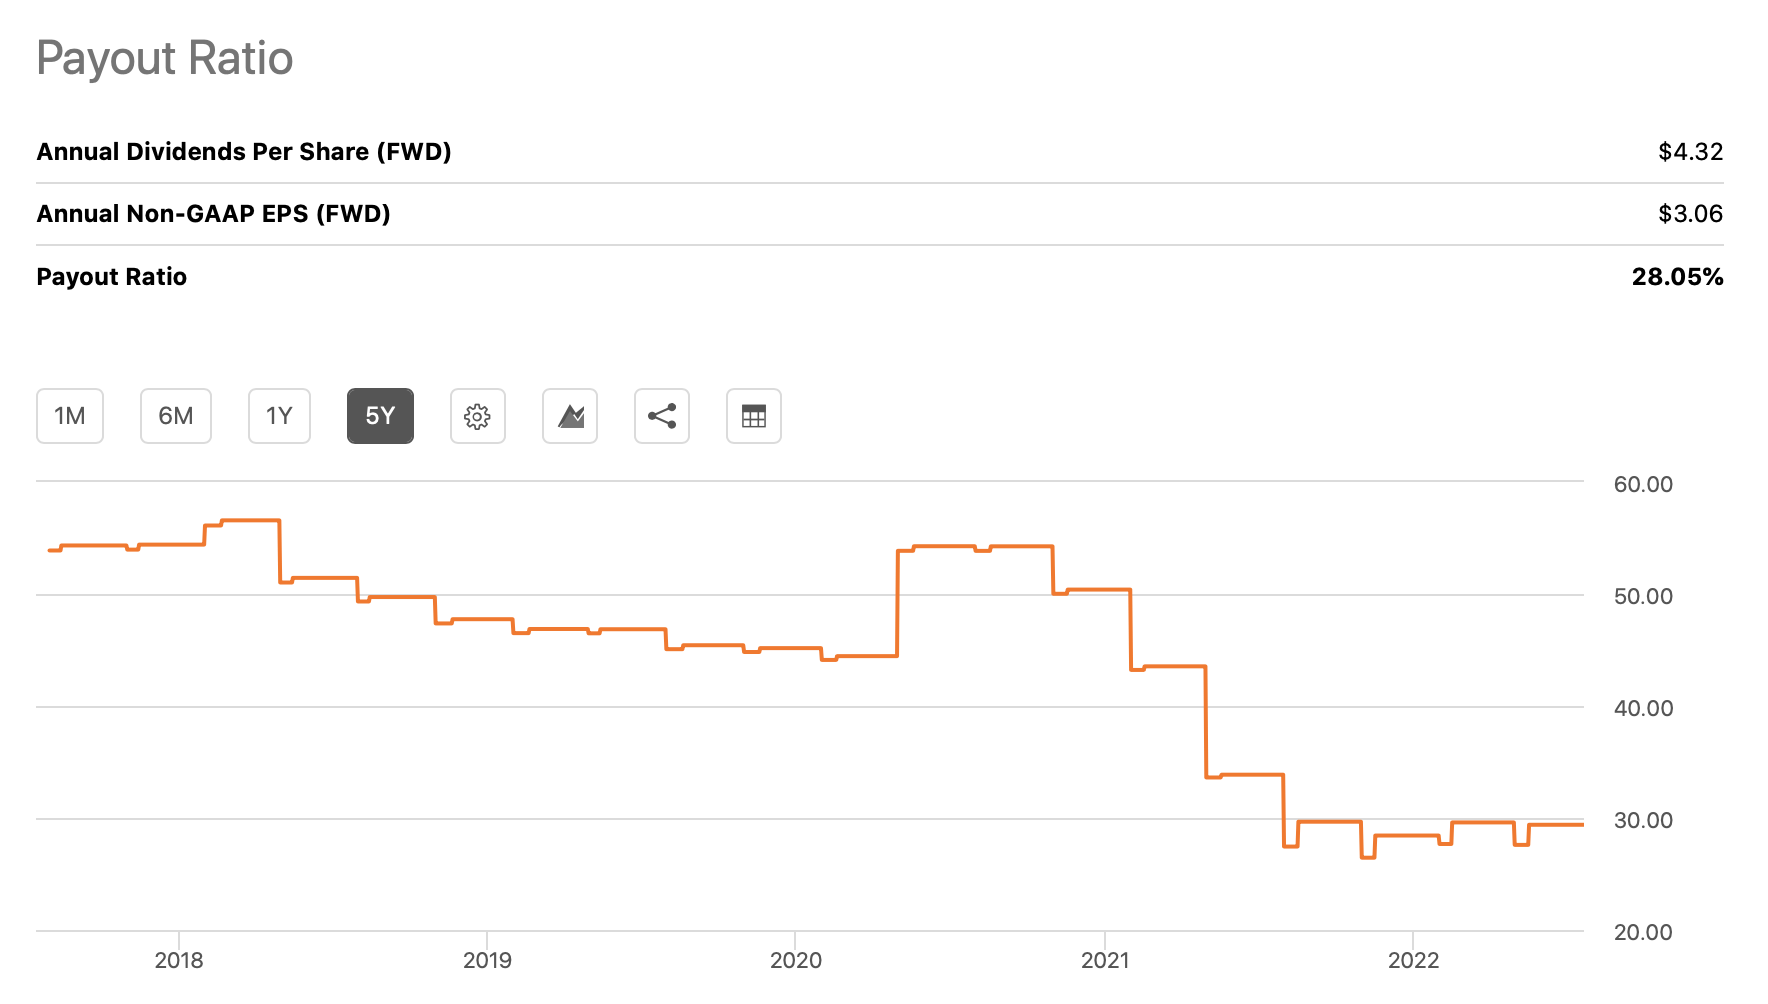
According to historic data, a payout ratio range of 30% to 50% appears to be a realistic assumption.
Using these assumptions, the following table summarizes the results.
Results (Author)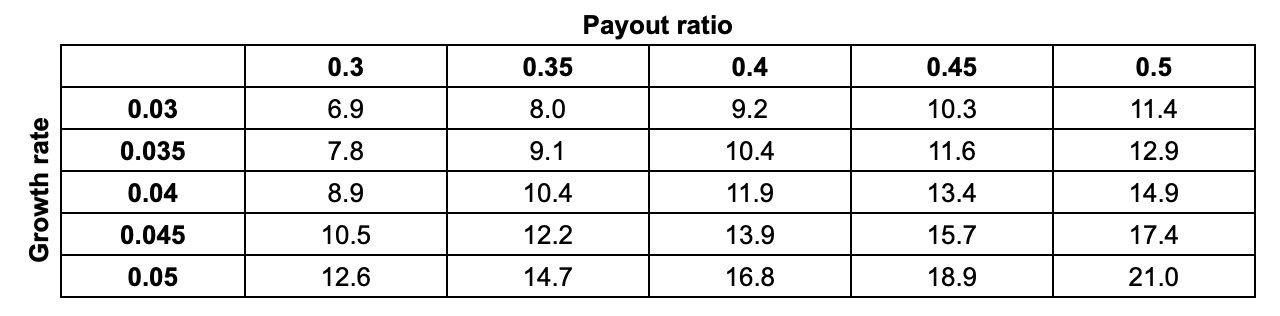
Based on these calculations, we believe that TGT’s stock could be attractive at the current price levels for investors looking for a safe, sustainable and growing dividend, as TGT’s current P/E GAAP (TTM) is only 12.7x.
Key Takeaways
In our previous article, we have rated TGT’s stock as hold, due to its overvaluation. Since then, the stock price has fallen by about 27%. In our opinion and according to our calculations, the stock appears to be fairly valued at the current price levels, which could make TGT an attractive candidate for investors looking for safe, sustainable and growing dividend payments.
We believe that the negative impacts of the macroeconomic headwinds are already priced in.
For these reasons, we upgrade TGT from hold to buy.
Be the first to comment