

PM Images
Written by Nick Ackerman, co-produced by Stanford Chemist. This article was originally published to members of the CEF/ETF Income Laboratory on November 6th, 2022.
Earlier this year, Western Asset Diversified Income Fund (NYSE:WDI) bumped up their distribution a little bit. Now, they’ve bumped it up a little bit more since that previous update.
This once again highlights that the declining value of the portfolio isn’t impacting the income generated. In fact, the latest semi-annual report shows us that income generation in the fund had accelerated with an increase in the net investment income or NII. Enough so that seeing further increases in the future are a real possibility.
The value of the underlying portfolio is being negatively impacted due to increasing interest rates. The Fed doesn’t seem set to end raising rates any time soon, either. So there definitely could be some further pressure going forward. At the same time, the fund is trading at a deep discount, which could potentially provide an attractive entry level for investors.
The Basics
- 1-Year Z-score: -0.73
- Discount: 12.64%
- Distribution Yield:11.84%
- Expense Ratio: 1.48%
- Leverage: 31.19%
- Managed Assets: $1.15 billion
- Structure: Term (anticipated liquidation date, June 24th, 2033)
WDI’s objective is “to seek high current income. As a secondary investment objective, the fund will seek capital appreciation.” They will bring a “flexible and dynamic” approach. They anticipate doing this by rotating sectors and securities in response to market conditions, focusing on what we believe are undervalued securities with attractive fundamentals.
For greater flexibility, they have no restrictions on investing in investment-grade or below investment grade. Meaning that they will span the credit quality spectrum, leading to a truly multi-sector bond fund with limited constraints. This can be a positive if they can successfully manage it. It leaves investors a bit more in the dark and more reliant on the management team to operate the fund.
The fund is leveraged, which would bring the total expense ratio up to 1.82%. However, while higher interest rates will negatively impact the leverage by increasing the costs, the fund is also hedged. They utilize both futures and interest rate swaps. By selling Treasury futures short, they can realize a gain if Treasury prices decrease. This happens when interest rates rise. Interest rate swaps work similarly. They can essentially swap a variable rate for a fixed rate.
WDI Interest Rate Swaps (Western Asset)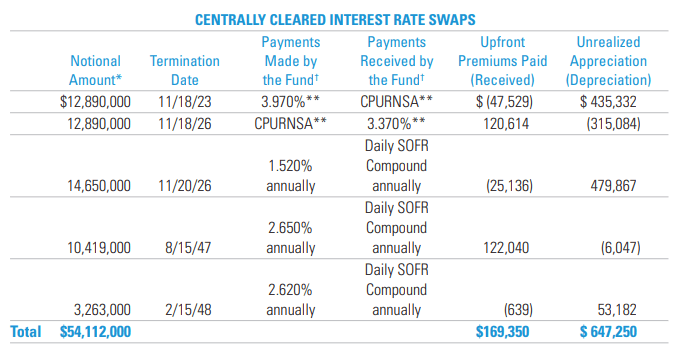
Performance – Attractive Discount
One of the more attractive features of the fund is the discount. The fund is newer, but it swiftly went to a wide discount. This tends to happen with any new CEF. In particular, a fixed-income fund would have it especially hard coming to market in a rising rate environment.
They launched in mid-2021, so it wasn’t too long after that the Fed began indicating higher rates would be coming. Clearly, not for the income-generation potential, but for the underlying bond prices.
Ycharts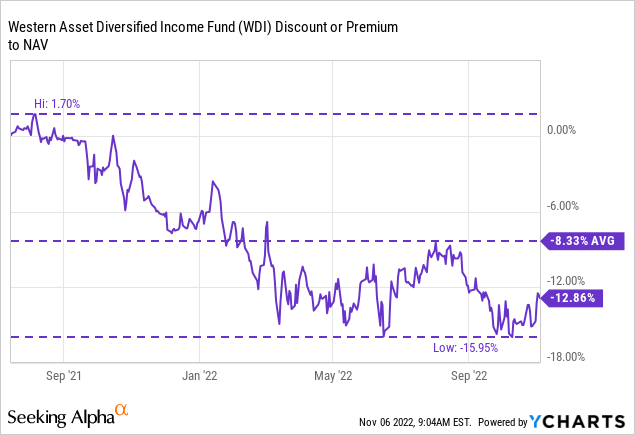
Given the environment and the understanding that bond prices are being reduced to higher rates, it isn’t too surprising to see negative returns thus far.
Ycharts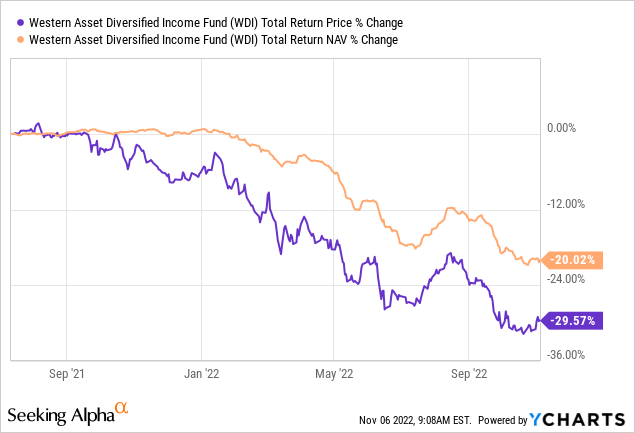
The question now would become how much higher an investor believes rates could go from here. The Fed had announced they now see rates heading higher than their original 5% target. We are near 4% for the effective Federal Funds rate. This has been a fast-paced, rapid ascension of rates through 2022.
Ycharts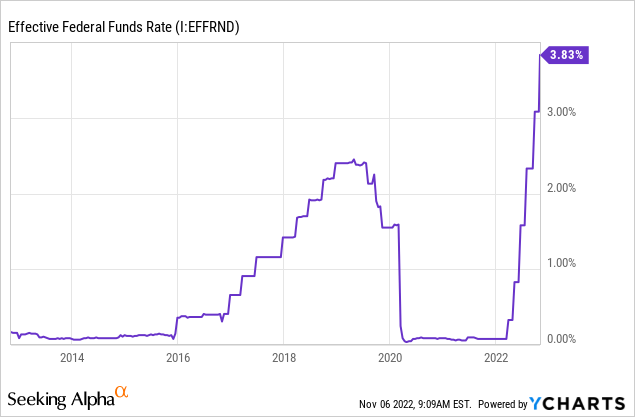
The other question becomes how and what the Fed is going to break with rates rising so rapidly. Therein lies another risk worth considering, the credit risk. Credit risk exists due to WDI’s portfolio containing heavy exposure to below-investment-grade bonds and loans. Those types of companies and issuers that aren’t as financially stable and a bump in the economy can send them into default.
Therefore, if rates rise another 1 or 2%, things can probably start to stabilize. However, if we double again from here, then we could see meaningfully lower lows in the market and WDI.
WDI’s effective duration is 4.40 years. That means that for every 1% increase in interest rates, WDI’s portfolio would be expected to decline by 4.4%. Given the ~20% total NAV return decline, we’ve clearly seen a lot of this play out.
Distribution – Another Raise, Fully Covered
Another raise in the distribution from WDI brings us up to a $0.125 monthly payout. This was after they initiated a $0.117 payout to start.
Ycharts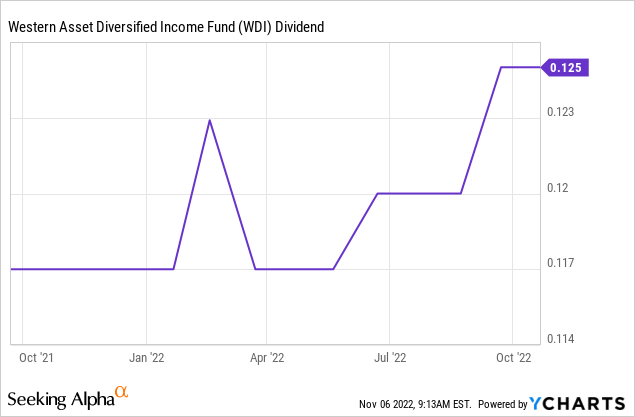
There is room for further increases going forward, too. NII coverage at the end of June came to 109.4%. NII of $39.956 million was also a bump up from the previous quarter. They reported $18.679 million in Q1, which doubled works out to $37.358 million to equal the equivalent six-month period. Since Q1 is included in the semi-annual report, it would suggest that the earnings generation of the portfolio accelerated in Q2.
WDI Semi-Annual Report (Western Asset)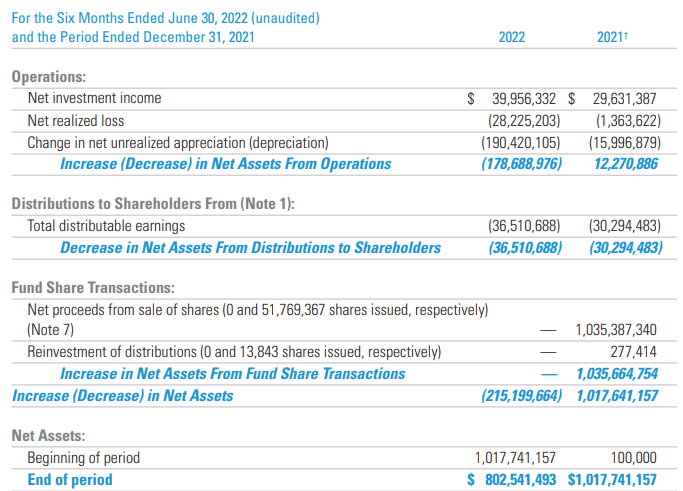
However, since they raised the payout since then, we need to recalculate how much the estimated annual payout would cost them. In this case, the annualized payout comes to $1.50, and they last reported 51,788,210 shares outstanding.
That gives us a total annual payout estimate of $77.682. That makes the potential annualized NII of $79.913, based on this latest semi-annual report, more than enough to cover the payout. There is even additional capacity to bump up the payout again. This is especially true if they can boost NII again due to their floating rate exposure.
For tax purposes, the entire distributions paid in 2021 were ordinary income. As a fixed-income fund, it would generally mean it is more appropriately held in a tax-sheltered account. As they hold bonds and loans that bear interest, this is likely to be the case regularly.
WDI Tax Character (Western Asset)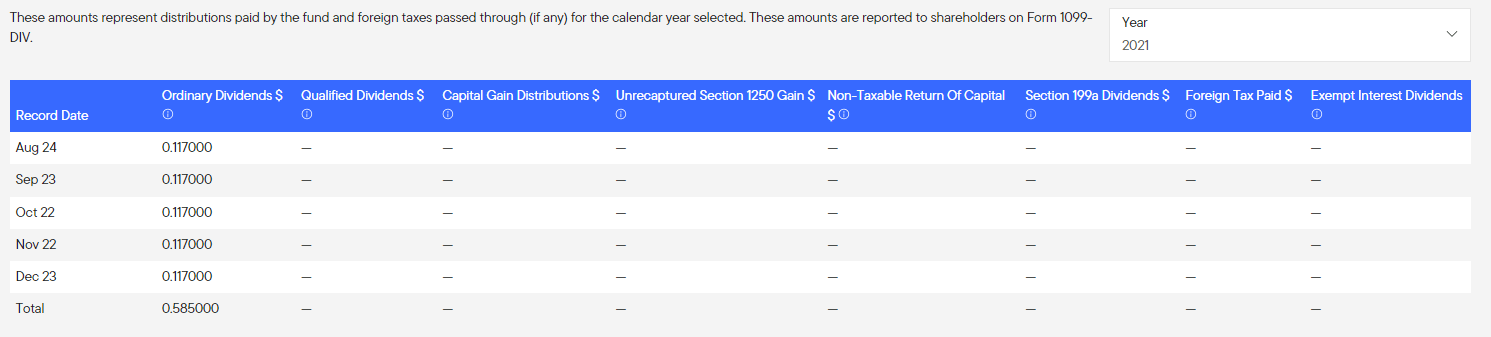
WDI’s Portfolio
Now, time to look at what kind of junk this fund has in its trunk.
The credit quality breakdown shows us that it is quite a bit.
WDI Credit Breakdown (Western Asset)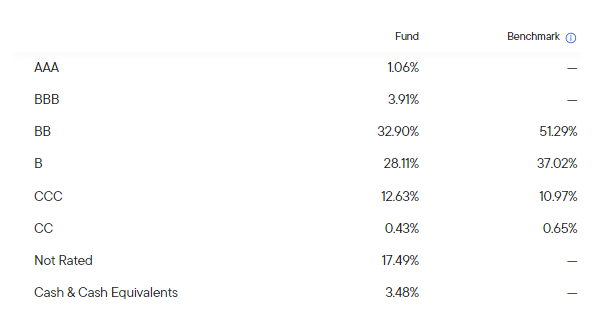
The overwhelming majority of the portfolio is allocated to BB and B. Definitely not the junkiest portfolio in the CEF space, but we also have a fairly substantial portion allocated to CCC.
CCC is the type of debt that is “vulnerable to nonpayment.” They need just about everything to go right, or they will default. Thus, an allocation of this portion of the portfolio is very likely not to survive through 2023.
The portfolio turnover was last reported at 25%. For six months, that would suggest they could turn over about half of their portfolio yearly. This makes them not overly aggressive, but also not very passive either. This is good because they can potentially maneuver away what they feel are the most vulnerable bonds and loans in the CCC tranche.
Looking at where the portfolio is invested, it is truly a multi-sector bond fund. We have the highest allocation to high-yield bonds. This is then followed by substantial allocations to bank loans, collateralized loan obligations (CLOs) and commercial mortgage-backed securities (CMBSs).
WDI Portfolio Exposure (Western Asset)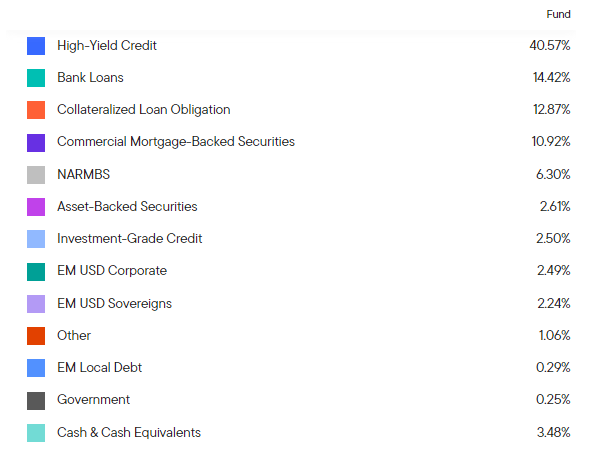
We also have NARMBS. It sounds like one of those things that could break when central banks are aggressive. It’s always those acronyms that come out of nowhere.
In this case, it isn’t so nefarious. It stands for non-agency residential mortgage-backed securities.
When looking at the portfolio, the bank loans and CLO exposure is going to be the one that offers the most cushion against higher rates. This is because they are going to be overwhelmingly based on floating rates. This is where the higher income generation capability of the portfolio is presumably coming from as rates rise.
Additionally, the RMBS and CMBS can have some variable rate exposure. The vast majority will be fixed-rate, though.
While 2023 is likely to be rough if we experience a recession that most expect, loan exposure can have some protection. Loans are higher in the capital stack than bonds. Therefore, the recovery rate is going to be higher when things start to go south.
When looking at the fund’s top positions, we can see that the weightings in each position are rather low. Meaning, there is no high concentration in any one name.
WDI Top Positions (Western Asset)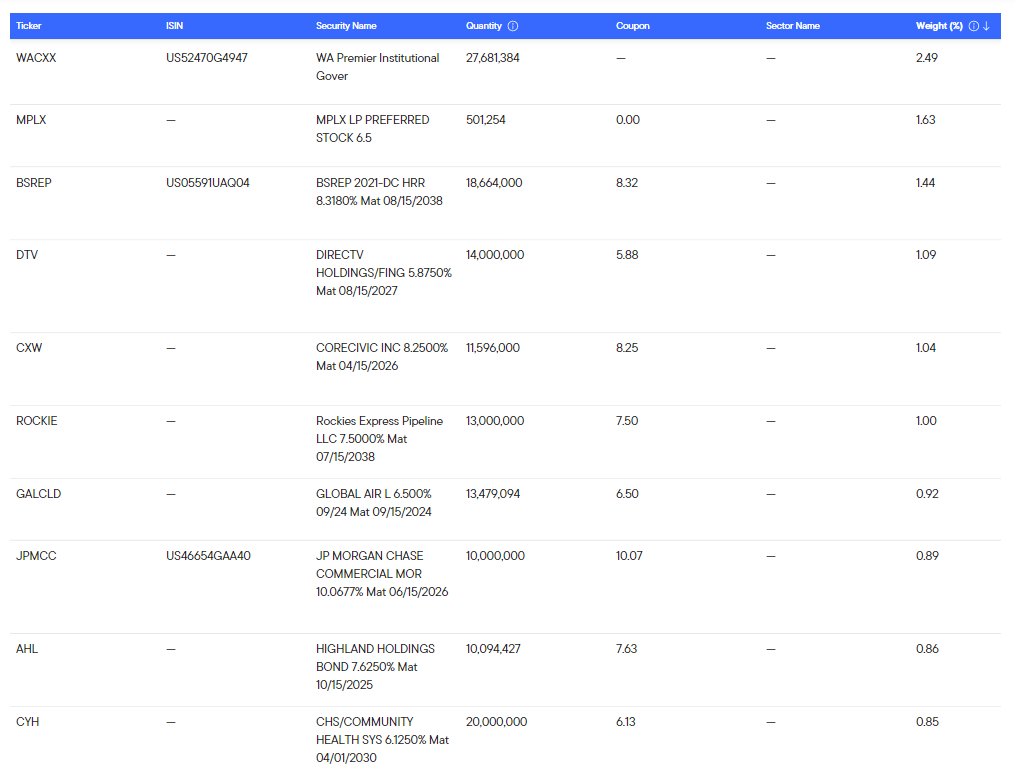
In fact, the only allocation over 2% here is WACXX. That’s a money-market fund from Western Asset themselves.
According to CEFConnect, WDI carried 319 positions at the end of August. For a multi-sector bond fund, a high number of holdings is par for the course. They are spread out amongst many holdings, so they aren’t carrying a significant risk of any individual, or a handful of individuals, can bring the portfolio down.
Conclusion
WDI is attractively discounted and fully covers its high distribution yield. That makes it an interesting name at this time. The main risk is, of course, the continuation of aggressive rate hikes. Depending on how high rates go dictates how much further WDI will fall. The rising distribution hasn’t been enough to offset the underlying portfolio’s decline.
Yet, if rates stabilize, WDI could be set to rise back to parity with its NAV per share. That would provide some upside, even if the portfolio doesn’t appreciate from this level. As a term fund, the NAV will be realized one day. However, we have until 2033 to start worrying about that angle of the play.
Be the first to comment