

CHUYN/iStock via Getty Images
The bear continues to grumble – and it has a firm grip not only on the formerly high-flying tech stocks, but also on other highly-valued companies. One such example is WD-40 Company (NASDAQ:WDFC), which was hit relatively hard, after peaking at over $300 in early 2021. Since then, the stock has lost more than 40% of its share price and is currently trading at 2018-2019 levels.
I have always found WDFC to be a very attractive company for several reasons. For one, it’s a very easy business to understand. WDFC focuses on what it does best: Manufacturing and marketing its namesake multipurpose spray, WD-40, which is found in most households in the Western world. Think of WD-40 as the Coca-Cola of industrial branded products. Generic multipurpose sprays can be had for as little as one dollar, while WD-40 commands a significant price premium. WD-40 does not require expensive ingredients or costly manufacturing processes, and therefore the company generates very high profit margins. Finally, WDFC’s products are available at hardware stores, auto parts stores, and often even supermarkets. Therefore, investors can easily judge the quality of the products for themselves, just as Peter Lynch recommends in his books.
In this article, I will discuss the company’s performance over the last decade, taking into account the most recent quarterly earnings release, and elaborate whether this profitability powerhouse is indeed a worthwhile investment. I also will assess whether the shares are a good deal at the current price of $180 or if they still command a premium, just like the company’s main product.
Company Overview
In addition to its namesake product, which also is offered for a number of specific applications (e.g., WD-40 Specialist and WD-40 BIKE), the company also develops and sells other maintenance products, as well as household care and cleaning products, such as 3-IN-ONE, GT85, X-14, 2000 Flushes, Carpet Fresh, no vac, Spot Shot, 1001, Lava and Solvol.
The company sells its products in the Americas, Asia, Australia, Europe, the Middle East, and Africa, with the Americas and EMEA segments contributing almost 90% of sales (Figure 1). WDFC’s Asia segment is the most profitable, with a three-year average operating margin of 29%. However, the segment’s sales were hit the hardest in 2020 due to the government-mandated measures to contain the spread of SARS-CoV 2 and in fiscal 2021, operating profit still lagged the 2019 result. The profitability of the Americas segment has decreased by two percentage points since 2019 and currently stands at 24%, while the EMEA segment has increased its profitability by two percentage points to 25%.
The main driver of the company’s input costs is the price of oil, but also the price of aerosol cans, transportation and labor. However, given the high gross margin, it’s understandable that the company’s operating leverage is relatively low and that WDFC continues to generate good operating income even with crude oil prices above $100. For example, the company expects its gross margin for the current fiscal year (which ends in August) to be in the range of 50% to 51%, only slightly below its long-term average of 53%. Other companies, such as Clorox (CLX) (see my recent article), are having more difficulty keeping input costs under control. For example, in February 2022, the company reported that its gross margin decreased 1,240 basis points to 33% from 45% a year ago.
Figure 1: WDFC’s fiscal 2021 segment sales (own work, based on the company’s FY 2021 10-K)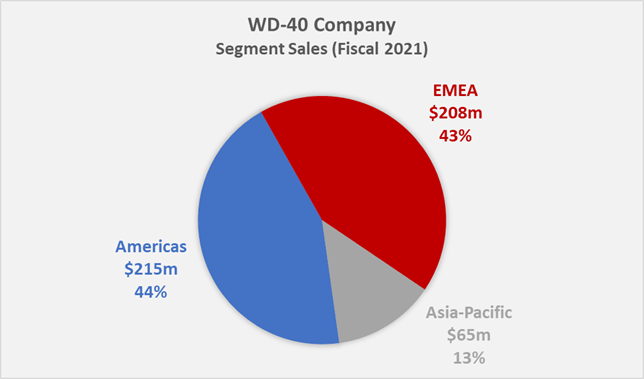
While WDFC has comparatively low input costs that result in a very solid gross margin, it’s highly dependent on advertising and promotion investments to maintain its brands. Over the past decade, advertising spending has declined slightly, from about 7% of net sales in 2010 to about 5.5% since 2016. In absolute terms, advertising spend continues to increase but lags behind sales, which can be interpreted as a sign of increasing effectiveness. For example, the company spent $22 billion on advertising in fiscal 2010, while it’s expected to spend about $29 million in fiscal 2022.
Growth and Profitability
WDFC continues to experience increasing sales and profits. The twelve-year compound annual revenue growth rate – CAGR – is 4.3%, and revenue growth has accelerated in recent years primarily due to increased time spent at home during the pandemic (three-year CAGR of 8.1%). Going forward, WDFC’s sales growth is expected to return to closer to the long-term average. Operating income grew in line with revenue, with a twelve-year CAGR of 4.4%.
Figure 2: WDFC’s historical annual net sales (own work, based on the company’s fiscal 2010 to 2021 10-Ks, the Q2 10-Q and the associated earnings release)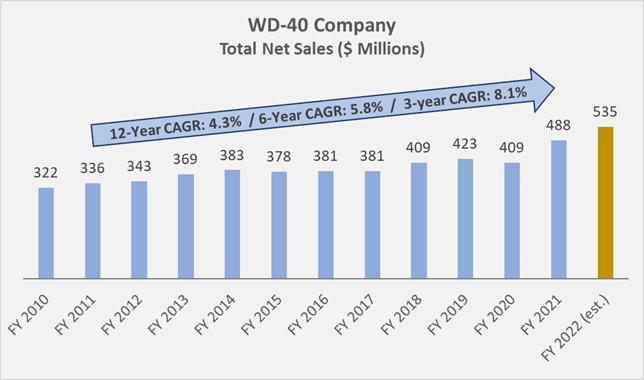
Free cash flow normalized for working capital movements and after accounting for stock-based compensation expenses (normalized free cashflow, nFCF, Figure 3) grew at a long-term CAGR of 3.4%. Note that I typically include impairment charges and other recurring “one-offs” when calculating nFCF, but these were not observed at WDFC, apart from a minor charge in fiscal 2013.
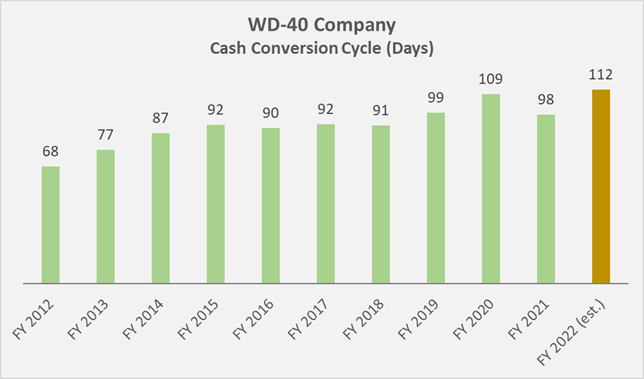
Since 2016, however, nFCF has been stagnating, most likely due to the company’s weakening working capital management, which is reflected in the rising cash conversion cycle (Figure 4). It appears that the company is increasingly focusing on products with more complex production (which appears unlikely after reviewing the company’s product portfolio) and/or has difficulties maintaining efficient logistics and order fulfillment. Also, the company’s days sales outstanding has been increasing, suggesting that WDFC is taking longer to collect its receivables from its customers (e.g., warehouse club stores, home improvement stores, auto parts dealers, and industrial distributors).
Figure 3: WDFC’s historical normalized free cashflow, taking movements in working capital and stock-based compensation expenses into account (own work, based on the company’s fiscal 2010 to 2021 10-Ks, the Q2 10-Q and the associated earnings release) Figure 4: WDFC’s historical cash conversion cycle (own work, based on the company’s FY 2010 to FY 2021 10-Ks, the Q2 10-Q and the associated earnings release)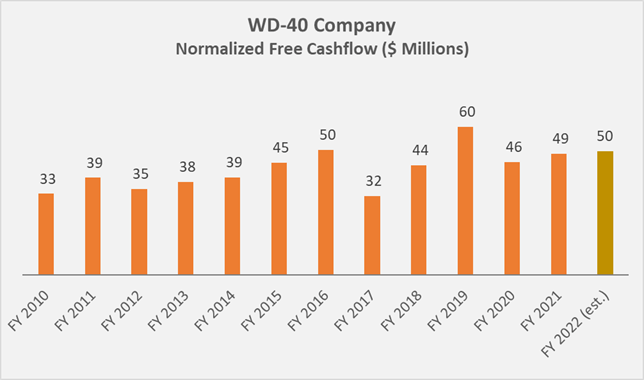
Although WDFC seems to have difficulties in managing working capital, it’s a very profitable company, as mentioned earlier. Its gross margin has been around 53% over the past decade and remains relatively stable. The company has been able to increase its operating margin from around 15% in 2012 to almost 20% in recent years, mainly due to lower advertising expenses. However, increased transportation and input costs did not leave WDCF unscathed. In fiscal 2021, the company reported an operating margin of 18.2%, down 80 basis points from the previous year and 127 basis points lower than the two-year comparison.
While advertising expenditure has tended to fall over the last 10 years, selling, general and administrative (SG&A) expenses have risen – not only in absolute terms but, more worryingly, as a proportion of sales (Figure 5). This is another indication that WDFC is currently facing some operational challenges. However, the company has ample room to maneuver until rising SG&A expenses threaten profitability, but they should still be monitored carefully.
Figure 5: WDFC’s historical SG&A expenses in terms of net sales (own work, based on the company’s fiscal 2010 to 2021 10-Ks, the Q2 10-Q and the associated earnings release)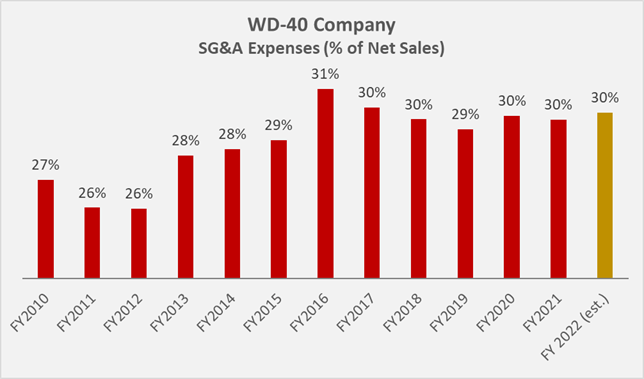
Even though WDFC seems to have some operational problems, it still generates high returns for its shareholders. Both the return on invested capital – ROIC – and the cash return on invested capital (CROIC) are well above the weighted average cost of capital – WACC. Only rarely is a manufacturing company able to achieve such high returns.
Figure 6: WDFC’s historical (cash) return on invested capital, compared to its weighted average cost of capital (own work, based on the company’s fiscal 2010 to 2021 10-Ks)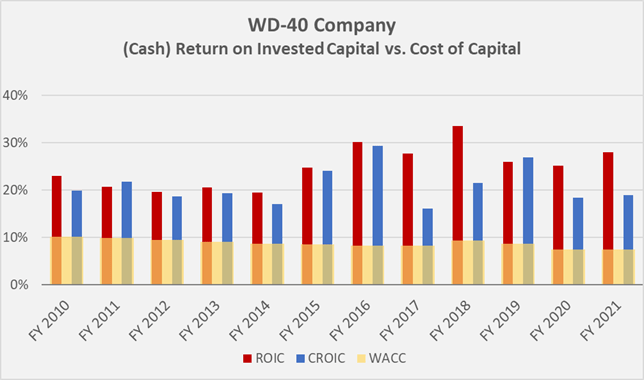
Balance Sheet Quality
WDFC typically carries very little debt, so interest coverage has historically been very conservative. Since 2010, the company has recorded its highest leverage ratio in fiscal 2020 with net debt of 0.68 times EBITDA or 1.3 times nFCF. The interest coverage ratio is currently around 20 times nFCF.
The company maintains a balance of outstanding draws in U.S. Dollars, Euros and Pound Sterling and issued $17.2 million in fixed-rate long-term debt in 2017. In 2020, WDFC made changes to its debt structure and took on $52 million in fixed-rate long-term debt to pay down part of its existing $150 million credit arrangement with Bank of America. That way, the company has become less dependent on the prevalent interest rate environment. Overall, WDFC’s weighted-average interest rate on its long-term debt is 2.79% and this – in my opinion very favorable rate – is unlikely to change in the near term. The remainder of the revolving credit facility, which represents the main component of WDFC’s interest rate risk, currently matures in 2025 and the long-term debt assumed in 2020 matures in two equal installments in 2027 and 2030. The notes issued in 2017 mature in equal, semi-annual installments over the next 10 years, with a major final repayment in 2032. (Figure 7).
Figure 7: WDFC’s upcoming debt maturities (own work, based on the company’s fiscal 2021 10-K)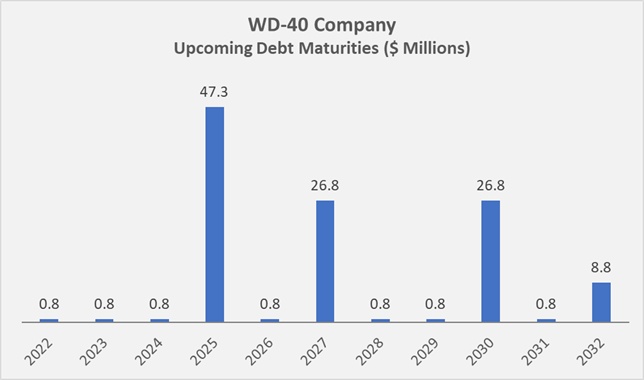
Shareholder Returns
According to my own research, WDFC paid its first dividend in 1988. The dividend’s growth track record has been somewhat spotty until the Great Recession, but since 2010, the dividend has been raised by 10% per year on average, therefore theoretically qualifying the stock as a dividend growth stock (Figure 8). At a current yield of 1.7%, the shares trade in line with the long-term average dividend yield. If the company maintains its current dividend growth rate, the yield on cost would reach 4.4% after 10 years. A continuation of this trend does not appear unreasonable from the perspective of WDFC’s strong profitability, but the already relatively high payout ratio of 80% of nFCF should also be considered. A possible global recession is also likely to have an impact on WDFC’s sales. In this context, it should not be forgotten that the company maintained a constant dividend between 2007 and 2009, thereby conserving capital. As a smaller company with an obviously prudent management team (as underlined by the conservative balance sheet), it seems very likely that the company’s investors will experience another period of stagnant dividend payouts as we potentially head toward another global recession.
Figure 8: WDFC’s annualized dividend payouts (own work, based on the company’s 10-Ks filed with the SEC and information found on WDFC’s website and other resources)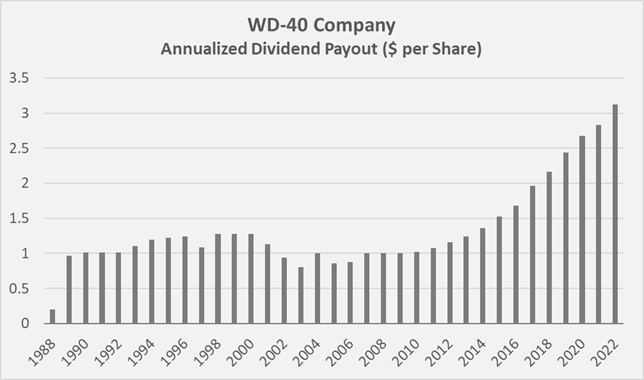
Besides the payment of a quarterly dividend, the company also routinely returns cash to shareholders by buying back shares. WDFC’s latest repurchase authorization became effective in November 2021, enabling the company to repurchase up to $75 million of its outstanding shares, which translates to 3% of the current market capitalization. Since 2010, the company reduced the number of shares outstanding by 3 million, boosting earnings per share by approximately 22%. During this period, WDFC spent $620 million on share buybacks and dividends, while it generated only $510 million in nFCF. Normally, I don’t like to see companies take on debt to fund buybacks, but in the case of WDCF, it doesn’t bother me because the company hasn’t been overly aggressive and its leverage is still very conservative.
Valuation and Verdict
Compared to average five-year valuations, the shares appear somewhat undervalued. Overall, however, the shares are still overvalued, even $150 below the all-time high:
Figure 9: Valuation metrics obtained for WDFC on June 17, 2022 (taken from WDFC’s stock quote page on Seeking Alpha)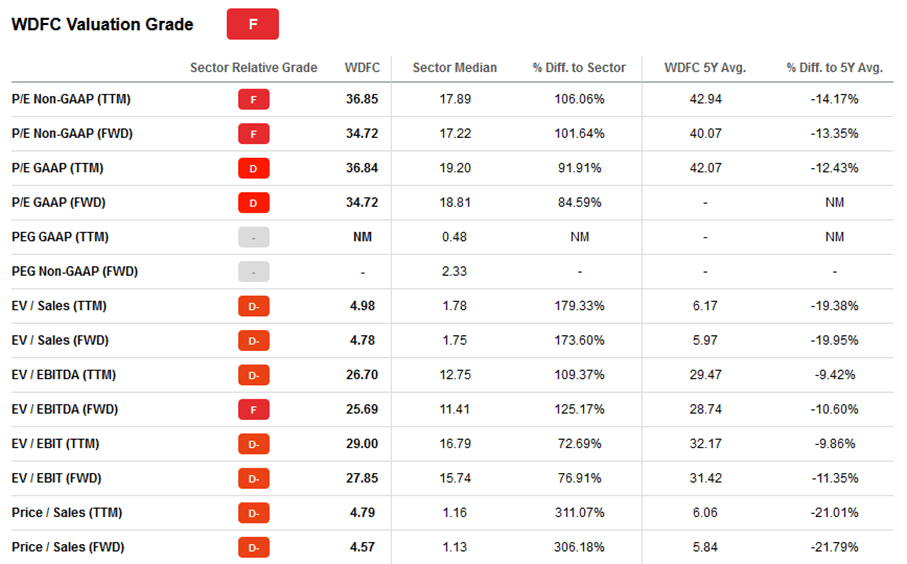
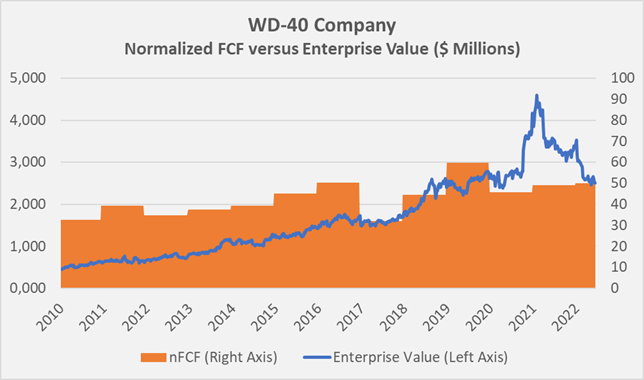
Overlays of WDFC’s nFCF per share and share price (Figure 10) and its nFCF and enterprise value (Figure 11) suggest that the stock is finally trading close to its long-term average valuation. Coming out of the Great Recession, the shares traded at a significant discount until 2016 when valuations began to decouple from fundamentals. The early 2021 high was clearly a case of irrational exuberance. Keep in mind, however, that the stock is very likely to lose significantly more value if we are indeed headed for another global recession. The stagnating nFCF since 2016 should be factored into the equation as well.
Figure 10: Overlay of WDFC’s share price and normalized free cashflow per share (own work, based on the company’s fiscal 2010 to 2021 10-Ks, the Q2 2022 10-Q, and the weekly closing share price of WDFC) Figure 11: Overlay of WDFC’s enterprise value and normalized free cashflow (own work, based on the company’s fiscal 2010 to 2021 10-Ks, the Q2 2022 10-Q, and the weekly closing share price of WDFC)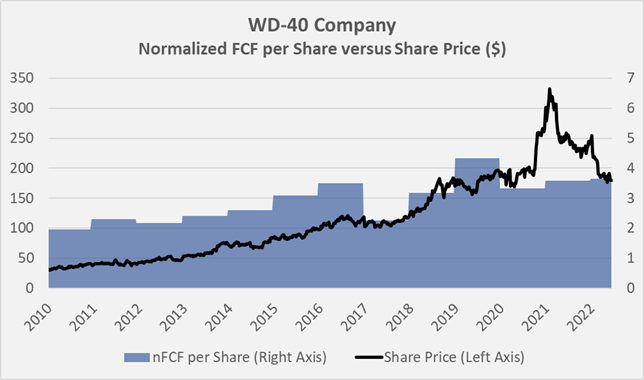
Given the high profitability and the high return on invested capital, a premium valuation is certainly justified, but in view of the relatively slow growth, a P/E ratio of 35 is difficult to understand, especially against the backdrop of a looming recession. Moreover, the company will have to pass on increased input costs to its customers and thus has less room for price increases for the purpose of profit growth. In addition to oil prices, higher aluminum prices (aerosol cans), a difficult labor market, and a still-difficult supply chain are also weighing on the company’s profit growth, at least in the near term. Also, the elasticity of WDFC’s main product is likely to be higher than margins initially suggest, especially in times of persistently high inflation. Consumers will likely trade down to discount brands with less discretionary income in their pockets. The company’s worsening cash conversion cycle and rising SG&A costs also something I do not like to see in such a highly valued company.
While I admire the business for its simplicity, high profit margins, and strong profitability, I do not consider the stock a worthwhile investment even after the 40%-plus decline in the share price. The risk of a further decline is simply too high, and the low current dividend yield, coupled with the relatively high payout ratio and stagnant free cash flow growth, causes me as an income-oriented investor to look elsewhere.
Thank you very much for taking the time to read my article. In case of any questions or comments, I’m very happy to read from you in the comments section below.
Be the first to comment