

Watts Water Technologies Stock Decline Has Improved the Risk/Reward For Investors pavlinec/iStock via Getty Images
Watts Water Technologies (NYSE:WTS) designs and manufactures a variety of products and solutions related to the flow of water throughout both residential and commercial buildings.
Geographically, Watts is focused primarily on the Americas and Europe. Additionally, just over 1/3 of sales are related to new construction projects with 2/3 coming from repair and upgrades.
WTS Revenue Breakdown (WTS Investor Presentation November 2022)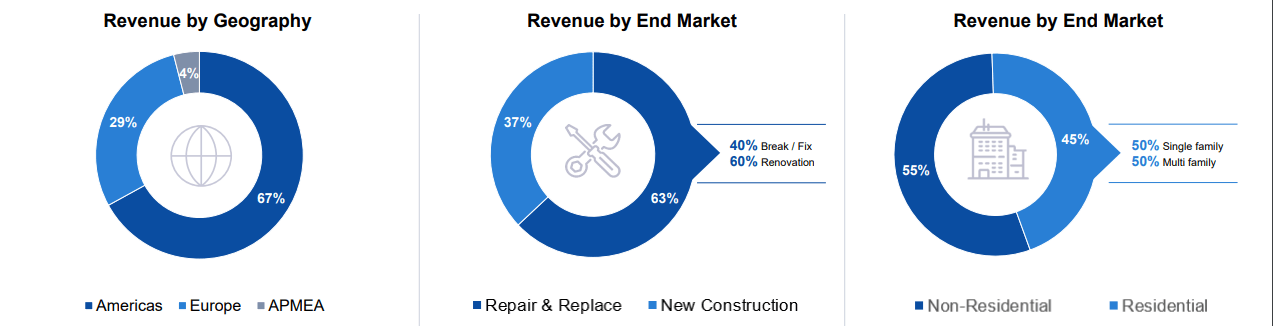
Watts provides water related solutions for just about any need of modern society. The fact is everyone needs water and avoiding waste and leakage is a critical task in a world that constantly needs clean and safe water. Their primary focus is on safety, energy efficiency and water conservation.
Watts has historically used M&A to continue to build out their offerings for customers as well as to expand into new geographic or end markets.
WTS Brands (WTS Investor Presentation November 2022)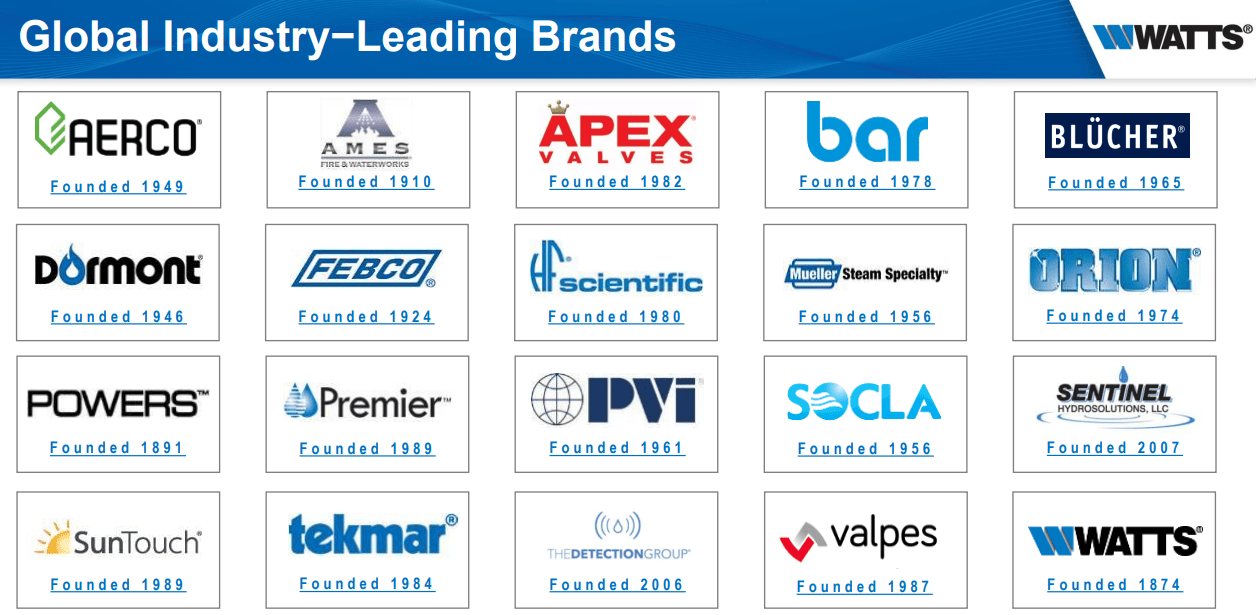
Watts has spent much of the prior decade on debt reduction and operational efficiency. One such improvement was the One Flow residential products assembly that improved lead times from 28 days in 2019 to just 5 days in 2021. Keep in mind that the majority of that gain came at a time when the global supply chain was under immense strain due to the pandemic.
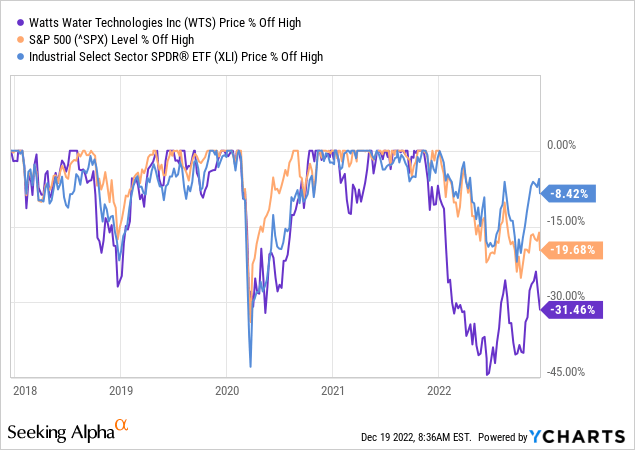
Watts’ share price still sits >30% off its high from late 2021 while the Industrial Sector ETF (XLI) is only 8% off its high and the S&P 500 is nearly 20%. As we’ll see later, I think Watts was arguably quite overvalued at this time last year and the decline in share price was much needed to re-align closer to the true value of the business.
Dividend History
In my opinion one of the quickest ways to identify potential high quality businesses is to examine their dividend growth track record. Companies that have a long history of both paying and growing their dividends are likely to have some kind of moat around their business that allows them to continue to improve year after year while sending out more cash to their owners.
WTS Dividend History (WTS Investor Relations)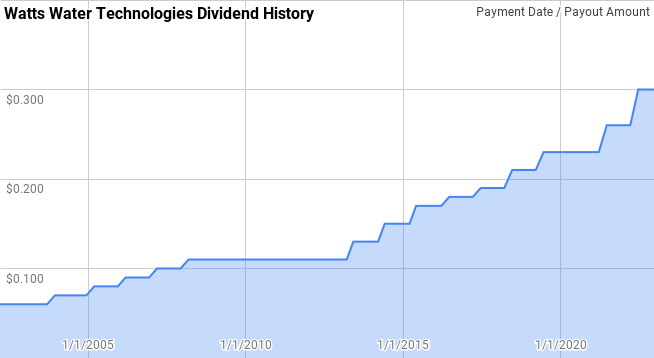
Watts’ dividend growth streak is only 10 years old which gives them the title of Dividend Contender. Although they’ve paid the same or higher dividend since at least 2002 and subsequently froze their dividend growth in 2009. However, starting in 2013 their current streak began.
Dating back to 2002 Watts’ year over year dividend growth has spanned from 0.0% to 16.0% with an average of 8.3% and a median of 9.8%.
Over that same period there’s been 16 rolling 5-year periods with annualized dividend growth coming between 1.9% to 12.0% with an average of 7.9% and a median of 8.8%.
Additionally, there’s been 11 rolling 10-year periods with Watts’ annualized dividend growth ranging from 6.2% to 10.2% with an average of 7.5% and median of 7.4%.
The rolling 1-, 3-, 5-, and 10-year annualized dividend growth rates from Watts since 2002 can be found in the following table.
| Year | Annual Dividend | 1 Year | 3 Year | 5 Year | 10 Year |
| 2002 | $0.24 | ||||
| 2003 | $0.25 | 4.2% | |||
| 2004 | $0.28 | 12.0% | |||
| 2005 | $0.32 | 14.3% | 10.1% | ||
| 2006 | $0.36 | 12.5% | 12.9% | ||
| 2007 | $0.40 | 11.1% | 12.6% | 10.8% | |
| 2008 | $0.44 | 10.0% | 11.2% | 12.0% | |
| 2009 | $0.44 | 0.0% | 6.9% | 9.5% | |
| 2010 | $0.44 | 0.0% | 3.2% | 6.6% | |
| 2011 | $0.44 | 0.0% | 0.0% | 4.1% | |
| 2012 | $0.44 | 0.0% | 0.0% | 1.9% | 6.2% |
| 2013 | $0.50 | 13.6% | 4.4% | 2.6% | 7.2% |
| 2014 | $0.58 | 16.0% | 9.6% | 5.7% | 7.6% |
| 2015 | $0.66 | 13.8% | 14.5% | 8.4% | 7.5% |
| 2016 | $0.71 | 7.6% | 12.4% | 10.0% | 7.0% |
| 2017 | $0.75 | 5.6% | 8.9% | 11.3% | 6.5% |
| 2018 | $0.82 | 9.3% | 7.5% | 10.4% | 6.4% |
| 2019 | $0.90 | 9.8% | 8.2% | 9.2% | 7.4% |
| 2020 | $0.92 | 2.2% | 7.0% | 6.9% | 7.7% |
| 2021 | $1.01 | 9.8% | 7.2% | 7.3% | 8.7% |
| 2022 | $1.16 | 14.9% | 8.8% | 9.1% | 10.2% |
Source: Author; Data Source: Watts’ Investor Relations
The dividend payout ratio compares the dividend payment versus either net income or free cash flow. The payout ratio tells you whether a company has been growing their dividend slowed, in-line, or faster than the underlying business as evidenced by a falling, flat, or increasing payout ratio.
WTS Dividend Payout Ratios (WTS SEC filings)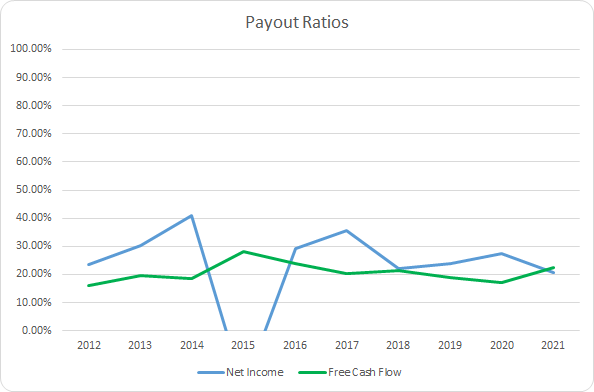
Outside of FY 2015, Watts’ payout ratio has been very steady and quite conservative. The 10-year average net income payout ratio, excluding FY 2015, is 28.1% with the 5-year average coming to 25.9%. Similarly, Watts’ average free cash flow payout ratios are 20.6% and 20.0%, respectively.
Quantitative Quality
My target companies are ones where I don’t have to constantly worry about the next quarter or next year’s results to generate solid returns. That means I want to focus on companies that have proven themselves over time and have a built in demand that keeps customers coming back for me. I try to get a sense of the quality by examining a variety of financial metrics and ratios.
WTS Revenue Profits and Cash Flow (WTS SEC filings)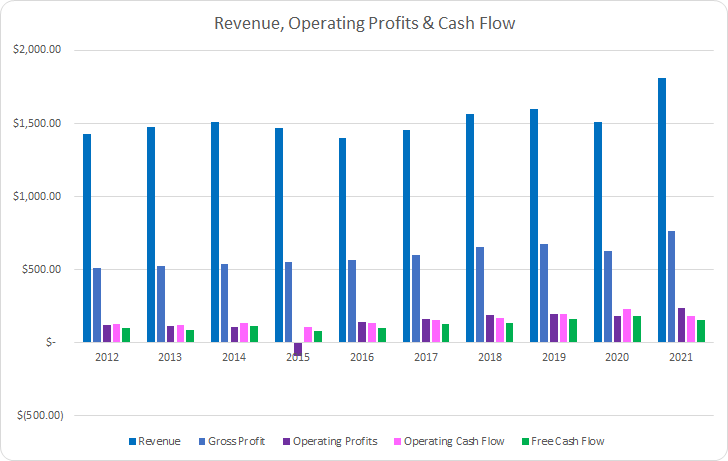
Watts’ revenue growth has been pretty anemic over the last decade increasing just 26.7% in total or 2.7% annualized. However, gross profits did improve by 49.4% or 4.6% annualized over that same time.
Meanwhile, operating profits rose by 94.3% or 7.7% annualized with operating cash flow improving by 38.8% or 3.7% annualized. Free cash flow also well outpaced revenue growth increasing by 54.4% in total or 4.9% annualized.
I want to businesses that are able to at a minimum defend their margins over time from competitors and preferably improve them as they are to press their advantages. Additionally, I prefer to see free cash flow margins greater than 10%; however, the trajectory of margins over time plays an equally important role.
WTS Margins (WTS SEC filings)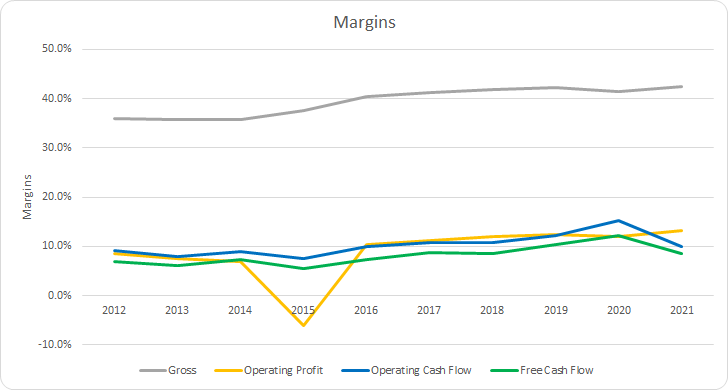
Watts’ margins have generally been improving over time. The 10-year average gross margin is 39.5% with the 5-year average coming to 41.9%. Additionally, Watts’ operating margin showed strong improvement with averages of 8.8% and 12.1%, respectively. We see similar results in Watts’ free cash flow margin with 10- and 5-year averages of 8.2% and 9.7%.
An alternative measure of profitability can be taken by examining the profits versus some measure of asset or capital base. My preferred metric is the free cash flow return on invested capital, FCF ROIC, which I want to see greater than 10% and/or improving over time.
WTS Free Cash Flow Returns (WTS SEC filings)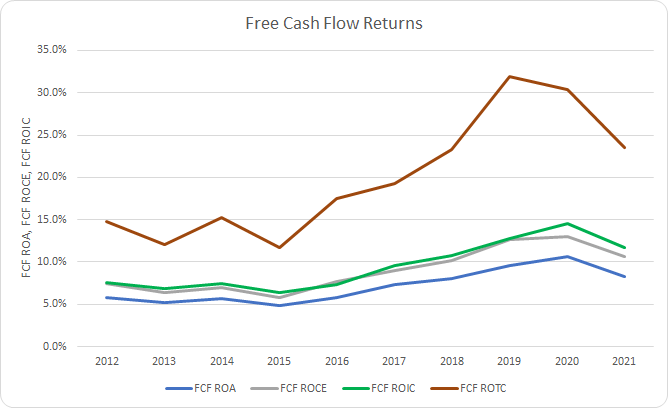
Watts hasn’t consistently surpassed that 10% threshold that I like to see for FCF ROC; however, they’ve been able to make solid headway on that front over the last decade. The 10-year average FCF ROIC is 9.5% with the 5-year average coming to 11.9%.
To understand how Watts uses its free cash flow, I calculate three variations of the metric, defined below:
- Free Cash Flow, FCF: Operating cash flow less capital expenditures
- Free Cash Flow after Dividend, FCFaD: FCF less total cash dividend payments
- Free Cash Flow after Dividend and Buybacks, FCFaDB: FCFaD less net cash used on share repurchases
WTS Free Cash Flows (WTS SEC filings)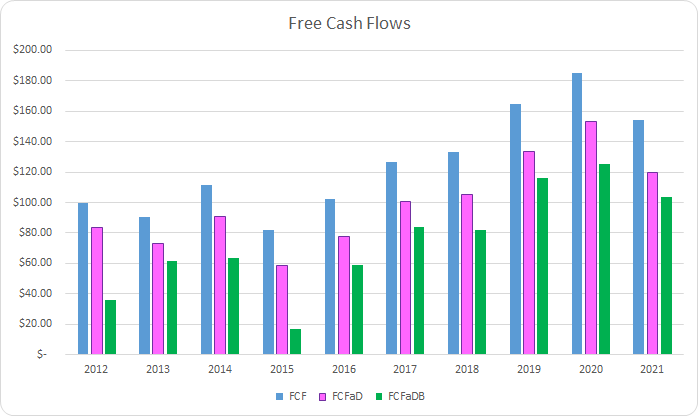
From FY 2012 through FY 2021 Watts generated $1.25 B in FCF and paid out a total of $0.25 B to shareholders via dividends. That brings the cumulative FCFaD for that period to $1.00 B. Additionally, Watts has spent a net total of $0.25 B on buybacks which puts the cumulative FCFaDB for the prior decade at $0.75 B.
Watts’ management has roughly equal weighted cash used for dividends and buybacks. Over that time Watts has spent roughly $1.02 on dividends for every net $1.00 spent on buybacks.
WTS Shares Outstanding (WTS SEC filings)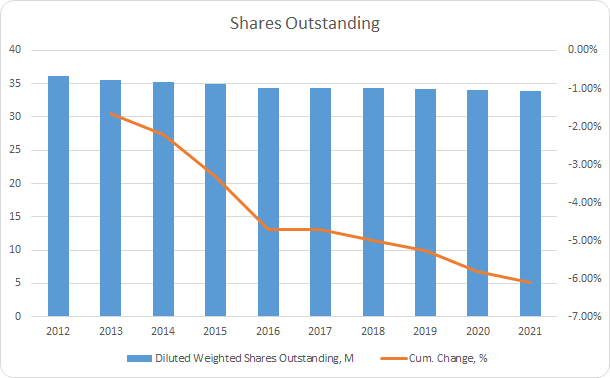
Watts has regularly spent money on repurchases; however, it seems to largely have gone to just cancelling out stock based compensation. The share count is only down 6.1% from the end of FY 2012 through FY 2021 which is ~0.7% annualized.
When making an investment for the long-term it’s important to make sure that debt levels don’t appear too aggressive. One measure that I track is the debt-to-capitalization ratio.
WTS Debt to Capitalization (WTS SEC filings)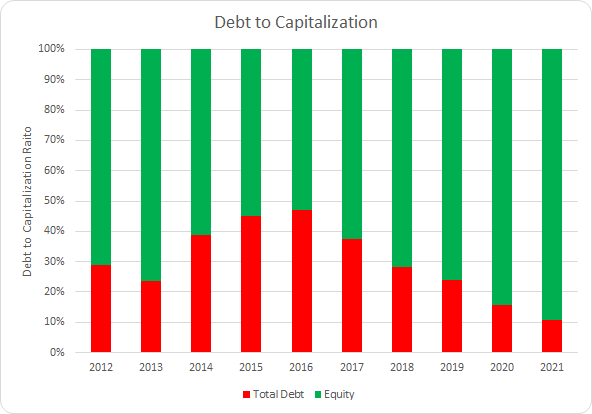
Watts has done a solid job de-levering since 2016 although their debt levels weren’t exactly exorbitant prior. The 10-year average debt-to-capitalization ratio for Watts is 30% with the 5-year average sitting at 23%.
While the capital structure is important, I place more emphasis on the net debt ratios. The net debt ratios compares the net debt levels versus some measure of profits or cash flow and let you know how quickly the company could de-lever if need be, assuming no material changes to the underlying business.
WTS Debt Ratios (WTS SEC filings)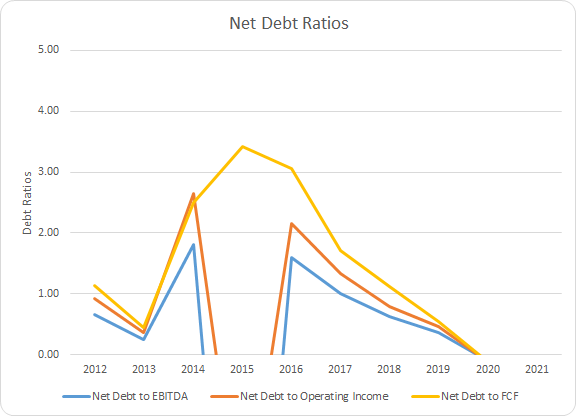
Watts has routinely been conservatively leveraged compared to its profits and cash flow save for FY 2015 which saw a large non-cash restructuring charge. The 10-year average net debt-to-EBITDA, net debt-to-operating income, and net debt-to-FCF, excluding FY 2015, are 0.7x, 0.9x, and 1.3x, respectively. For the most recent 5-years those averages come to 0.1x, 0.2x, and 0.2x. FY 2020 and FY 2021 also saw Watts move to a net cash rather than net debt position.
How Did We Get Here?
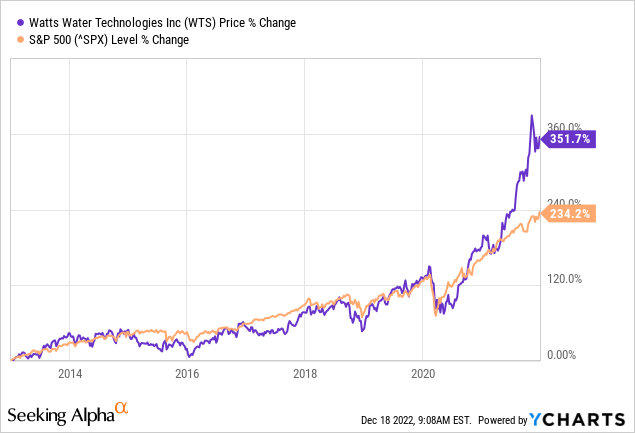
Between December 31, 2012 and December 31, 2021, Watts’ share price increased from $42.99 up to $194.17. That works out to a 351.7% increase or ~16.3% annualized gain over that time. Add in the ~1.0% dividend yield at the beginning and Watts provided owners a 17.3% CAGR during that period.
Compared the S&P 500’s 234.2% total increase, 14.3% annualized change, that’s an impressive result from a very unglamorous business.
Over the long run the stock price should roughly approximate the intrinsic value of a business; however, over the short term that connection can deviate significantly. I’ve dissected the returns over that period into components that should approximate the source of returns.
- Business Returns: measured as the annualized revenue growth rate plus the annualized rate of change of net profit margin
- Capital Allocation Returns: measured as dividend yield plus annualized change in shares outstanding
- Sentiment Change: measured as the annualized rate of change between starting and ending P/E multiple
Watts’ sales growth was just a +2.6% contribution to the returns realized over that period. However, they were able to improve their net profit margin from 4.8% to 9.2% which acted as a +7.3% contribution to returns. Altogether the business returns were a +9.9% attribution to CAGR.
Watts’ share count fell by just 6.1% in total over that time and in turn provided a +0.7% boost to returns. Added to the initial dividend yield of 1.0% and the capital allocation return attribution comes to +1.7%.
Additionally, Watts’ returns were amplified by an increase in the multiple investors were willing to pay for Watts’ earnings. The P/E multiple at the beginning of the period was 22.7x and by the end it had risen to 39.7x. That’s a total increase of 75.1% and provided a +5.7% contribution the CAGR.
| Annualized Returns | % of Returns | |
| Business Returns | 9.9% | 57% |
| Capital Allocation Returns | 1.7% | 10% |
| Sentiment Change | 5.7% | 33% |
| Total Annualized Returns | 17.3% |
Source: Author
The underlying business justified 9.9% of the returns seen over that period or ~57% of the returns. Capital allocation added another 1.7% or 10% of the CAGR. However, sentiment change provided around 5.7% or 1/3 of the returns.
WTS Return Breakdown (Author)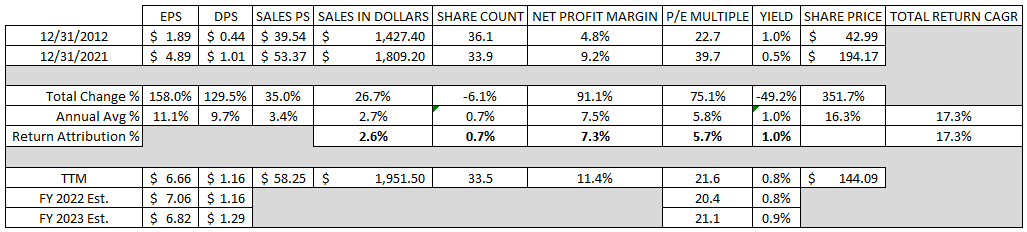
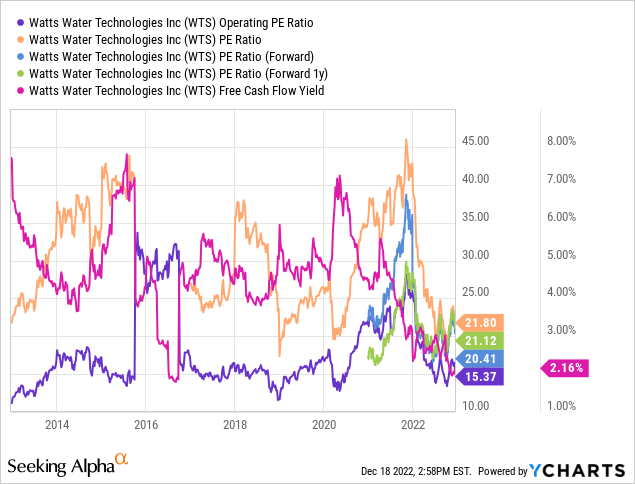
Due to the pullback in the markets thus far in 2022, Watts appears much more attractively valued at least on a multiple basis. For the TTM period the multiple is down to 21.6x. Based on FY 2022 estimates it’s at 20.4x and for FY 2023 estimates it’s 21.1x.
While the dividend yield doesn’t offer much cushion it is back up around the 1% level compared to the 0.5% mark at the end of 2021.
As far as the business goes the question is whether you believe revenue growth will improve compared to the previous decade and if margins can be sustained at decade high levels.
Valuation
Identifying a potential purchase target is one thing, as investors it’s also important to heed valuation. I employ three valuation methods in my goal to home in on a fair value range.
Dividend yield theory is a simple valuation methodology that’s based on reversion to the mean. The concept is easy to grasp: purchase shares when the dividend yield is greater than the average over a given period of time such that you are able to reap the full future growth, however that plays out, and potentially capture the valuation difference to boost your returns.
Watts Water Technologies Dividend Yield Theory (Author)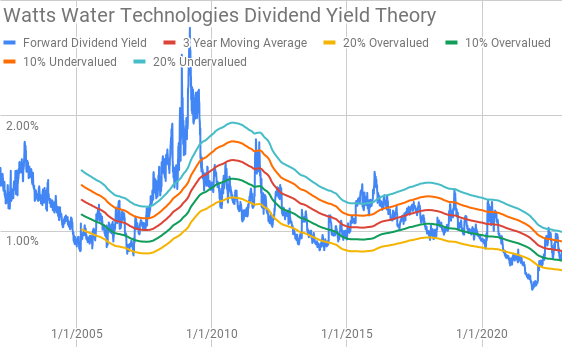
Over the last decade, Watts’ dividend yield has typically been heading lower. During shorter periods the valuation bands appear to offer attractive markers of under or over valuation. Watts shares currently offer a forward dividend yield of 0.83% compared to the 3-year average forward dividend yield of 0.83%.
A reverse discounted cash flow analysis can be used to decipher what kind of growth and margins a business must have in order to generate the cash flows that would support the current market valuation.
I use a simplified DCF model built on revenue growth, an initial free cash flow margin of 5.5% that improves to 11.0% during the forecast period, and a terminal growth rate of 2.5%.
For the discount rate I’ve used an estimated 3.2% after tax cost of debt along with a cost of equity of 10% and 8%. That yields a discount rate of 9.8% and 7.9%, respectively. Additionally, I’ve used the dividend capitalization method for the cost of equity which yields a cost of equity of 9.8% and a discount rate of 9.6%.
With the 10% cost of equity / 9.8% discount rate scenario Watts needs to grow revenues 11.7% annually through the forecast period in order to generate the free cash flows that justify the current market valuation. Under the 8% cost of equity / 7.9% discount rate scenario revenue growth needs to come in at 6.5% annually over the same period. With the 9.6% discount rate from the dividend capitalization method the required revenue growth comes to 11.3%.
The MARR analysis entails estimating the future growth of earnings and dividends for a company across a given period of time. You then apply a reasonable expected terminal multiple on those future earnings to determine a range of potential future share prices. If the expected return is greater than your threshold for investment then you can proceed with purchasing a stake in the business.
Analysts expect Watts to report FY 2022 EPS of $7.06 and FY 2023 EPS of $6.82. They also expect that Watts will be able to grow EPS at a 7.2% annualized rate over the next 5 years. I then assumed that Watts could manage 5.0% annual EPS growth for the following 5 years. Dividends are assumed to target a 20% payout ratio.
Over the last decade, Watts has traded at a premium valuation likely due to the stability of the business. During that time Watts has typically traded between ~20x and ~35x TTM EPS which I’ll use for the terminal multiples of the MARR analysis.
The following table shows the potential internal rates of return that an investment in Watts could generate provided the assumptions laid out above prove to be reasonably accurate forecasts of the future. Returns assume dividends are taken in cash and that Watts continues to pay and increase dividends along the timeline they have established. Returns also assume a purchase price of $144.09, Friday’s closing price.
| IRR | ||
| P/E Level | 5 Year | 10 Year |
| 30 | 14.7% | 9.9% |
| 25 | 10.7% | 8.0% |
| 22.5 | 8.4% | 7.0% |
| 20 | 6.0% | 5.8% |
| 17.5 | 3.3% | 4.5% |
| 15 | 0.3% |
3.0% |
Source: Author
Alternatively I use the MARR structure to determine the maximum price that I could pay for shares across the terminal multiple range in order to generate the returns that I desire from my investments. My base hurdle rate is a 10% IRR and for Watts I’ll also examine 8% and 12% IRR thresholds.
| Purchase Price Targets | ||||||
| 10% Return Target | 12% Return Target | 8% Return Target | ||||
| P/E Level | 5 Year | 10 Year | 5 Year | 10 Year | 5 Year | 10 Year |
| 30 | $180 | $146 | $166 | $123 | $197 | $174 |
| 25 | $151 | $124 | $139 | $104 | $165 | $147 |
| 22.5 | $137 | $112 | $126 | $95 | $149 | $133 |
| 20 | $122 | $101 | $112 | $86 | $133 | $120 |
| 17.5 | $108 | $90 | $99 | $76 | $117 | $107 |
| 15 | $93 | $79 | $86 | $67 | $102 | $93 |
Source: Author
Conclusion
Watts is an interesting business because they are at the intersection of critical needs for modern society. They largely focus on water related products including valves, backflow preventers, pressure reducing valves, water softeners, leak detection systems and much more. Additionally, they offer a variety of luxury products such as driveway snow melt and floor tile warming systems. Essentially, they offer a solution for just about any water related need for homes and businesses.
Growth has been hard to come by for Watts with sales up marginally over the last decade. However, they’ve been able to ramp up profitability by cutting costs and improving productivity. I’m intrigued by the various software solutions that they are continuing to build to help monitor and conserve water specifically in regards to leak detection, energy efficiency, water quality, and overall system safety. Watts expects that by 2023 their various smart and connected revenues will amount to around 25% of total sales.
Dividend yield theory suggests a fair value range for Watts between $131 and $161. At a current price near $144, Watts is right around fair value.
The reverse DCF analysis suggests that Watts is likely quite expensive at current levels. In order to generate 10% returns Watts needs to grow sales at an 11.7% annualized rate through the forecast period. Even with 8% returns the growth required growth rate still comes to 6.5%. Of course Watts could increase margins at a faster rate which would reduce the required revenue growth rate.
One thing to note is that the reverse DCF does not account for the potential increase of share buybacks. Based on the average of the last three fiscal years, and the TTM period, FCFaD Watts could repurchase around 2.5% of outstanding shares each year. A larger commitment towards share repurchases would decrease the required revenue growth.
With a relatively small FCF payout ratio Watts has plenty of untapped potential. While there’s room for either higher dividends or increased buybacks, I would much prefer to see Watts continue with their current strategy as long as the returns on additional invested capital continue to be sufficient.
WTS Capital Allocation (WTS Investor Presentation Nov 2022)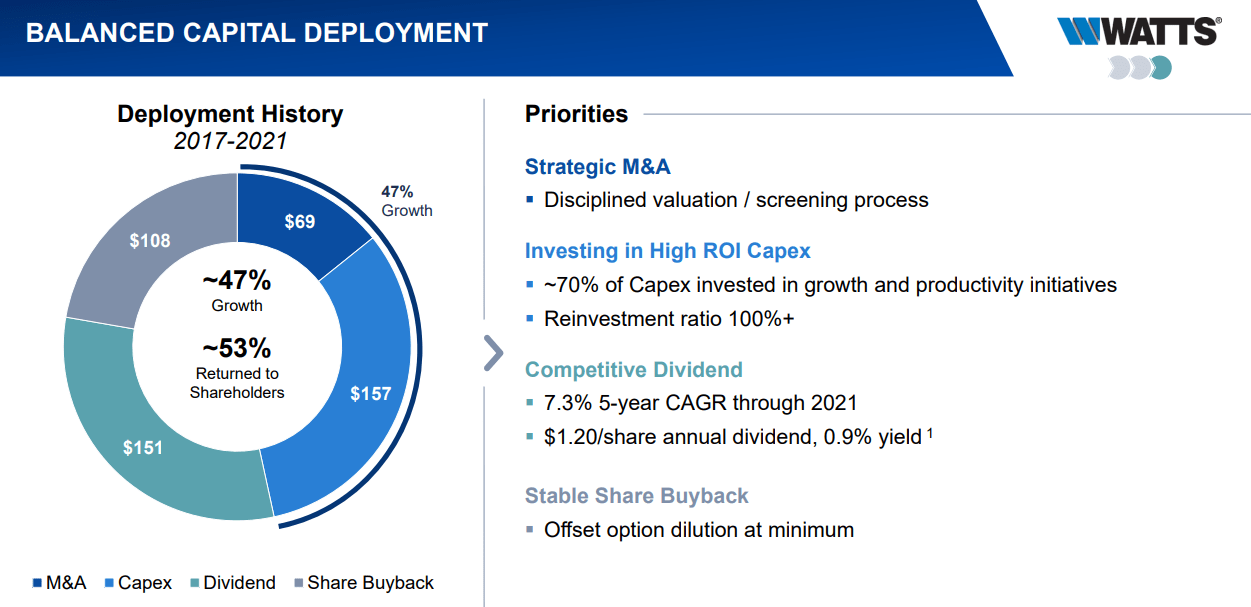
From 2017 through 2021 Watts’ management says that around 70% of their capex was for growth and productivity initiatives. With that large of a percentage of capex going towards growth that’s a much better use of cash flow provided the returns are sufficiently high which they appear to be given the general rise in FCF ROIC over time.
Additionally, Watts has spent the last decade de-levering the balance sheet reducing their total debt by nearly 2/3. They also reached a net cash position in FY 2020 and maintained that in FY 2021 and the TTM period.
Watts’ balance sheet is very strong and should provide plenty of flexibility to continue with M&A as long as opportunities present themselves. Their M&A strategy as laid out in the November Investor Presentation is very clear and straight-forward so investors have a clearly defined benchmark to compare future acquisitions to.
Watts M&A Strategy (WTS Investor Presentation November 2022)
Of the three valuation methods, there’s two that peg Watts around fair value and one that suggests it’s likely quite expensive at the moment. While the business is interesting to me and the valuation appears reasonable, I don’t believe that Watts is a business I would want to add to my portfolio at this time. Around 2/3 of Watts revenues are derived from either new construction or renovation which are likely to slow significantly should the much anticipated recession arrive in conjunction with an already slowing housing market.
Be the first to comment