

Amy Sussman/Getty Images Entertainment
A Quick Take On Warner Music Group
Warner Music Group Corp. (NASDAQ:WMG) went public in June 2020, raising $1.9 billion in gross proceeds from the sale of 77 million shares of its Class A common stock in an upsized IPO.
The firm operates as a music publisher and promoter of musical artists and recordings worldwide through a variety of record labels.
WMG has rallied recently, but is likely fairly valued where it is now, so I’m on Hold for the stock at around $35.00.
Warner Music Overview And Market
New York, NY-based WMG was founded to source and sign musical artists, facilitate the recording and distribution of music and provide music publishing services.
The firm also produces live events and promotes its roster of musical artists worldwide.
As of FQ4 2022, management was headed by Chief Executive Officer Mr. Stephen Cooper, who has been with the firm since 2011 and was previously CEO of Metro-Goldwyn-Mayer, Hawaiian Telcom and Krispy Kreme Donuts.
According to a 2022 market research report by Grand View Research, the global market for music streaming was an estimated $29.5 billion in 2021 and is forecast to reach $101 billion by 2030.
This represents a forecast CAGR of 14.7% from 2022 to 2030.
The main drivers for this expected growth are the rising use of streaming platforms delivering music to a broad selection of mobile devices.
Also, the chart below shows the U.S. streaming music historical and projected future market trajectory from 2020 through 2030:
U.S. Music Streaming Market (Grand View Research)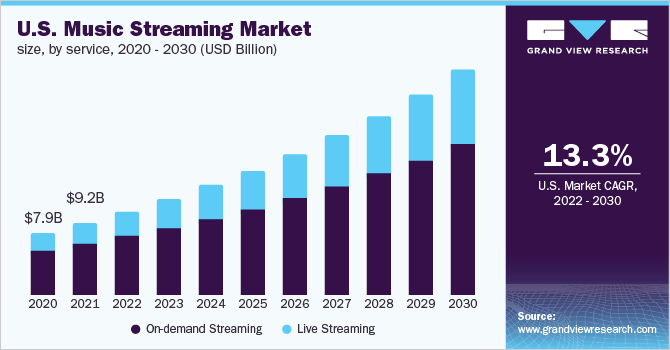
Major competitive vendors include:
-
Universal Music Group
-
Universal Music Publishing
-
Sony Music Entertainment
-
Sony/ATV
Warner Music’s Recent Financial Performance
-
Total revenue by quarter has risen according to the following chart:
9 Quarter Total Revenue (Financial Modeling Prep)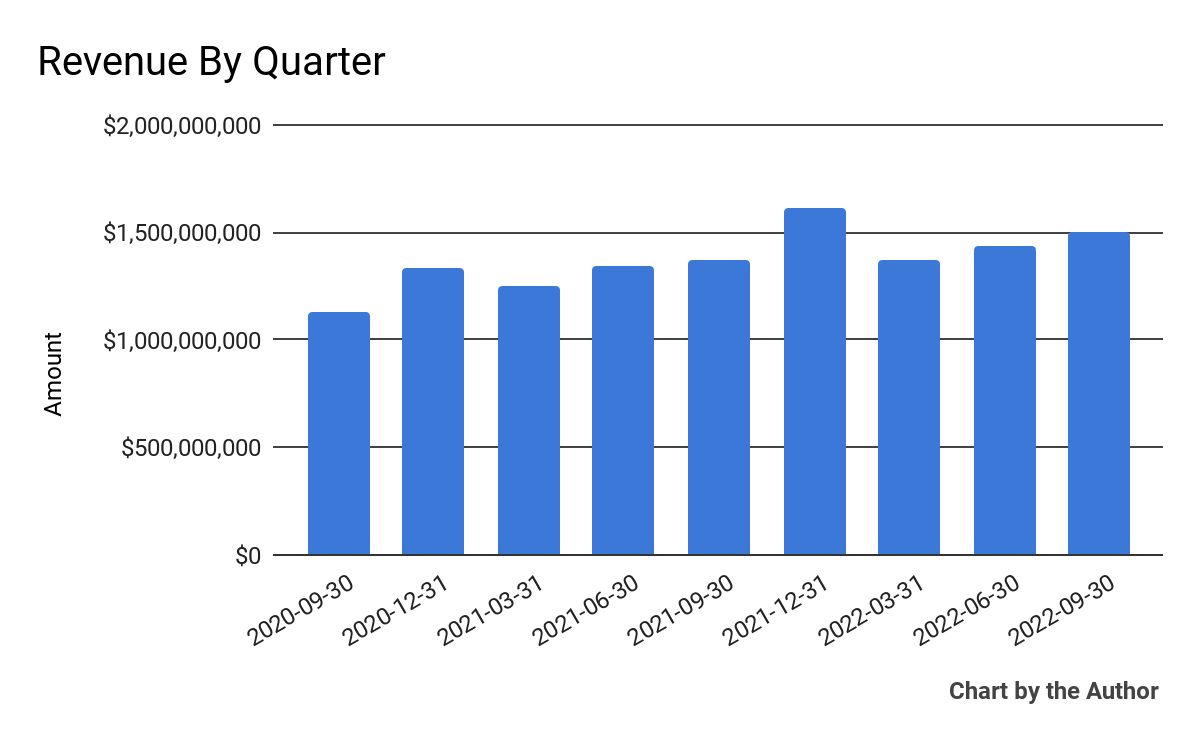
-
Gross profit margin by quarter has trended slightly higher in some periods, as the chart shows here:
9 Quarter Gross Profit Margin (Financial Modeling Prep)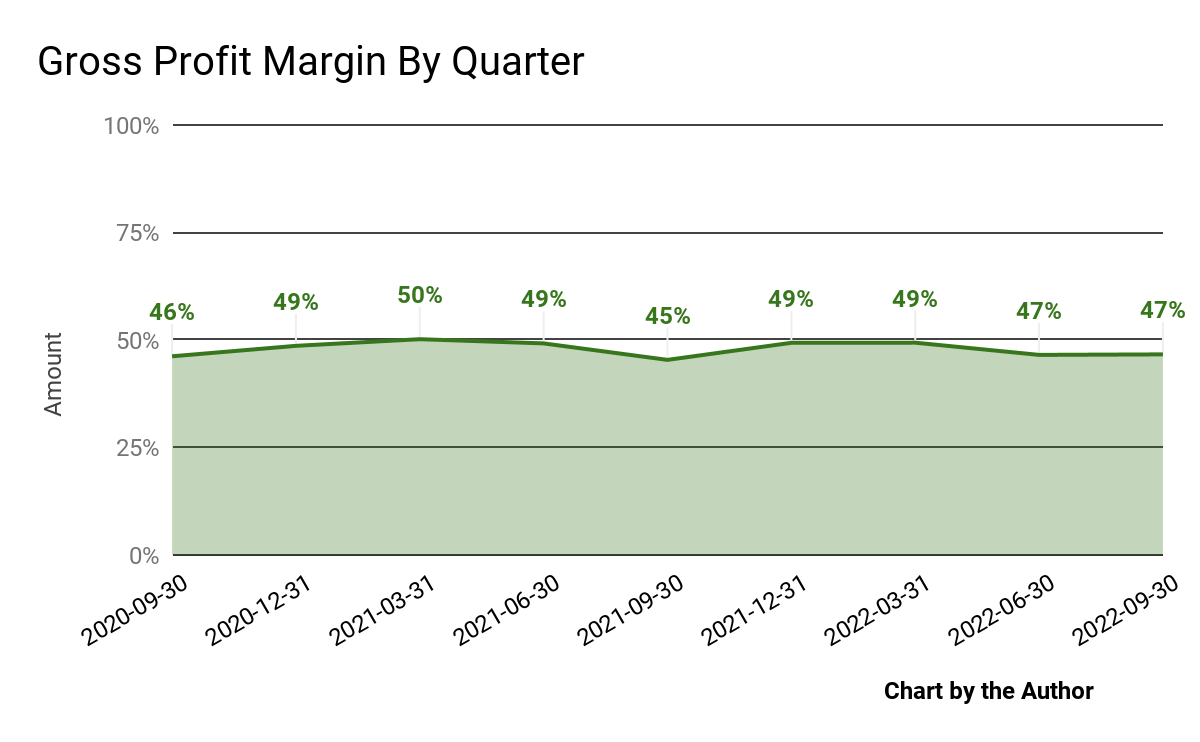
-
Selling, G&A expenses as a percentage of total revenue by quarter have dropped slightly recently:
9 Quarter Selling, G&A % Of Revenue (Financial Modeling Prep)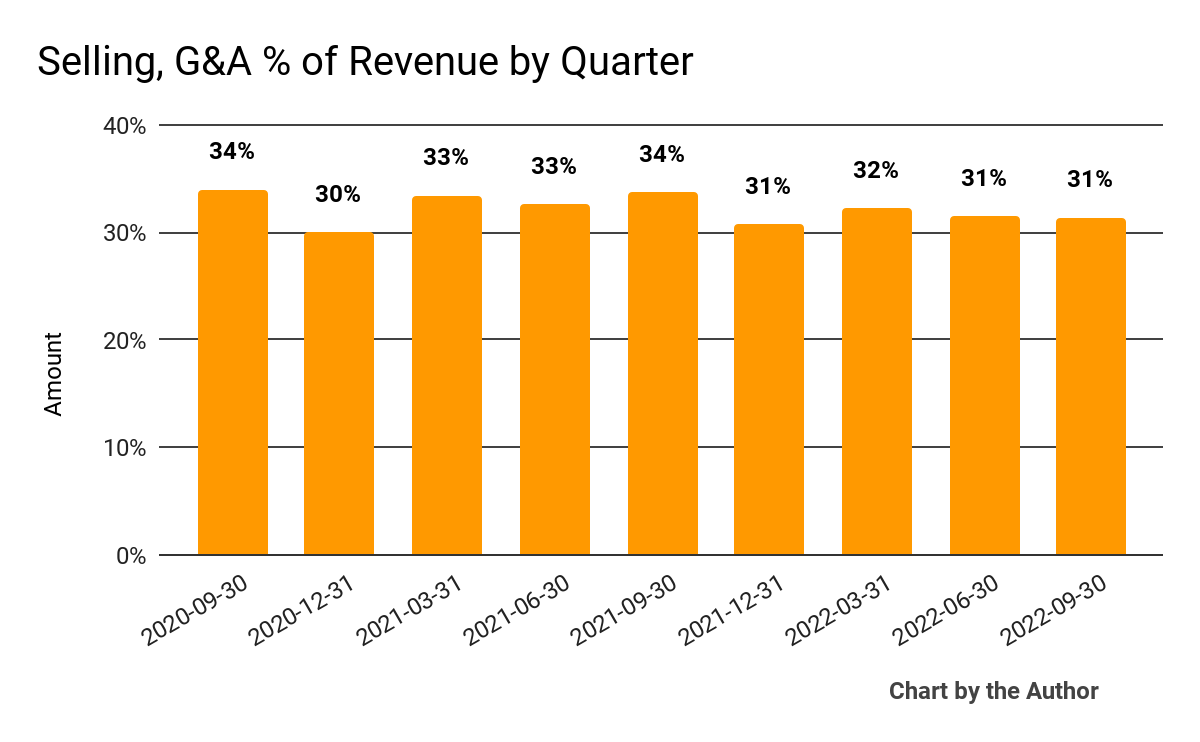
-
Operating income by quarter has been relatively volatile over the past nine quarters, as shown below
9 Quarter Operating Income (Financial Modeling Prep)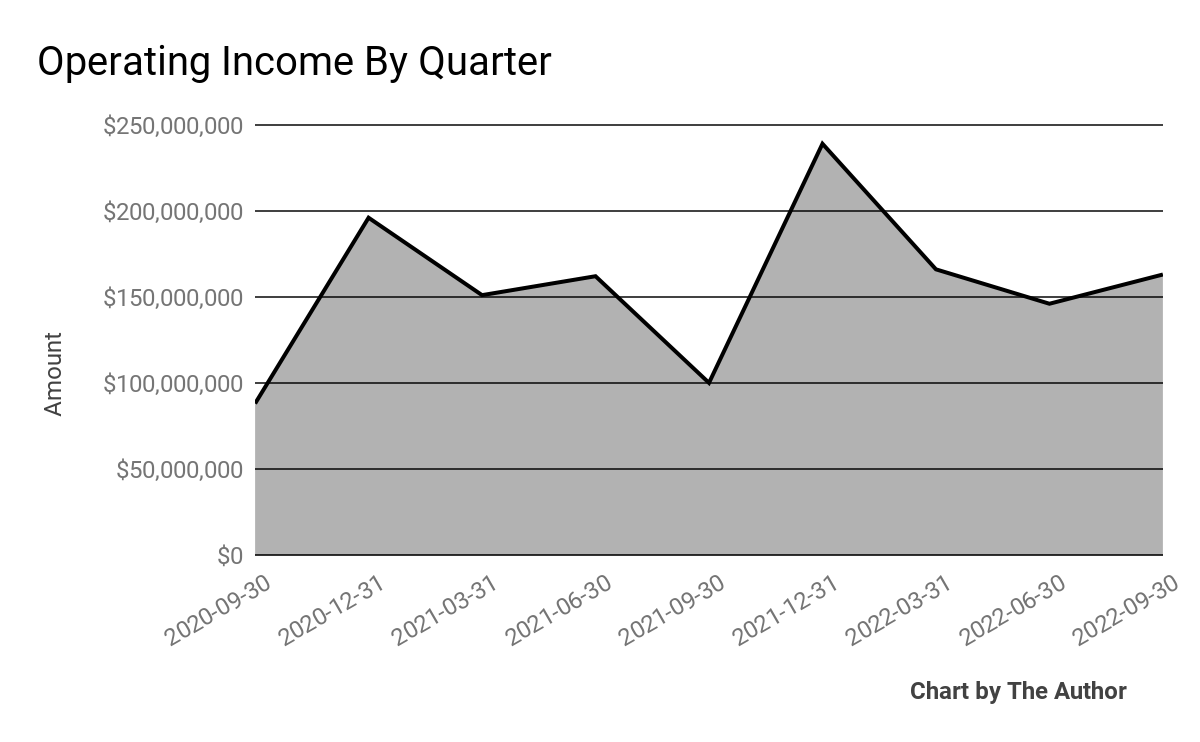
-
Earnings per share (Diluted) have fluctuated as follows:
9 Quarter Earnings Per Share (Financial Modeling Prep)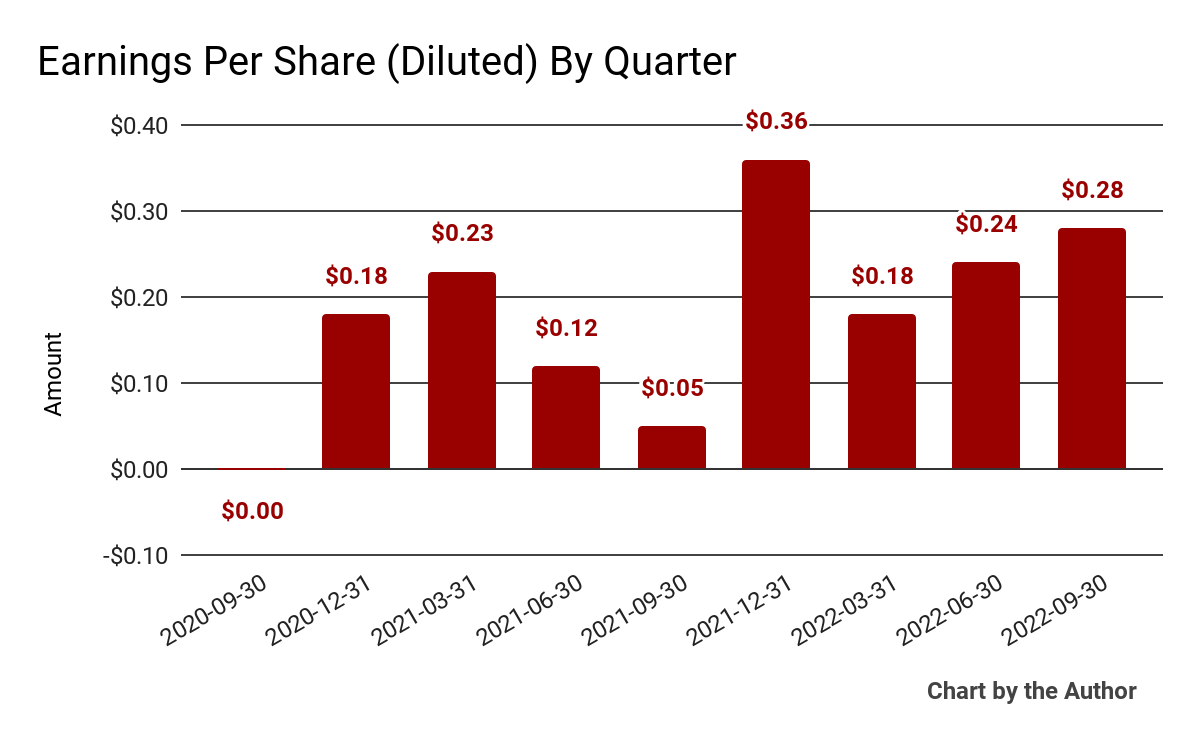
(All data in the above charts is GAAP.)
In the past 12 months, WMG’s stock price has dropped 19.3% vs. the U.S. S&P 500 index’s drop of around 20.1%, as the chart below indicates:
52-Week Stock Price Comparison (Seeking Alpha)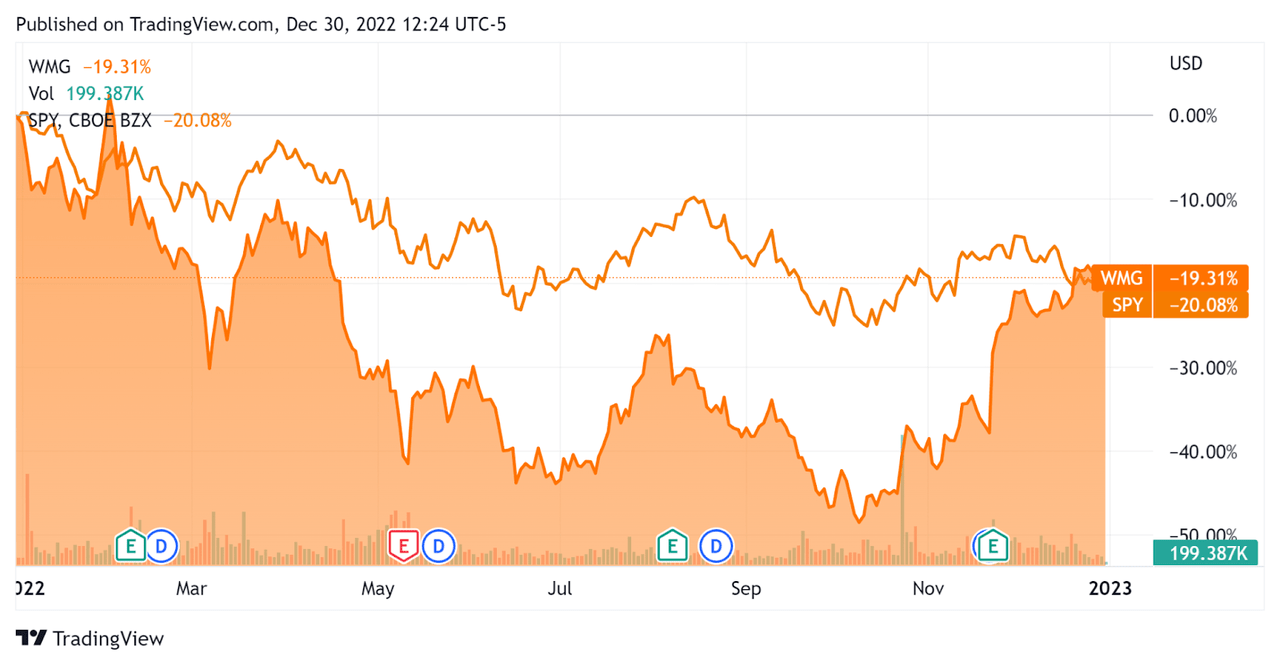
Valuation And Other Metrics For Warner Music Group
Below is a table of relevant capitalization and valuation figures for the company:
|
Measure [TTM] |
Amount |
|
Enterprise Value / Sales |
3.7 |
|
Enterprise Value / EBITDA |
18.4 |
|
Revenue Growth Rate |
11.7% |
|
Net Income Margin |
9.3% |
|
GAAP EBITDA % |
20.3% |
|
Market Capitalization |
$18,184,643,209 |
|
Enterprise Value |
$22,098,142,872 |
|
Operating Cash Flow |
$742,000,000 |
|
Earnings Per Share (Fully Diluted) |
$1.06 |
(Source – Financial Modeling Prep.)
As a reference, a relevant partial public comparable would be Universal Music Group (OTCPK:UMGNF); shown below is a comparison of their primary valuation metrics:
|
Metric [TTM] |
Universal Music Group |
Warner Music Group Corp. |
Variance |
|
Enterprise Value / Sales |
4.7 |
3.7 |
-20.4% |
|
Enterprise Value / EBITDA |
25.2 |
18.4 |
-27.0% |
|
Revenue Growth Rate |
20.5% |
11.7% |
-43.2% |
|
Net Income Margin |
7.2% |
9.3% |
29.7% |
|
Operating Cash Flow |
$1,320,000,000 |
$742,000,000 |
-43.8% |
(Source – Seeking Alpha and Financial Modeling Prep.)
Commentary On Warner Music Group
In its last earnings call (Source – Seeking Alpha), covering FQ4 2022’s results, management highlighted the firm being “challenged on multiple fronts as we navigated the tumultuous macro environment.”
The firm has produced growth across all of its revenue lines, seeing an increase in emerging streaming platform renewals which offset a decline in advertising revenue.
Notably, performance revenue rose the most, by 48% year-over-year, as the negative effects of the pandemic waned and live events returned.
As to its financial results, total revenue rose 16% year-over-year, as did adjusted EBITDA which excludes a material amount of stock-based compensation.
Gross profit margin and SG&A as a percentage of revenue have remained relatively flat, while operating income and earnings per share have fluctuated more so.
The firm is producing a positive trend in EPS in the two most recent quarters that bears watching.
For the balance sheet, the company finished the quarter with $586 million in cash, equivalents and trading asset securities and $3.7 billion in total debt.
Over the trailing twelve months, free cash flow was $607 million, of which capital expenditures accounted for $135 million.
Looking ahead, management sees strong growth potential for streaming as “global penetration continues to increase, and the next wave of emerging opportunities take shape.”
Regarding valuation, the market is valuing WMG at lower EV/Revenue and EV/EBITDA multiples than competitor Universal, which is not surprising given the firm’s lower growth rate.
The primary risk to the company’s outlook is continuing softness in online advertising, although management sees this as a temporary condition.
I see weakening consumer discretionary spending ahead as a global slowdown occurs, so I’m cautious about WMG’s ability to drive continued growth into the teeth of a widely expected recession in major regions, including Europe and the U.S.
Warner Music Group Corp. has rallied recently but is likely fairly valued where it is now, so I’m on Hold for the WMG stock at around $35.00.
Editor’s Note: This article discusses one or more securities that do not trade on a major U.S. exchange. Please be aware of the risks associated with these stocks.
Be the first to comment