

Mike Coppola
Stock Price Action
Apple
Warner Bros. Discovery (NASDAQ:NASDAQ:WBD) stock price currently trades at $13.20, down 83% from its all-time highs in March 2021. Some reasons for this massive decline include:
- Reason 1: Dividend-seeking AT&T (T) shareholders selling WBD stock
- Reason 2: Netflix (NFLX) losing of 200,000 subscribers in Q1Y22
- Reason 3: Strong competition in the streaming space
- Reason 4: High level of debt compared to peers
- Reason 5: Messy post-merger operations
- Reason 6: Lousy macroeconomic outlook
Investment Thesis
In this article, I analyze two main contributing factors to WBD’s depressed price to see if WBD’s price is justified. The two factors are WBD’s declining cable business and its huge debt load.
Declining cable business
It is no surprise that cable subscriptions have been declining fast. Here are some stats:
- According to Nielsen ratings, TV viewing has been dropping about 10% per quarter.
- In total, major US cable TV and satellite TV have lost 25 million subscribers since 2012, and are projected to lose another 25 million by 2025.
- Adults ages 18 through 29 are the largest age group without cable, with 34% of them not having subscriptions to satellite or cable TV services. It seems that the younger generation defaults straight to streaming and do not even consider cable TV as an option for content consumption.
However, not many know that streaming revenues are growing faster than declining cable revenues. Based on the projections by Statista in the figure below, a company that engages in both cable TV and streaming would experience net revenue growth. This is because revenue growth from Streaming would outpace declining revenue from Cable TV. This may mean that companies like WBD, Disney (DIS) and Paramount (PARA) would experience a 36% revenue growth from 2016 to 2026, a CAGR of 3.2%.
Consumer spending on pay TV and streaming video in the United States from 2016 to 2026 ($ billion)
Statista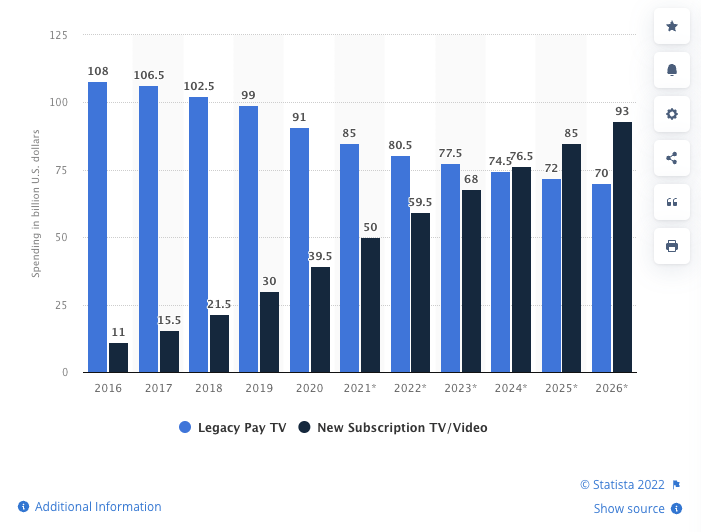
Note: The graph refers to revenues earned and not the number of subscribers.
It is important to note that the projections above only take account of revenues from subscription costs and not revenues gained from ads. Since ads will become more personalized in the streaming world, we can assume that ad revenue generated from streaming services will be greater than from cable tv services. For example, Discovery+ makes $11 a US subscriber from a $5 monthly fee and over $6 in advertising for only 3 minutes of ad time vs. $7 from their Cable TV services. This is 57% higher. It was no surprise therefore that WBD CEO stated, “If we lost a million [cable] subs…all we need to do is pick up 650,000 [streaming] subs in order to be making more money.”
Additionally, traditional cable TV companies that are moving into streaming can use the same content and earn from multiple channels.
Distribution of cord cutters in the United States in 2020 and 2021, by age group
Statista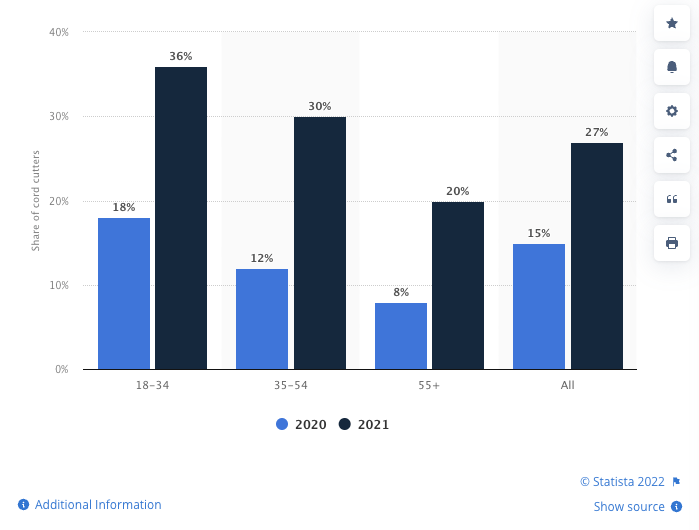
As can be seen from the graph, younger generations embrace streaming services faster than older generations do. Because of this lag in the adoption of streaming between the various age groups, there will be a period where households subscribe to both streaming services as well as cable services. This means companies like WBD, DIS and PARA can earn “double” the revenues for each show that it creates. WBD is producing Game of Thrones, and it can air it on both HBO Max and Linear TV, while NFLX can only air it on one platform. By “double” I do not mean exactly two times the revenues, but rather more than 1 time.
Moreover, viewers who keep the cord aren’t necessarily only watching cable and satellite TV content. Currently, 56% of Americans say they watch cable or satellite TV, while 78% of U.S. households have subscriptions to NFLX, Amazon Prime, or Disney+. This clearly indicates that there is an overlap in consumers. Knowing this, would you prefer owning a company that can only distribute its shows on its streaming platform or a company that can distribute its shows on both Linear TV and Streaming?
It is also important to differentiate between subscribers and viewership. Subscriber refers to the number of people who pay for the service, while viewership refers to the number of people who view the shows. Today, Netflix has more viewers than all of cable and satellite TV combined. However, cable still leads in terms of the number of subscribers. That is why in the second chart of this article shows that subscribers are still spending more on pay TV than streaming. This goes to show that the cable TV space is still a highly lucrative market, and suggests that although people spend more time on streaming platforms than on cable TV, they are unwilling to cancel their cable subscriptions perhaps because of some shows that are only aired there. Take for example sports, news, and reality TV. The inflexion point where streaming will overtake Linear TV in consumer spending is only expected to occur in 2024. Therefore, owning a company that has access to lucrative residual revenues from Linear TV as well as exposure to streaming is a smart move.
Manageable debt
Taking into account the $6 billion in debt WBD paid off in August, WBD should have a total debt figure of $47 billion. Compared to its peers, its debt levels are on the higher end. In an increasing interest rate environment and an anticipated economic downturn, companies with high debt levels are more at risk of going bankrupt. As such, the market has punished the stock. But let’s dig more into it.
According to management’s presentation, only 29% of total debt, or $13.6 billion of debt is due within the next 3 years. Fortunately, the average maturity of its debt is 14 years. The average cost of debt is 4.3%. Fortunately, 87% of its debt is fixed, while 13% is variable.
Panther Research WBD 2022 Q2 Presentation WBD 2022 Q2 Presentation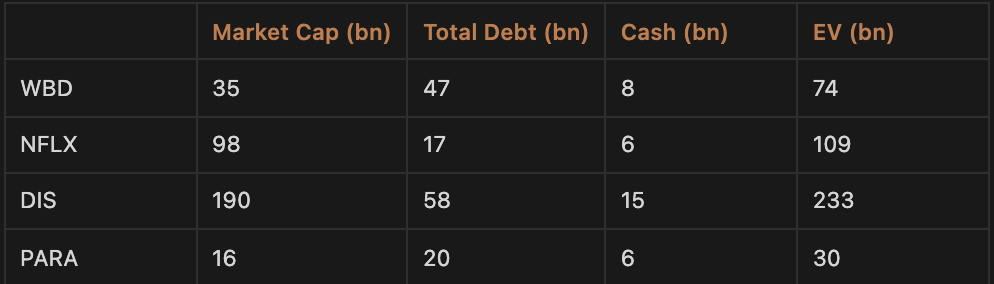


WBD defines gross leverage target as gross debt divided by the sum of the most recent four quarters’ adjusted EBITDA. Thus, to make sense of their expected gross leverage target of 3.0x by the end of 2024, we have to take a look at management’s expectations of adjusted EBTIDA in 2024 as well.
Management expects an adjusted EBITDA of $9 Billion for 2022 and $12 Billion for 2023. I will conservatively assume an adjusted EBITDA of $13 Billion for 2024. Based on this assumption and taking management’s expectation of a 3x gross leverage ratio for 2024, it implies a debt target of $39 billion. That means that the company will pay down at least $8 billion of debt in 2023 and 2024.
At the surface level, this seems a reasonable goal to meet. Management has targeted 3 billion in cost synergies. Thankfully, during the last earnings call, CFO Wiedenfels stated the $3 billion target might be conservative.
“I am very pleased with how well the program has progressed so far and based on the savings potential in our initiative funnel, I have full confidence that we will expect at least $3 billion of synergies overall, with $2 billion to $3 billion of synergy realization in 2023. Naturally, we’ll update the market regularly as certainty on value and timing increases.” Q2 Earnings Call.
Retail investors can confirm management’s moves by assessing the various measure already reported in the news. Here are some of management’s latest corrective measures:
- Shutting down CNN
- Layoffs of the advertising sales team
- Layoffs of HBO Max employees as HBO Max mergers with Discovery+
- Shutting down high-cost projects
- Selling certain cable networks
According to management, the company will be able to generate a free cash flow of around $3 billion in 2022 and $4 billion in 2023. This is more than enough to cover the $1.3 billion due in 2023 and $4.3 billion due in 2024. Therefore, WBD will unlikely face any financial trouble in the years ahead.
Financials
Revenues & Adj EBITDA
Panther Research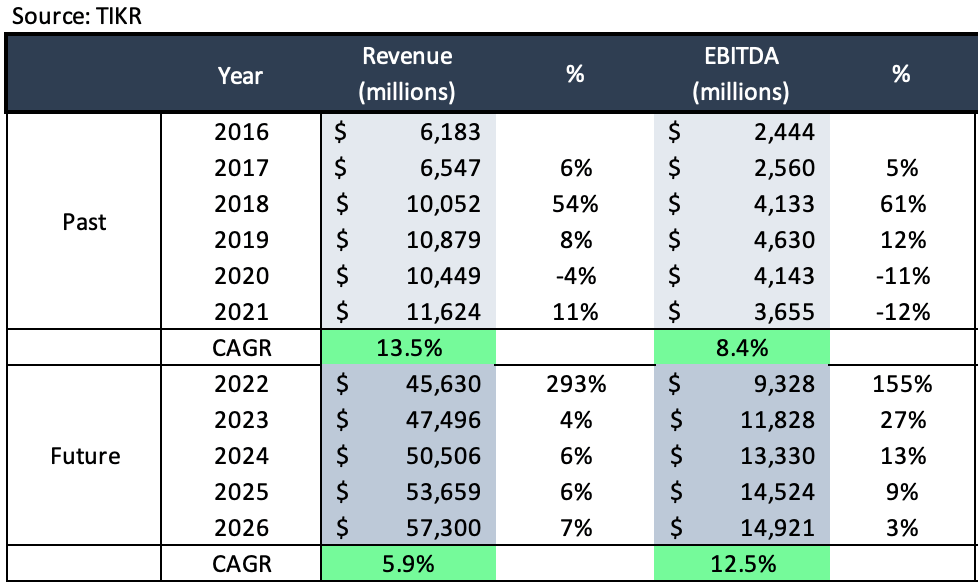
Note: Based on analyst estimates on 6 Sept 2022
Note: Above is adjusted EBITDA
Analysts expect future revenues to grow at 5.9% over the next 4 years. Additionally, they expect adjusted EBITDA to grow at a rate of 12.5% for the next 4 years and reach $14.5 billion in 2025.
FCF
Panther Research Panther Research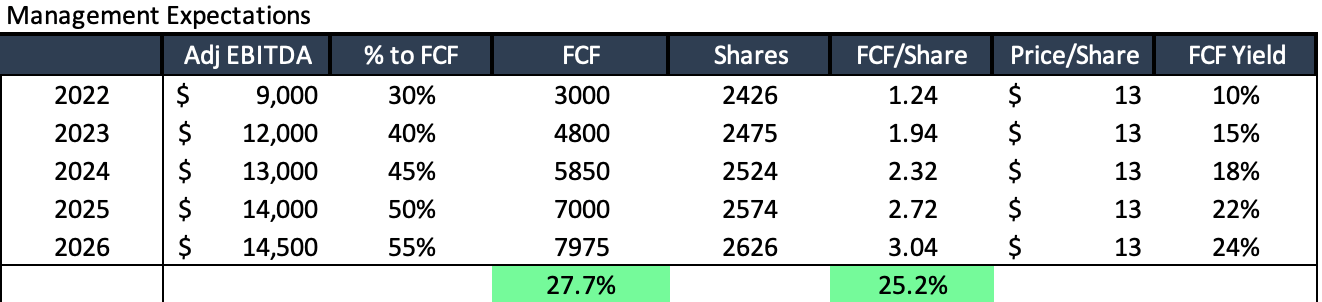
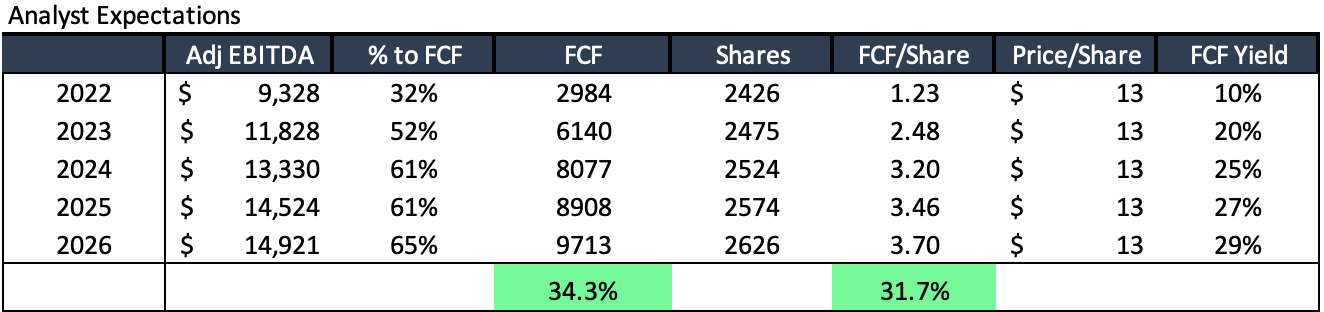
Note: The above is based on analyst estimates on 6 Sept 2022
Analysts are more optimistic than management and expect FCF to grow at 34% over the next 4 years and the company to have an FCF yield of 29% in 2026! Analyst expectations for FCF growth are more optimistic than management. However, they are not very far apart and seem reasonable to me. Both managements and analysts’ FCF do not include cash outflow for repayment of debt. However, in both cases both management and analysts expect FCF to be more than enough to pay down its expiring debt of $5.6 billion in 2023 and 2024.
EV/EBITDA
Panther Research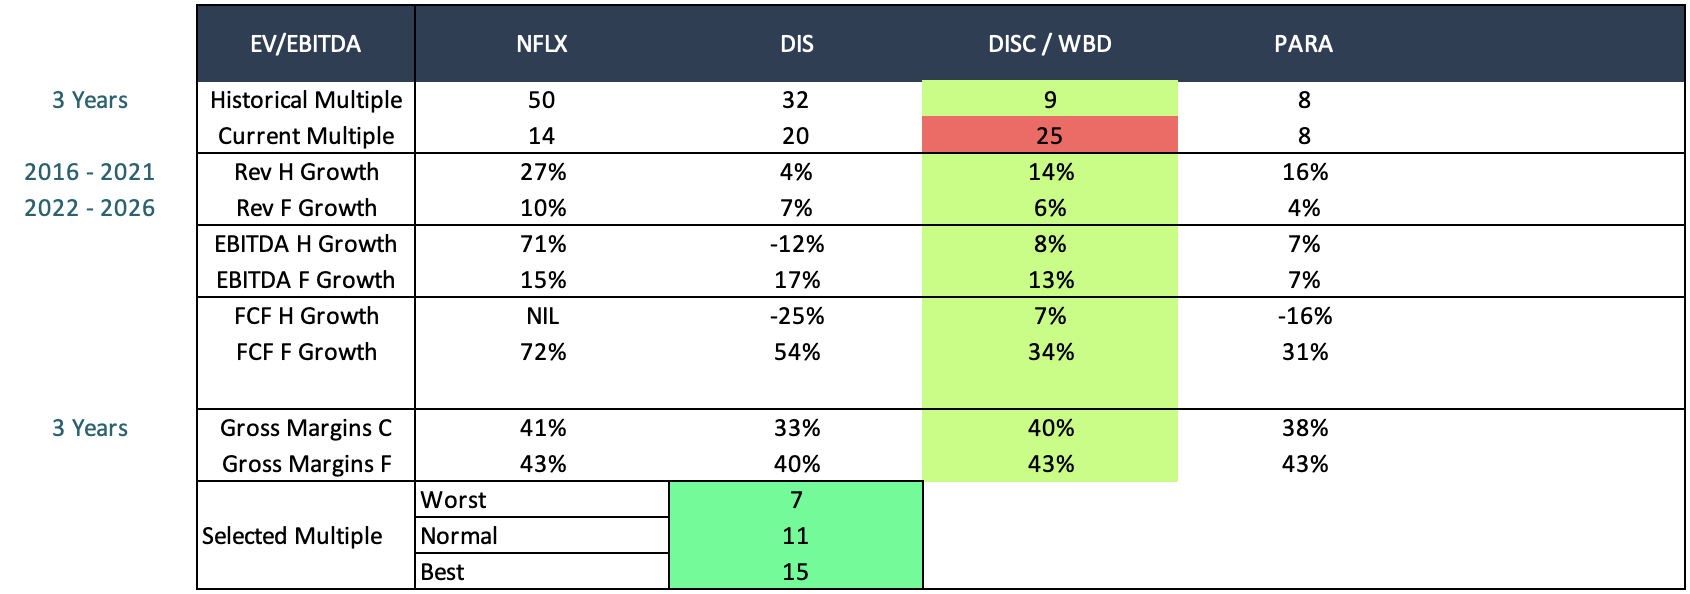
WBD is currently trading at an EV/EBITDA multiple of 25x. However, this current multiple is misleading, as management has stated that it expects peak EBITDA losses this year, and the LTM EBITDA does not represent WBD’s EBITDA but Discovery’s EBITDA. Thus, we should not place emphasis on its current multiple but come up with a reasonable multiple by looking at its peers for reference.
Based on a relative comparison with its peers, I have chosen the following 3 cases:
So the three cases are:
- Normal Case Multiple: 11X
- The streaming war ends, and WBD emerges as one of the winners.
- The streaming business is slightly more profitable than the linear business.
- Bear Case Multiple: 7X
- The streaming war continues.
- The streaming business is less profitable than the linear business.
- Bull Case Multiple: 15X
- The streaming war ends, and WBD emerges as the second biggest streaming platform.
- The streaming business is much more profitable than the linear business.
Panther Research
Using the current stock price of $13 and analyst estimated 2025 EBITDA of $14,524 million with scenario analysis, weighting 80% for the normal case and 10% for the other 2 cases, combined with a final 15% margin of safety, I get a TP of $41 for 2025, representing a 227% upside from today’s prices (34% CAGR).
Panther Research
Looking at the current macroeconomic environment, it is also possible that analysts overstated 2025’s EBITDA. To be conservative, let us use a lower 2025 EBITDA estimate of $13,000 million. For this case, with a margin of safety of 15%, we have a TP of $35 for 2025, representing a 183% upside from today’s prices (30% CAGR).
Conclusion
From my analysis, it is obvious that WBD does indeed have a massive amount of debt. Fortunately, most of it is not due anytime soon and has a fixed interest rate. What debt is due in the coming years can easily be paid down with its expected free cash flows. Moreover, having seen how quickly and effectively the cost-cutting measures were executed, I think it is likely that WBD’s debt load will not pose a problem.
Moreover, although WBD’s cable business is declining, it is declining more slowly than the growth in its streaming business. Since it is a profitable cash register currently, why not use it? To me, it seems that traditional media companies like WBD, PARA and DIS, can weather the streaming wars better than NFLX can.
Be the first to comment