

JHVEPhoto/iStock Editorial via Getty Images
Manulife (NYSE:MFC) is the largest insurance company in Canada on the basis of assets. The company is the 2nd largest in North America and the world’s 5th largest in terms of market capitalization. The company operates 3 major business lines: insurance and annuities, wealth and asset management, and corporate and other segments (property and casualty and reinsurance). While the company has been able to maintain and even slightly grow earnings through the COVID years, the shares have dropped substantially since mid-May, largely because of the market coming to grips with a new international accounting standard that will come into effect in January of 2023, IFRS 17, that will markedly impact reported earnings (see slide 4) and the dividend payout ratio. Another factor in the share price decline was a small earnings miss for Q1, reported on May 11th, largely due to COVID-related slowdowns in business in Asia.
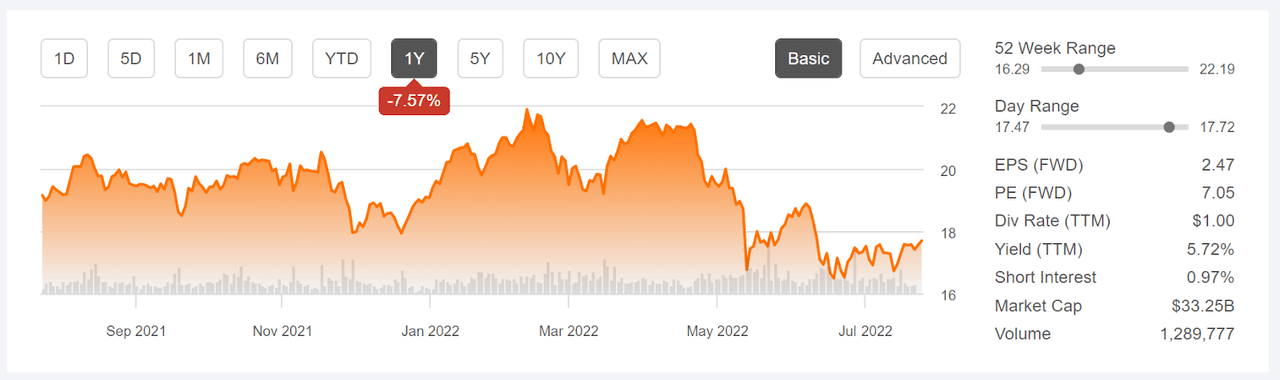
12-month price history and basic statistics for MFC (Seeking Alpha)
The shares hit a 12-month high close of $21.91 on February 10th, but have subsequently declined by 19% to the current level of $17.70. While MFC’s YTD, 1- and 3-year annualized total returns are greater than the average for the life insurance industry as a whole (as calculated by Morningstar), the returns are low overall for the 1-, 3-, and 5-year periods. The 3- and 5-year annualized total returns for MFC are 2.5% and 1.3% per year, respectively, as compared to 11.7% and 11.8% per year for the S&P 500 (SPY), over these two periods.
As noted previously, MFC has maintained notably steady earnings over recent years, with Q1 of 2020 being the only notable miss. That said, there is very little in the way of earnings growth over the past 4 years and the consensus outlook is for very modest growth for 2022 and 2023.
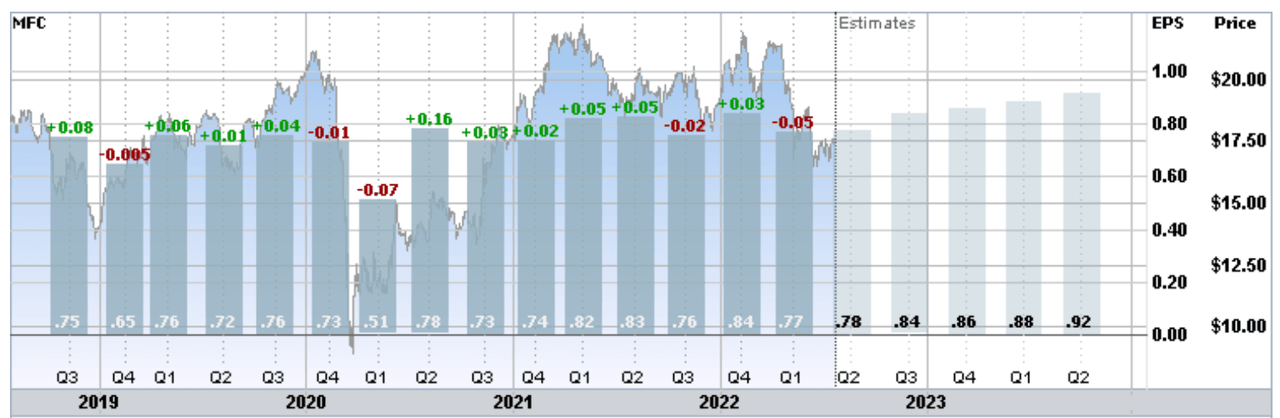
Trailing (4 years) and estimated future quarterly EPS for MFC. Green (red) values are amounts by which EPS beat (missed) the consensus estimate (E-Trade)
A notable feature of MFC is the very high dividend yield, 5.7%, with an 11.3% annualized dividend growth rate over the past 5 years. The payout ratio, 37%, is reasonable but will increase in 2023 as a result of the new accounting standard. While the P/E is very low as compared to historical levels, the ratio will rise in January of 2023 due to the change in accounting as well.
I last wrote about MFC on February 22, 2022, 5.1 months ago, at which time the shares were trading at $20.82 and I maintained a buy/bullish rating. At that time, the Wall Street consensus rating on MFC was bullish and the 12-month consensus price target was about 18% above the share price. Then, as now, the fundamentals looked solid for a low-growth income stock. In addition, rising interest rates tend to be favorable for insurance companies because of a reduction in the net present value of liabilities. Along with fundamentals and the Wall Street consensus outlook, I also rely on the market-implied outlook, a probabilistic forecast calculated from options prices that represents the implicit consensus view among buyers and sellers of options. The market-implied outlook to the middle of September of 2022 was significantly bullish. Since my post, MFC has returned a total of -13.0% vs. -7.5% for the S&P 500.
For readers who are unfamiliar with the market-implied outlook, a brief explanation is needed. The price of an option on a stock is largely determined by the market’s consensus estimate of the probability that the stock price will rise above (call option) or fall below (put option) a specific level (the option strike price) between now and when the option expires. By analyzing the prices of call and put options at a range of strike prices, all with the same expiration date, it is possible to calculate a probabilistic price forecast that reconciles the options prices. This is the market-implied outlook. For a deeper explanation and background, I recommend this monograph published by the CFA Institute.
With 5 months since my last analysis, a period over which interest rates have surged, I have calculated an updated market-implied outlook for MFC and I have compared this with the current Wall Street consensus outlook in revisiting my position on this stock.
Wall Street Consensus Outlook for MFC
E-Trade calculates the Wall Street consensus outlook for MFC using ratings and price targets from 11 ranked analysts who have published their views over the past 3 months. The consensus rating is bullish and the consensus 12-month price target is 21.8% above the current share price. For my analysis in February, the consensus 12-month price target was $24.13. There is a fairly large spread in the individual price targets, ranging from +0.6% to +48.7%, lowering the confidence in the value of the consensus as a predictive measure.
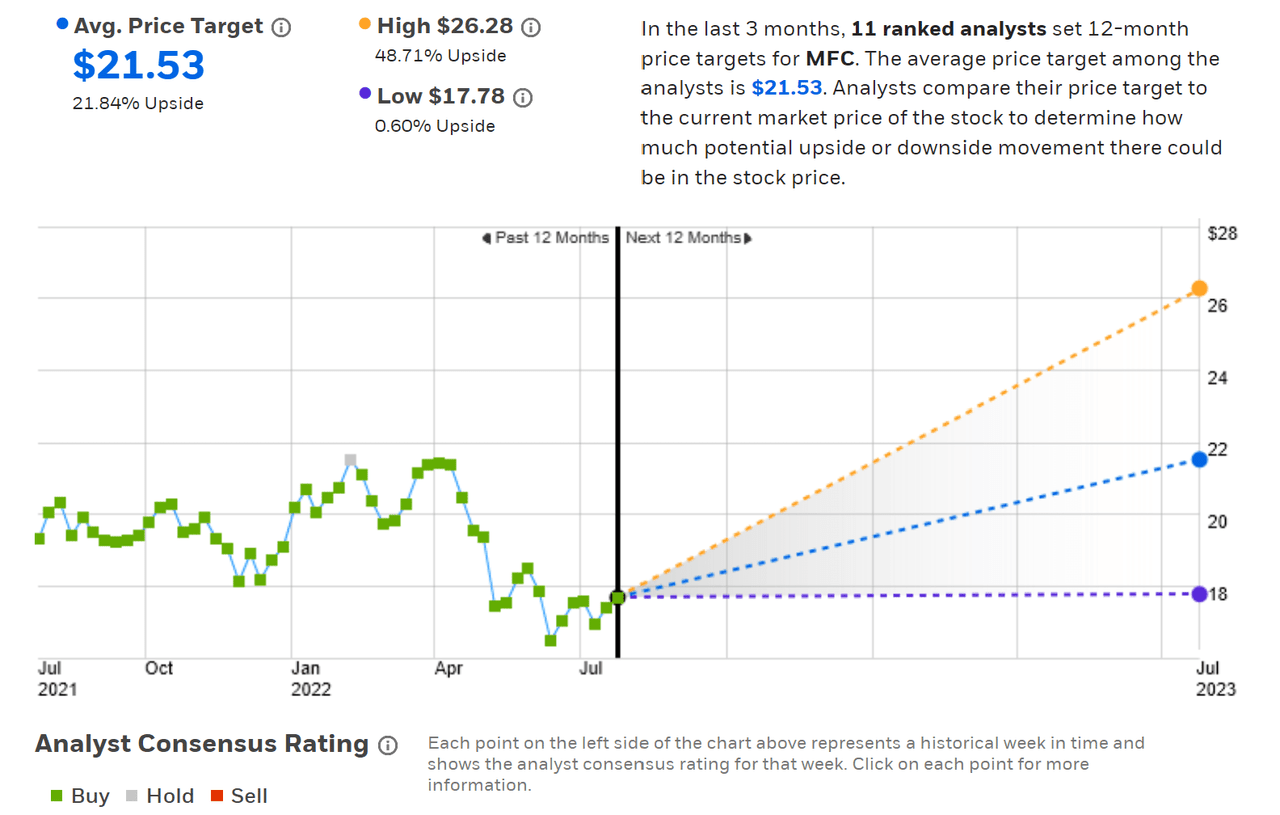
Wall Street analyst consensus rating and 12-month price target for MFC (E-Trade)
Seeking Alpha’s calculation of the Wall Street consensus uses ratings and price targets from 15 analysts. The consensus rating is neutral and the consensus 12-month price target is $22.03, 24.6% above the current share price. For my February post, Seeking Alpha reported a 12-month consensus price target of $24.70.
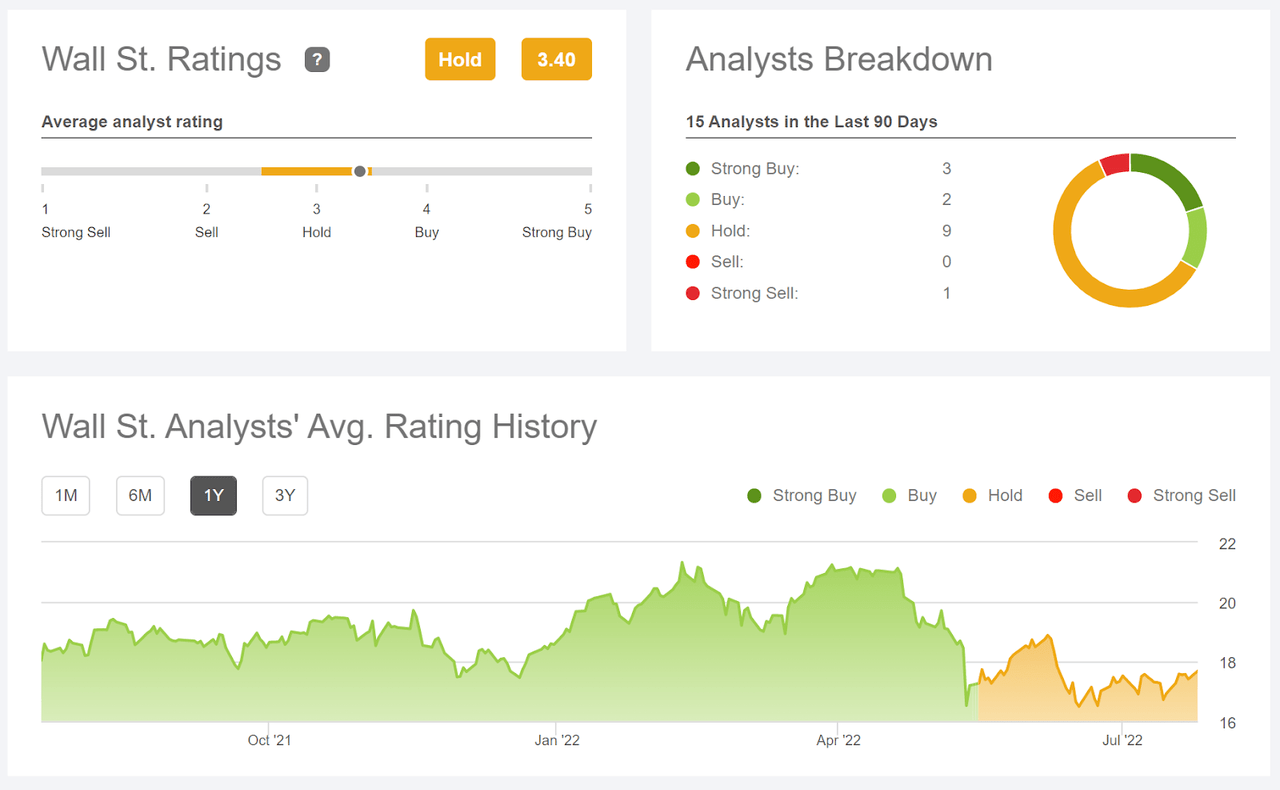
Wall Street analyst consensus rating for MFC (Seeking Alpha)
While the consensus 12-month price target for MFC implies attractive upside potential for the next 12 months, the price target is lower than it was five months ago. A 12-month total return of 28%-29% for MFC would be dramatic.
Market-Implied Outlook for MFC
I have calculated the market-implied outlook for MFC for the 4.7-month period from now until December 16, 2022, using the price of call and put options that expire on this date. I selected this specific expiration date to provide a view through the rest of 2022. In addition, the options expiring later than December of 2022 are thinly traded at present, reducing confidence in the representativeness of the prices. The open interest in the December 2022 options is also light.
The standard presentation of the market-implied outlook is a probability distribution of price return, with probability on the vertical axis and return on the horizontal.
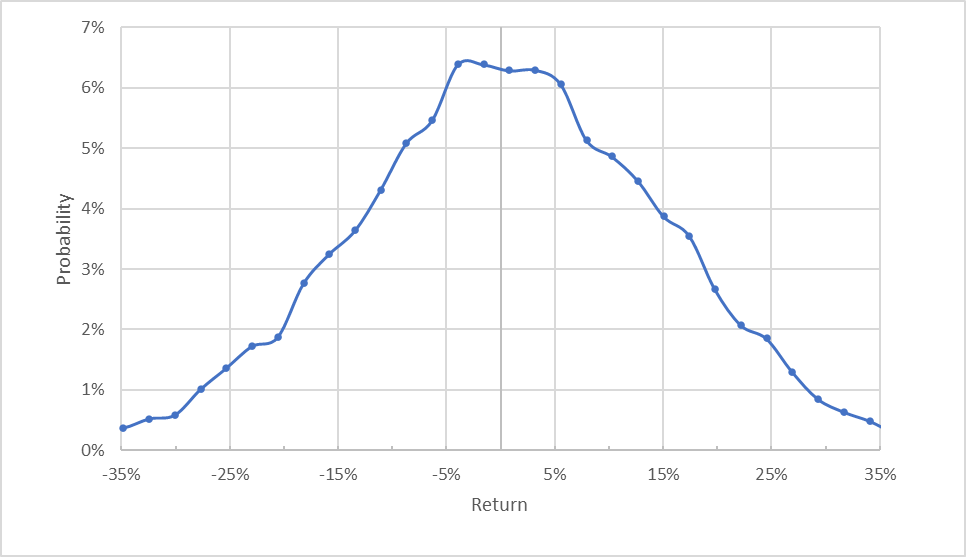
Market-implied price return probabilities for MFC for the 4.7-month period from now until December 16, 2022 (Author’s calculations using options quotes from E-Trade)
The market-implied outlook to December 16th is quite symmetric, with comparable probabilities of positive and negative returns of the same magnitude. The expected volatility calculated from this distribution is 29.5%, slightly higher than the implied volatility for the December options calculated by E-Trade, 27%. In my analysis in February, I calculated an expected volatility of 25% to 27% for MFC through Q3 of 2022.
To make it easier to compare the relative probabilities of positive and negative returns, I rotate the negative return side of the distribution about the vertical axis (see chart below).
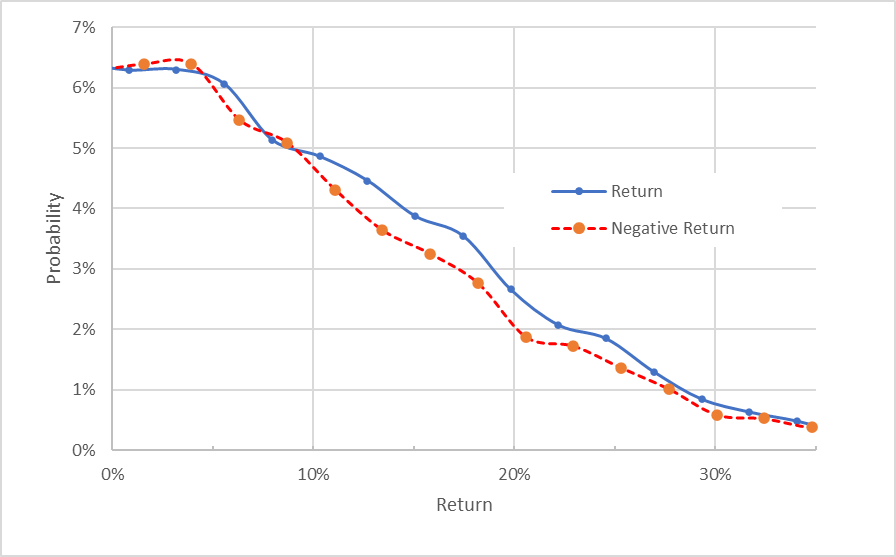
Market-implied price return probabilities for MFC for the 4.7-month period from now until December 16, 2022. The negative side of the distribution has been rotated about the vertical axis (Author’s calculations using options quotes from E-Trade)
This view shows a definite bullish tilt in the market-implied outlook, with the probabilities of positive returns tending to be slightly higher than for negative returns of the same size, across the range of possible outcomes (the solid blue line is above the dashed red line over most of the chart above). For smaller-magnitude returns, the probabilities match up quite closely, however (see the left quarter of the chart).
Theory indicates that the market-implied outlook is expected to have a negative bias because investors, in aggregate, are risk averse and thus tend to pay more than fair value for downside protection. There is no way to measure the magnitude of this bias, or whether it is even present, however. Considering this potential bias reinforces the bullish interpretation of the market-implied outlook to the end of 2022.
It is worth noting that the market-implied outlook is considerably less bullish than it was back in February.
Summary
Rising interest rates should be a tailwind for MFC, but uncertainty as to the impacts of COVID, particularly in Asia, increase uncertainty for near-term earnings. In addition, while MFC’s wealth and asset management has delivered solid results, declining markets are hard on this type of business. The change in accounting rules is also something of a wildcard in terms of how the market will reprice the shares in the face of reduced reported earnings. Even with these risks, however, MFC looks like a reasonable bet. The Wall Street consensus rating is a buy or a hold, depending on the source, and the consensus 12-month price target implies a 12-month total return of around 28%. As a rule of thumb for a buy rating, I want to see an expected 12-month return that is at least ½ the expected annualized volatility. Even discounting the Wall Street price target considerably, MFC would exceed this threshold (using the expected volatility of 29.5% from the market-implied outlook). The market-implied outlook to the end of 2022 is also somewhat bullish, although the limited open interest in options on MFC reduces the weight that I give to this result. With generally favorable conditions for insurers, along with positive outlooks from Wall Street and the options market, as well as the 5.7% yield, I am maintaining my buy rating on MFC.
Be the first to comment